


Abstract
Graham et al. found a sample of active galactic nuclei (AGNs) and quasars from the Catalina Real-time Transient Survey (CRTS) that have long-term periodic variations in optical continuum. The nature of the periodicity remains uncertain. We investigate the periodic variability characteristics of the sample by testing the relations of the observed variability periods with AGN optical luminosity, black hole mass and accretion rates, and find no significant correlations. We also test the observed periods in several different aspects related to accretion discs surrounding single black holes, such as the Keplerian rotational periods of 5100 Å photon-emission regions and self-gravity dominated regions and the precessing period of warped discs. These tests shed new lights on understanding AGN variability in general. Under the assumption that the periodic behaviour is associated with supermassive black hole binary systems in particular, we compare the separations (|${\scr {D}}_{\bullet }$|) against characteristic radii of broad-line regions (|$R_{\scriptscriptstyle {\rm BLR}}$|) of the binaries and find |${\scr {D}}_{\bullet }\approx 0.05R_{\scriptscriptstyle {\rm BLR}}$|. This interestingly implies that these binaries have only circumbinary BLRs.
INTRODUCTION
The optical and ultraviolet spectra of active galactic nuclei (AGNs) and quasars have been understood profoundly since their discovery. Accretion on to supermassive black holes (SMBHs) located in galactic centres is powering the giant emissions of AGNs and quasars through release of gravitational energy of the infalling gas (Rees 1984). It is well understood that the broad emission lines arise from gas photoionized by accretion discs of SMBHs (Osterbrock & Mathews 1986). According to the hypothesis of supermassive black hole binaries (SMBHBs; Begelman, Blandford & Rees 1980), there should be some AGNs and quasars powered by them at least (Gaskell 1983), manifesting with double-peaked or asymmetric emission lines (Shen & Loeb 2010) and long-term periodic variations (Runnoe et al. 2015). Although there are indeed growing indirect evidence for SMBHBs (see e.g. Yan et al. 2015, based on special characteristic of spectral energy distributions, or Liu, Li & Komossa 2014, based on features of tidal disruption event in galactic centres), identification of them, in particular in sub-parsec scale, is still challenging.
Since long-term monitoring campaigns are extremely time-consuming, only a few AGNs and quasars, such as OJ 287 (Valtonen et al. 2008), PG 1302-102 (Graham et al. 2015a) and PSO J334.2028+01.4075 (Liu et al. 2015), have been found to exhibit long-term periodic (or quasi) variations of a few to ∼10 yr in optical and ultraviolet continuum. A major advance was made recently by Graham et al. (2015b, hereafter G15b), who performed a systematic search for the long-term periodical variations of continuum in quasars covered by the Catalina Real-time Transient Survey (CRTS) and finally identified more than 100 candidates. Periodic variability is generally believed to be a common signature of SMBHBs, but there also exist alternative explanations (Graham et al. 2015a; Li et al. 2016; G15b). The CRTS sample offers an opportunity to test the periodicity and probe the properties of SMBHBs. In this paper, we extend the G15b study to show more statistics of the long-term periodicity. Throughout this work, we assume a standard Λcold dark matter (ΛCDM) cosmology with H0 = 67 km s−1 Mpc−1, ΩΛ = 0.68 and ΩM = 0.32 (Planck Collaboration XXXI 2014).
THE SAMPLE
The CRTS sample consists of 111 quasars with unambiguous observed periods from a few to ∼5 years, as listed in table 1 of G15b. We cross-checked the sample with Sloan Digital Sky Survey (SDSS) data and found available spectra for 90 quasars. Data reduction of the SDSS spectra followed the procedures described in Hu et al. (2008). We measured the 5100 Å luminosity and full width at half-maximum (FWHM) of the broad Hβ and Mg ii lines. We used a relation of L5100 = 0.56L3000 to convert the ultraviolet continuum into 5100 Å (Shen et al. 2008).
The sample properties. Columns are the objects name, redshifts, optical luminosity, black hole mass, accretion rates, the radii of emitting 5100 Å photons and BLR, and separations of the black hole binaries calculated from Kepler's law, respectively. (The full version is available in a machine-readable form in the online. A portion is shown here for guidance regarding its form and content.)
| Object | z | log L5100 | log (M•/M⊙) | log |$\dot{\scr {M}}$| | log (R5100/cm) | log (RBLR/cm) | log (|$\scr {D}_{\bullet }/$|cm) |
|---|---|---|---|---|---|---|---|
| (erg s−1) | |||||||
| UM 234 | 0.729 | 45.35 ± 0.12 | 9.19 ± 0.55 | −2.28 ± 0.73 | 15.16 ± 0.54 | 17.70 ± 0.21 | 16.54 ± 0.18 |
| SDSS J014350.13+141453.0 | 1.438 | 45.65 ± 0.10 | 9.21 ± 0.53 | −1.87 ± 0.71 | 15.31 ± 0.53 | 17.87 ± 0.20 | 16.40 ± 0.17 |
| US 3204 | 0.954 | 45.39 ± 0.15 | 8.95 ± 0.57 | −1.74 ± 0.76 | 15.19 ± 0.57 | 17.73 ± 0.24 | 16.40 ± 0.19 |
| SDSS J072908.71+400836.6 | 0.074 | 43.53 ± 0.08 | 7.00 ± 0.52 | −0.63 ± 0.68 | 14.25 ± 0.51 | 16.72 ± 0.18 | 15.92 ± 0.17 |
Note that equation (2) only applies to local quasars with Hβ emission line (z < 0.7). For high-z quasars, we used the extended relation of equation (2) using Mg ii emission line (Vestergaard & Peterson 2006). We then use the obtained black hole mass to calculate the parameters of accretion discs and extensively explore if the observed long-term periods are related to accretion discs (see Section 3 below).
In Table 1, we list the main properties of the sample. G15b determined the observed periods of the sample by the WWZ–ACF method, which gives a typical uncertainty of 10 per cent for the periods. For the uncertainties of black hole mass estimate, we included the intrinsic scatters of 0.4 dex (Vestergaard & Peterson 2006). For the uncertainties of 5100 Å luminosity L5100, we digitized the light curves from G15b (see their fig. 7) and included the standard deviation of light curves.
Figs 1e–h plot the distributions of the observed periods, 5100 Å luminosities, black hole mass and accretion rates (see Section 3 for a definition). The current sample shows that (1) the period peaks at ∼800 d; (2) the luminosity cover from ∼ 1044 erg s− 1 to ∼ 1047 erg s− 1; (3) the black hole mass at ∼109 M⊙, but extends to 1010 M⊙; and (4) the accretion rate spans from ∼10−3 to 10−1. The moderate accretion rates indicate that the objects of the sample are in the regime of standard accretion disc model, which is described by Shakura & Sunyaev (1973).
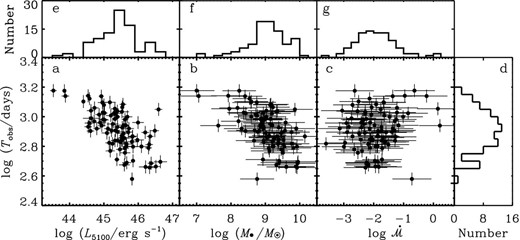
The observed Tobs in rest-frame versus luminosity (L5100), black hole mass (M•) and accretion rates (|$\dot{\scr {M}}$|) in panels (a, b, c). The apparent correlations are spurious and caused by the redshift effect (see Section 3.1 for details), panels (d, e, f, g) are the distribution of (Tobs, L5100, M•, |$\dot{\scr {M}}$|).
STATISTICS OF THE PERIODS
Correlations with L5100, M• and |$\dot{\scr {M}}$|
Fig. 1 shows the relation between the rest-frame periods with the 5100 Å luminosities, black hole mass and accretion rates, respectively; apparent correlations can be seen. However, we note that the sample selection is based on both the magnitude limit and the time-span of the monitoring (∼9 years). Since the redshift distribution of the sample spans a wide range of z ∼0–3, the relations of the rest-frame periods with AGN parameters will be significantly distorted by the redshift effect. Specifically, high-z quasars have higher luminosities but smaller rest-frame periods, leading to spurious correlations. We employ partial correlation analysis (see the Appendix) to quantitatively test if the correlations are caused by the redshift effect. The Spearman rank-order coefficients of the correlation between log Tobs and (log L5100, log M•, |$\log \dot{\scr {M}}$|) are |${\boldsymbol r}=(-0.64, -0.60, 0.14)$|, respectively. The coefficients of the correlation between (log Tobs, log L5100, log M•, |$\log \dot{\scr {M}}$|) and redshift are |${\boldsymbol r}=(-0.73, 0.81, 0.77, -0.16)$|, respectively. The partial correlation coefficients between log Tobs and (log L5100, log M•, |$\log \dot{\scr {M}}$|) are |${\boldsymbol r}=(-0.10, -0.09, 0.03)$| with null probabilities of p = (0.08, 0.10, 0.20), respectively. The low values of the partial correlation coefficients confirm that the apparent correlations are spurious. There is no significant correlation between the rest-frame period and optical luminosity, black hole mass and accretion rate.
If the periodicity arises from accretion discs of single black holes, the observed variability period and our correlation analysis provide useful restraints on variability models in accretion discs. For example, Clarke & Shields (1989) proposed a theoretical model based on disc thermal instability and predicted that the continuum variations of AGN obey a relation of P ∝ L1/2, and the time-scale >100 yr for the high-luminosity AGNs, which is much longer than the observed periods of G15b sample.
On the other hand, under the SMBHB hypothesis, one may expect that the orbital period would depend on the total black hole mass of the system. However, partial correlation analysis shows that there is no correlation between the period (Tobs in rest frame) and measured black hole mass. The intrinsic scatter of black hole mass estimated from the R–L5100 relation is as large as 0.43 dex (e.g. Vestergaard & Peterson 2006). Meanwhile, the possible biases between measured black hole mass and ‘true’ mass may lead to additional scatters (e.g. Shen et al. 2008). It is plausible that the intrinsic correlation between the periods and black hole mass is smeared out due to the large scatter of mass measurements.
Characteristic periods of accretion discs surrounding single black holes
We now turn to calculate the following four characteristic periods of accretion discs surrounding single black holes to test if they can account for the observed periods.
Fig. 2 compares the rest-frame Tobs with T5100, TSG, Tmean and TWD in the top panels, and plots their respective ratios in the bottom panels. We find that Tobs is much longer than T5100, but shorter than TSG, namely T5100 < Tobs < TSG. This motivates us to compare Tobs with the mean value of rotational periods between R5100 and RSG. As shown in Fig. 2(g), Tobs is greater than Tmean, implying that Tobs is related to the region between RSG and 〈R〉 if the observed periodicity arises from an accretion disc surrounding a single black hole. Fig. 2(h) shows that Tobs is much shorter than the period of warped discs driven by the self-gravity torque, so that we can rule out this possibility for the periodicity.
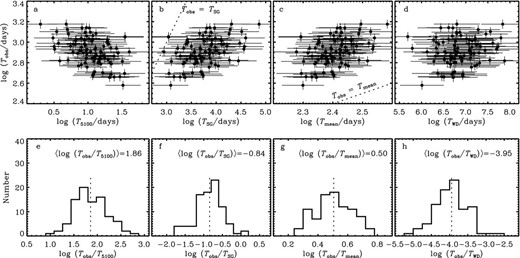
Comparison of observed periods in rest-frame versus the characteristic periods of accretion discs. Panels (a, b, c, d) are the Keplerian periods at the region for 5100 Å photons (T5100), the critical radius of self-gravity (TSG), averaged radius (Tmean) and the precessing period of warped discs (TWD) versus observed periods(Tobs), respectively. Their corresponding histograms are shown in panels (e, f, g, h). Vertical dash lines are the average levels.
In the next section, under the assumption that the observed periods are associated with SMBHB systems, we discuss several possible processes for the periodicity and calculate the BLR sizes and separations of these SMBHB systems.
SMBHB MODELS
Periodicity explanations
As pointed out by G15b, there exist several plausible processes responsible for the periodicity.
A processing jet. In the sample, by checking the radio band data from the catalogue of VLA-FIRST survey (Chang, Refregier & Helfand 2004), we found that only 13 candidates are radio-loud, indicating that the periodic variations in most candidates are not caused by a precessing jet.
Quasi-periodic oscillation. Abramowicz & Kluźniak (2001) suggested that high-frequency QPOs arise from some type of resonance mechanism. Zhou et al. (2010) showed that the observed time-scales (T) of high-frequency QPOs correlate with black hole mass following T = 6.22 M•/ (109 M⊙) d. For G15b sample, the typical value (T ∼ 6.22 d) is much shorter than observed period. On the other hand, as for low-frequency QPOs, Yan et al. (2013) showed that GRS 1915+105 has a mass of ∼12 M⊙ and exhibits QPO with 1 Hz. If we assume that the period T ∝ M•, the case of GRS 1915+105 would mean that the period if QPOs of G15b sample, spanning a mass range of 108−1010M⊙, lies in a range between ∼100 and 104 d (in observed-frame). This is generally comparable with the range of observed periods in G15b sample.
Periodic accretion. The orbital motion of binaries induces periodic modulation of mass accretion on to each black hole (Farris et al. 2014), which translates into periodic emissions of the accretion discs. The issue about this explanation is that the viscous time of an accretion disc, which reflects the time-scale of its response to a change in mass accretion rate, is generally much longer than the observed periods of the present sample.
Relativistic Doppler boosting. Recently, D'Orazio, Haiman & Schiminovich (2015) proposed an alternative explanation for the periodicity by relativistic Doppler boosting and applied it to the periodic light curve of PG 1302−102. In this model, a large inclination of the binary's orbit is generally required to account for the variation amplitude. This will raise a concern about the obscuration of the outer dusty torus if the dusty torus is coplanar with the binary's orbit.
Warped accretion disc. The accretion discs are warped due to tidal torques if their spin axis is misaligned with the orbital axis of the binaries. The warps precess along with the binary's orbital motion and eclipse some parts of the disc emissions, leading to periodic variations in the disc emissions.
In a nutshell, we can only generally exclude with certainty the possibility of the precessing jet model and high-frequency QPOs for the periodicity. For the other models, we need more observations, in particular spectroscopic data, to test them.
Separations and BLR sizes
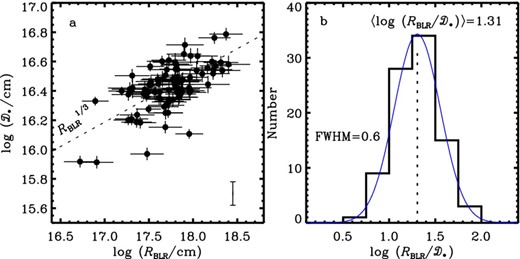
Comparison of SMBHB separations (|$\scr {D}_{\bullet }$|) with the sizes of broad-line regions (|$R_{\scriptscriptstyle {\rm BLR}}$|) in panels (a, b). In panel (a), dotted line is the expected relation. The bar plotted in the right lower corner represents the typical scatters of |$\scr {D}_{\bullet }$|. In panel (b), blue line is the Gaussian fit to the distribution.
CONCLUSIONS
We have tested the periodicity of long-term optical variations in a sample of AGNs from G15b. The partial correlation analysis shows that the observed periods of G15b sample are uncorrelated with the AGN 5100 Å luminosity, (total) black hole mass and accretion rates. By comparing the observed periods with the characteristic periods of accretion discs surrounding single black holes, we found that the periods generally lie within the Keplerian periods that correspond to the regions between the 5100 Å region and the self-gravity radius. We discussed several existing explanations for the periodicity in the context of SMBHB hypothesis and concluded that further observations (particularly long-term spectroscopic monitoring) are required to test if the periodicity originates from SMBHB systems (e.g. Li et al. 2016). Nevertheless, by assuming that observed periodicity is associated with SMBHB systems, we calculated the SMBHB's separations and found that they are smaller than the sizes of broad-line regions, implying that the binary BLRs have been merged.
We are grateful to the referee for constructive suggestions that significantly improved the manuscript. We thank the IHEP AGN members for useful discussions. This research is supported by NSFC-11173023, −11133006, −11233003, −11273007 and −11573026.
REFERENCES
SUPPORTING INFORMATION
Additional Supporting Information may be found in the online version of this article:
Table 1. The sample properties.
(http://www.mnrasl.oxfordjournals.org/lookup/suppl/doi:10.1093/mnrasl/slw062/-/DC1).
Please note: Oxford University Press is not responsible for the content or functionality of any supporting materials supplied by the authors. Any queries (other than missing material) should be directed to the corresponding author for the article.
