


ABSTRACT
We present rest-frame optical data of the |$z\sim 4$| submillimetre galaxy GN20 obtained with the JWST Near Infrared Spectrograph (NIRSpec) in integral field spectroscopy mode. The H|$\alpha$| emission is asymmetric and clumpy and extends over a projected distance of >15 kpc. To first order, the large-scale ionized gas kinematics are consistent with a turbulent (|$\sigma \sim 90$| km s|$^{-1}$|), rotating disc (|$v_{\rm rot}\sim 500$| km s|$^{-1}$|), congruent with previous studies of its molecular and ionized gas kinematics. However, we also find clear evidence for non-circular motions in the H|$\alpha$| kinematics. We discuss their possible connection with various scenarios, such as external perturbations, accretion, or radial flows. In the centre of GN20, we find broad-line emission (full width at half-maximum |$\sim 1000{-}2000$| km s|$^{-1}$|) in the H|$\alpha$| + [N ii] complex, suggestive of fast, active galactic nucleus-driven winds or, alternatively, of the broad-line region of an active black hole. Elevated values of [N ii] |$\lambda 6583$|/H|$\alpha \ \gt\ 0.4$| and of the Hα equivalent width EW(H|$\alpha)\ \gt\ 6$| Å throughout large parts of GN20 suggest that feedback from the active black hole is able to photoionize the interstellar medium. Our data corroborate that GN20 offers a unique opportunity to observe key processes in the evolution of the most massive present-day galaxies acting in concert, over 12 billion years ago.
1 INTRODUCTION
More than half of the total stellar mass in the present-day Universe is situated in early-type galaxies (ETGs; Fukugita, Hogan & Peebles 1998; Hogg et al. 2002; Bell et al. 2003; Renzini 2006). Understanding the formation of these giant systems is one of the key goals of galaxy evolution studies. With estimated ETG formation redshifts of |$z\ \gt\ 3$|, the discovery of bright submillimetre galaxies (SMGs; see review by Blain et al. 2002) at |$z\gtrsim 4$| quickly promoted them to candidate progenitors (e.g. Simpson et al. 2014). These galaxies rapidly assemble high stellar masses through intense star formation (SF; e.g. Hainline et al. 2009; Magnelli et al. 2013; Casey, Narayanan & Cooray 2014; Swinbank et al. 2014). Besides, some SMGs, including the galaxy studied in this work, are located within cosmic overdensities, hinting at future merger events which would help them to further increase their mass by |$z=0$| (e.g. Daddi et al. 2009; Walter et al. 2012; Casey et al. 2014; Oteo et al. 2018; Pavesi et al. 2018; Álvarez-Márquez et al. 2023; Arribas et al. 2024; Jones et al. 2024). Furthermore, at redshifts |$z\ \gt\ 3$|, the cores of proto-clusters, which are believed to reside at the nodes of the cosmic web, are expected to be subject to cold gas inflows (e.g. Overzier 2016), a process scarcely studied observationally.
After the identification of many |$z\ \gt\ 4$| SMGs in the past decades (e.g. Smail, Ivison & Blain 1997; Barger et al. 1998; Hughes et al. 1998; Blain et al. 2002; Chapman et al. 2003, 2005; Pope et al. 2005; Simpson et al. 2014; Hodge & da Cunha 2020), the advent of the JWST has enabled, for the first time, studies of their rest-frame optical emission-line properties. Within the Galaxy Assembly with NIRSpec Integral Field Spectroscopy (GA-NIFS) survey1 (PIs: Santiago Arribas and Roberto Maiolino), as part of the NIRSpec Instrument Science Team Guaranteed Time Observations, we have targeted several bright SMGs at |$z\ge 4$| with the integral field spectroscopy (IFS) mode (Böker et al. 2022; Jakobsen et al. 2022), three of which have already been discussed: ALESS073.1 at |$z=4.76$|, for which the NIRSpec-IFS data reveal a heavily dust-obscured active galactic nucleus (AGN; Parlanti et al. 2024); HLFS3 at |$z=6.3$|, which Jones et al. (2024) identify as a dense galaxy group in the process of merging; and the massive proto-cluster core SPT0311−58 at |$z=6.9$|, in which Arribas et al. (2024) find evidence for accretion from the cosmic web, inflows, and mergers. In this paper, we present high-resolution (|$R\sim 2700$|) NIRSpec-IFS data of the rest-frame optical line-emission in GN20, a large SMG at |$z\sim 4$|.
GN20 was detected by Pope et al. (2005) as a bright 850 |$\mu$|m source in the Great Observatories Origins Deep Survey Northern field (see also Iono et al. 2006; Pope et al. 2006). This dusty star-forming (SF) galaxy is located within a proto-cluster environment, and is detected in 1.4 GHz continuum, [C i] and in several CO transitions (1–0, 2–1, 4–3, 5–4, 6–5, 7–6) (Daddi et al. 2009; Carilli et al. 2010; Morrison et al. 2010; Hodge et al. 2013; Cortzen et al. 2020; see also Casey et al. 2009). It has a total infrared luminosity of |$\sim\!{2}{-}3\times 10^{13}~\mathrm{L}_\odot$|, a star-formation rate (SFR) of SFR|$_{\rm IR}\sim 1800{-}3000~\mathrm{M}_\odot$| yr|$^{-1}$|, a stellar mass of |$M_\star \sim 1.1{-}2.3\times 10^{11}~\mathrm{M}_\odot$|, and a molecular gas mass of |$M_{\rm mol}\sim 5{-}13\times 10^{10}~\mathrm{M}_\odot$| (Daddi et al. 2009; Carilli et al. 2010; Hodge et al. 2012; Tan et al. 2014). A regular velocity gradient spanning about 570 km s|$^{-1}$| is observed in CO(4–3), consistent with an exceptionally large |$r\sim 4$| kpc and massive rotating disc (Carilli et al. 2010). Hodge et al. (2012) find a clumpy, rotating disc in CO(2–1) with a maximum rotation velocity of |$v_{\rm rot,max}=575\pm 100$| km s|$^{-1}$|, with a velocity dispersion of |$\sigma =100\pm 30$| km s|$^{-1}$|. Dynamical mass estimates for GN20 are in the range of |$2{-}6\times 10^{11}~\mathrm{M}_\odot$| (Daddi et al. 2009; Carilli et al. 2010, 2011; Hodge et al. 2012). Intriguingly, rest-frame ultraviolet (UV) emission tracing young stars as observed with Hubble Space Telescope (HST)/WFC3 F105W imaging is visible only in an extended (|$\sim 9$| kpc) stripe to the north-west of the centroids of the CO and 880 |$\, \mu$|m emission, beyond the extent of the dust emission (Hodge et al. 2015).
Recently, Colina et al. (2023) studied the rest-frame 1.1 |$\, \mu$|m imaging of GN20 obtained with the MIRI instrument onboard JWST (see also Crespo Gómez et al. 2024). Their analysis reveals a two-component stellar structure composed of an unresolved nucleus offset by 1 kpc from the centre of an extended disc with |$R_{\rm e}=3.60$| kpc. They argue that the offset nucleus may be a result of tidal interactions with other proto-cluster members, or indicate a late-stage merger. Colina et al. (2023) find that the stellar nucleus coincides with the centre of far-infrared continuum emission tracing dust-obscured SF, while the extended stellar envelope overlaps with the cold molecular gas distribution. Analysing integral-field unit (IFU) observations taken with the medium-resolution spectrometer (MRS) of the Mid-Infrared Instrument (MIRI) on board JWST, Bik et al. (2024) find clumpy Pa|$\alpha$| emission out to a radius of 6 kpc.The kinematics of the Pa|$\alpha$| emission are consistent with a rotating disc, with a maximum rotation velocity of |$v_{\rm rot}=550\pm 40$| km s|$^{-1}$| and an upper limit on the flux-weighted velocity dispersion (|$\sigma _{\rm m}$|) of |$\sigma _{\rm m}=145\pm 53$| km s|$^{-1}$|. Comparing the unobscured SFR derived from the integrated Pa|$\alpha$| flux, SFR|$_{\rm Pa\alpha }=144\pm 9~\mathrm{M}_\odot$| yr|$^{-1}$|, with the infrared SFR i.e. SFR|$_{\rm IR}$| (Tan et al. 2014), Bik et al. (2024) infer a high average extinction of A|$_V=17.2\pm 0.4$| mag (see also Maseda et al. 2024). Crespo Gómez et al. (2024) infer a lower A|$_V\sim 1.5$| mag from spectral energy distribution fitting. They attribute this difference to the presence of either stellar populations older than 10 Myr, or of a buried AGN.
We describe the JWST/NIRSpec-IFS high-resolution observations of GN20 and our analysis methods in Sections 2 and 3. We present the complex H|$\alpha$| emission revealed by NIRSpec in Section 4. In Section 5, we discuss the H|$\alpha$| kinematics and evidence for non-circular motions based on both our data and dynamical modelling. In Section 6, we show evidence for the presence of an AGN in the centre of GN20. We summarize our findings in Section 7.
Throughout this work, we assume a flat Lambda cold dark matter cosmology with |$\Omega _{\rm m}=0.315$| and |$H_0=67.4$| km s|$^{-1}$| Mpc|$^{-1}$| (Planck Collaboration VI 2020). With this cosmology, |$1\ {\rm arcsec}$| corresponds to a transverse distance of 7.07 proper kpc at |$z=4.05$|.
2 NIRSPEC-IFU OBSERVATIONS AND DATA PROCESSING
GN20 was observed in NIRSpec-IFS mode as part of the GA-NIFS survey under programme 1264. The NIRSpec data were taken on 2023 February 10, with a medium cycling pattern of four dither positions and a total integration time of about 2 h with the high-resolution grating/filter pair G395H/F290LP, covering the wavelength range of |$2.87\!-\!5.14\ \mu$|m (spectral resolution |$R\sim 2000{-}3500$|; Jakobsen et al. 2022), and about 1 h with PRISM/CLEAR (|$\lambda =0.6\!-\!5.3\ \mu$|m, spectral resolution |$R\sim 30\!-\!300$|). Within the same programme, MIRI (Rieke et al. 2015; Wright et al. 2015) imaging and spectroscopy of GN20 was obtained. The MIRI imaging data were presented by Colina et al. (2023) and Crespo Gómez et al. (2024), and the MRS data were presented by Bik et al. (2024).
Raw data files were downloaded from the Barbara A. Mikulski Archive for Space Telescopes and subsequently processed with the JWST Science Calibration pipeline2 version 1.11.1 under the Calibration Reference Data System context jwst_1149.pmap. We made several modifications to the default reduction steps to increase data quality, which are described in detail by Perna et al. (2023) and which we briefly summarize here. Count-rate frames were corrected for |$1/f$| noise through a polynomial fit. During calibration in Stage 2, we removed regions affected by failed open MSA (micro-shutter assembly) shutters. We also removed regions with strong cosmic ray residuals in several exposures. Remaining outliers were flagged in individual exposures using an algorithm similar to lacosmic (van Dokkum 2001): We calculated the derivative of the count-rate maps along the dispersion direction, normalized it by the local flux (or by three times the rms noise, whichever was highest), and rejected the 95th percentile of the resulting distribution (see D’Eugenio et al. 2023 for details). The final cube was combined using the ‘drizzle’ method. The main analysis in this paper is based on the combined cube with a pixel scale of |$0.05\ {\rm arcsec}$|. We used spaxels away from the central source and free of emission features to perform a background subtraction.
In Fig. 1, we show a line map of the emission integrated in the range |$3.313\!-\!3.327\ \mu$|m, roughly encompassing the H|$\alpha$| and [N ii] |$\lambda 6583$| lines at |$z\sim 4.055$|. This will be further discussed in Section 4. In this paper, we focus on the analysis of the high-resolution data. However, to provide some context for our analysis, in Fig. 2 we use the prism observations to create a false-colour multiwavelength image of GN20, combining the H|$\alpha$| + [N ii] |$\lambda \lambda 6548,6583$| emission (green) with the emission at |$0.9\!-\!1.2\ \mu$|m (blue), roughly corresponding to the HST/WFC3 F105W filter tracing the emission of unobscured young stars, and the emission at |$5.0\!-\!5.3\ \mu$|m (red), covering the blue part of the MIRI/F560W filter and tracing stellar mass. The astrometry in Fig. 1 is derived by registering our observations to the F560W and F105W images, which are in turn registered to Gaia DR3 (Gaia Collaboration 2023). Based on the positional shifts derived from the MIRI and HST data, and the varying pixel sizes of the observations ranging from 0.05 to 0.1 |${\rm arcsec}$|, we estimate an uncertainty of about 0.1 |${\rm arcsec}$| on the astrometry.
![Line map of the emission integrated in the range of $3.313\!-\!3.327\ \mu$m, roughly encompassing the H$\alpha$ + [N ii] $\lambda$6583 lines at $z\sim 4.055$. GN20 is visible as the extended central source with a complex and clumpy morphology. We indicate two clumps to the north-west and extended emission in the south-east with dashed outlines (see main text for details). We detect a second galaxy to the north-west of GN20, which we call GN20b, at a projected separation of about 12 kpc and a velocity difference of about +750 km s$^{-1}$, respectively, a redshift of $z=4.06\,532$. The white circle indicates the approximate PSF full width at half-maximum (FWHM; ⊘$=0.12\ {\rm arcsec}$).](https://oup.silverchair-cdn.com/oup/backfile/Content_public/Journal/mnras/533/4/10.1093_mnras_stae1993/2/m_stae1993fig1.jpeg?Expires=1749145574&Signature=DOc4yCalZcWe0m5yjdX5vR1Qd4zDt1pAIZDgqa317J1g2g1mJpUbF5MztghS83DgDbEXy-C33IA7RhFU96Rg5wfnhhE6-IBMoZ0XiX5QW4e-T7hCVmVACu5~lAFGakkGoeZ04S32TRSKaFsasODX9F2zyBHv3zQmpCqk5z57VPBN52sNjT3840SkHENWxIgxRyG9dxJXZRz7I~UawHoaa5G2xEkzHPM52vTJkip~uNvjjsnNfhp0NfAuyBsVkfonMqF4NsiIHjyq7Nirc5EYg4n~Az-6Pddn~JwhkyIFyqLseIziJhO7QVoIEySUNd57c1RsLSEEtDSn3hbjf~jVpQ__&Key-Pair-Id=APKAIE5G5CRDK6RD3PGA)
Line map of the emission integrated in the range of |$3.313\!-\!3.327\ \mu$|m, roughly encompassing the H|$\alpha$| + [N ii] |$\lambda$|6583 lines at |$z\sim 4.055$|. GN20 is visible as the extended central source with a complex and clumpy morphology. We indicate two clumps to the north-west and extended emission in the south-east with dashed outlines (see main text for details). We detect a second galaxy to the north-west of GN20, which we call GN20b, at a projected separation of about 12 kpc and a velocity difference of about +750 km s|$^{-1}$|, respectively, a redshift of |$z=4.06\,532$|. The white circle indicates the approximate PSF full width at half-maximum (FWHM; ⊘|$=0.12\ {\rm arcsec}$|).
![Comparison of rest-frame optical, UV, and near-infrared emission in GN20, obtained through collapsing the NIRSpec prism cube in three different wavelength regions (not PSF-matched). The H$\alpha$ + [N ii] emission is shown in green, blue colours trace emission at $0.9\!-\!1.2\ \mu$m (rest-frame $0.18\!-\!0.24\ \mu$m; roughly corresponding to the HST/WFC3 F105W filter), and red colours show emission at $5.0\!-\!5.3\ \mu$m (rest-frame $0.99\!-\!1.05\ \mu$m; covering the blue part of the MIRI/F560W filter). The nuclear H$\alpha$ + [N ii] emission overlaps with the nucleus detected by MIRI (Colina et al. 2023; Crespo Gómez et al. 2024), while the diffuse rest-frame near-infrared emission extends until the outer H$\alpha$ + [N ii] loop. We note that the Pa$\alpha$ emission detected by MIRI has a similar extent (Bik et al. 2024). The rest-frame UV emission overlaps with the western region detected in H$\alpha$ + [N ii], including the location of the north-western clumps.](https://oup.silverchair-cdn.com/oup/backfile/Content_public/Journal/mnras/533/4/10.1093_mnras_stae1993/2/m_stae1993fig2.jpeg?Expires=1749145574&Signature=e~Qvrk-otd-4LUeVuPu30BnLBNXvIQpoRhkpc-oIJ4G7a08BENAcTMa-S6aAAAqdxpuJpIluxdnsNPHQ5X61F4ymexSnnTXg34sVay14EcNSPV5X2GQejZxSsY5cBZrp-xdeRiZdtR37K~ZMBL3ELRbidUnp27lDK7ClEsEHQqE2tAkgOy6G4v7JYhZDe2-nU7rcdRf0x7dI-vzBXkReoguM0sTIPcnk4IfjwLmPUyBr95GSOnUu~UVpg3UnKMQHdvjg2f5xQYO9hkZcEgvxMhho80LZyLlD46tIbwduWasaDUb-trpNlyOzuLFigeF-htZ27wCl3VdZ7Pm1j2HiCQ__&Key-Pair-Id=APKAIE5G5CRDK6RD3PGA)
Comparison of rest-frame optical, UV, and near-infrared emission in GN20, obtained through collapsing the NIRSpec prism cube in three different wavelength regions (not PSF-matched). The H|$\alpha$| + [N ii] emission is shown in green, blue colours trace emission at |$0.9\!-\!1.2\ \mu$|m (rest-frame |$0.18\!-\!0.24\ \mu$|m; roughly corresponding to the HST/WFC3 F105W filter), and red colours show emission at |$5.0\!-\!5.3\ \mu$|m (rest-frame |$0.99\!-\!1.05\ \mu$|m; covering the blue part of the MIRI/F560W filter). The nuclear H|$\alpha$| + [N ii] emission overlaps with the nucleus detected by MIRI (Colina et al. 2023; Crespo Gómez et al. 2024), while the diffuse rest-frame near-infrared emission extends until the outer H|$\alpha$| + [N ii] loop. We note that the Pa|$\alpha$| emission detected by MIRI has a similar extent (Bik et al. 2024). The rest-frame UV emission overlaps with the western region detected in H|$\alpha$| + [N ii], including the location of the north-western clumps.
3 FITTING AND DYNAMICAL MODELLING
3.1 Emission line fitting and H|$\alpha$| redshift
To analyse the emission-line properties and kinematics of GN20, we first fit a one-component Gaussian model to the H|$\alpha$| and [N ii] |$\lambda \lambda 6548,6583$| emission lines in the grating data, including a constant continuum. Because the signal-to-noise ratio (|${\rm {S/N}}$|) varies substantially throughout GN20 due to non-uniform dust obscuration that is particularly high in the central region (Hodge et al. 2015; Colina et al. 2023; Bik et al. 2024), we derive a Voronoi-binned map, using the algorithm vorbin (Cappellari & Copin 2003), as implemented in QFitsView. We first define a mask based on visual inspection of the line emission in the cube, and then require |${\rm {S/N}}\ge 15$| in the previously fitted H|$\alpha$| flux map to derive the Voronoi map. We derive H|$\alpha$| velocity and velocity dispersion maps by repeating our one-component Gaussian model fitting on the binned data. The resulting maps are shown in the top row of Fig. 3.
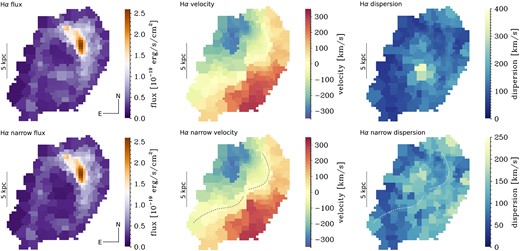
Top panel: Voronoi-binned maps (target |${\rm {S/N}}\ge 15$|) of the observed H|$\alpha$| flux (left panel), velocity (middle panel), and velocity dispersion (right panel) from a one-component fit. In the bottom row, we show corresponding maps where we have stitched the central region including only the narrow component of a two-component Gaussian fit (see Section 3). The large-scale kinematics are consistent with a rotating disc. The high dispersion values in the central region in the top-right panel trace a nuclear broad flux component. Removing this component, we find high average values of |$\sigma _{\rm obs}\sim 50{-}150$| km s|$^{-1}$| throughout GN20 (bottom-right panel). We also find evidence for non-circular motions in the velocity field through patterns that deviate from the classical spider diagram expected for rotating discs: To guide the eye, we mark |$v_{\rm obs}\sim 0$| km s|$^{-1}$| as a dashed line in the bottom-middle panel (repeated in the bottom-right panel for reference).
While the line emission is relatively narrow in the outer regions of GN20 (|$\sigma _{\rm obs}\sim 50{-}100$| km s|$^{-1}$|), the H|$\alpha$| + [N ii] emission in the centre is broad. We identify the central regions with broad emission through visual inspection (see aperture indicated in the bottom panels of Fig. 5, diameter of |$\sim\!{4}$| kpc). We fit the spectra extracted from the central regions based on the Voronoi tessellation with a set of narrow components plus a set of broad components for H|$\alpha$| and [N ii] |$\lambda \lambda 6548,6583$|. Here, we require FWHM|$_{\rm broad}\ \gt\ 400~{\rm km\, s}^{-1}\ \gt\ $|FWHM|$_{\rm narrow}$|. We stitch the narrow component results to our initial one-component maps. As can be seen from the example spectra in Fig. 5, the narrow components in the central region are distinct from the underlying broad emission. It is therefore unlikely that we oversubtract emission associated with the narrow component through this procedure. The resulting maps are shown in the bottom row of Fig. 3. In Section 6, we discuss alternative approaches to model the broad nuclear emission.
To measure a redshift for GN20 from the H|$\alpha$| data, we rely on the kinematics, since the one-dimensional (1D), integrated emission line profile is skewed by the bright, off-centre region in the north-west. After initially deriving the H|$\alpha$| kinematics as described earlier assuming |$z=4.055$| (Daddi et al. 2009), we shift the systemic velocity such that we find comparable absolute maximum and minimum velocities, and the (one-component) dispersion peak coincides with |$v_{\rm obs}\sim 0$| km s|$^{-1}$| along the kinematic major axis. We adopt a velocity shift of +75 km s|$^{-1}$|. Given the median uncertainties on the fitted velocities of 11 km s|$^{-1}$| (including in the regions of minimum and maximum velocities), this corresponds to a redshift of |$z_{\rm H\alpha }=4.05\,374\pm 0.00\,075$|.3
3.2 Dynamical modelling
To construct dynamical models, we use DysmalPy (Davies, Tacconi & Genzel 2004a, b; Cresci et al. 2009; Davies et al. 2011; Wuyts et al. 2016; Genzel et al. 2017, 2023; Lang et al. 2017; Übler et al. 2018; Price et al. 2021; Lee et al., submitted), a 3D forward-modelling code that takes into account the instrumental effects of beam-smearing, line broadening, and finite spatial resolution. We build a mass model for GN20 informed through existing multiwavelength constraints, in particular the recent MIRI observations at mid-infrared wavelengths that trace the stellar light distribution (Colina et al. 2023). The model includes a baryonic disc and bulge component together with a spherical dark matter halo. For the baryonic mass distribution, we account for a finite flattening following Noordermeer (2008).
We fix the following structural parameters to the best-fitting values derived by Colina et al. (2023): the disc effective radius |$R_{{\rm e},\rm disc}=3.6$| kpc, the disc Sérsic index |$n_{\rm S,disc}=0.42$|, and the minor-to-major axis ratio |$b/a=0.80$|. We adopt the convention that in the face-on case, the galaxy rotates in counter-clockwise direction for |$i=0^\circ$|, and in clockwise direction for |$i=180^\circ$|. Assuming a thick disc with ratio of scale height to scale length of |$q_0=0.2$| (e.g. Wuyts et al. 2016; Genzel et al. 2017), |$b/a=0.80$| corresponds to an inclination of either |$38^\circ$| (projected counter-clockwise rotation; see also Crespo Gómez et al. 2024) or |$142^\circ$| (projected clockwise rotation). Assuming that the regions in the north-west which are brightest in H|$\alpha$| and UV emission are closer to us (the ‘near side’), this would suggest that GN20 rotates in a clockwise direction (see also stellar light distribution; Colina et al. 2023). We therefore fix |$i=142^\circ$|. We include a Gaussian prior on the total baryonic mass centred on |$\log (M_{\rm bar, tot}/\mathrm{M}_\odot)=11.4$|, with a standard deviation of 0.3 and bounds of [10.4; 12.4]. This is motivated by estimates of the stellar mass (|$M_\star =1.1\times 10^{11}\ \mathrm{M}_\odot$|; Tan et al. 2014) and of the molecular gas mass (|$M_{\rm H2}=1.3\times 10^{11}\ \mathrm{M}_\odot$|; Hodge et al. 2012, here assuming |$\alpha _{\rm CO}=0.8$|). Colina et al. (2023) identify an unresolved nuclear component (upper size limit 0.8 kpc). The authors conclude that this component corresponds to an obscured nuclear starburst, but they also discuss the alternative options of a massive stellar bulge or an AGN. To account in our model for this central mass component, we use their stellar mass estimate derived under the hypothesis of a bulge, |$2.5\times 10^{10}\ \mathrm{M}_\odot$|. This is about 10 per cent of our total baryonic mass estimate. We measure the effective radius of the nuclear component through a 2D Gaussian fit to the H|$\alpha$| + [N ii] line map, and find 0.76–0.80 kpc, consistent with the upper limit derived by Colina et al. (2023) from the MIRI F560W imaging. We model a round bulge with |$R_{{\rm e},\rm bulge}=0.8$| kpc, |$n_{\rm S,bulge}=4$|, and a bulge-to-total baryonic mass ratio of |$B/T=0.1$|. We include a Navarro, Frenk & White (1996) dark matter halo with a concentration parameter of |$c=3.1$| (the expected value for a halo of |$\log (M_{\rm halo}/\mathrm{M}_\odot)=13$| at this redshift, following Dutton & Macciò 2014). We fit for the dark matter fraction within the effective radius, |$f_{\rm DM}(r\ \lt\ R_{\rm e})$|, from which the total halo mass is inferred (see Price et al. 2021). We use a flat prior |$f_{\rm DM}(\lt R_{\rm e})=[0; 1]$|. Further to the aforementioned priors, we include a flat prior on the intrinsic velocity dispersion, |$\sigma _0=[30; 150]$| km s|$^{-1}$|, which is assumed to be constant and isotropic throughout the disc. In addition to the total baryonic mass |$M_{\rm bar}$|, the dark matter fraction at the effective radius |$f_{\rm DM}(\lt R_{\rm e})$|, and the intrinsic velocity dispersion |$\sigma _0$|, we allow the position angle (PA) to vary in the range PA = [|$0^\circ$|; |$50^\circ$|], and we allow the model to adjust the systemic velocity by |$\pm 100$| km s|$^{-1}$|.
We model the point-spread function (PSF) as a Gaussian with FWHM|$=0.12\ {\rm arcsec}$|, corresponding to the approximate PSF (along slicers) at the wavelength of H|$\alpha$| (see D’Eugenio et al. 2023). For the instrumental dispersion, we adopt |$\sigma _{\rm inst}=57$| km s|$^{-1}$|, which corresponds to the nominal spectral resolution at the wavelength of H|$\alpha$| (Jakobsen et al. 2022).
As input for our fiducial DysmalPy runs, we use the Voronoi maps of the narrow H|$\alpha$| velocity and velocity dispersion. We fix the centre of the model such that it falls on to the Voronoi bin with |$v_{\rm obs}\sim 0$| km s|$^{-1}$| along the axis connecting the observed velocity minimum and maximum. This coincides roughly with the centre of the disc component identified by Colina et al. (2023). To account for the Voronoi binning during the minimization, we scale the uncertainties by a factor equal to the square root of the number of spaxels per bin. We find the best fit through Markov chain Monte Carlo (MCMC) sampling, using 200 walkers and 500 steps after a burn-in of 200 steps (Foreman-Mackey et al. 2013; emcee). Our final chains are longer than 10 times the autocorrelation time for the individual fit parameters. For visual comparison of the best-fitting model to our data in the figures below, we show the median values of the model per Voronoi bin.
As motivated in Section 6, we further construct a model with the same parameters as described earlier, but which additionally includes a uniform planar, radial inflow. The inflow velocity is not fitted for, but added as a fixed parameter (see Price et al. 2021). The preferred inflow velocity is initially identified through a grid search by injecting different values of |$v_{\rm r}$| in steps of 10 km s|$^{-1}$| from 0 to 200 km s|$^{-1}$|, using least-squares minimization (Markwardt 2009). We repeat the fit with the so identified preferred inflow velocity (|$v_{\rm r}=130$| km s|$^{-1}$|) using MCMC. The results of this model are presented in Appendix A.
4 COMPLEX H|$\alpha$| EMISSION
In Fig. 1, we show a line map of the emission integrated in the range of |$3.313\!-\!3.327\ \mu$|m in our NIRSpec observations. This range covers the H|$\alpha$| + [N ii] |$\lambda 6584$| flux in GN20 (extended central object). Within the IFS field of view, we detect another galaxy north-west of GN20, which we call GN20b. It is at a projected separation of about 12 kpc from the centre of GN20 (also seen in the HST data; see Fig. 2) and a velocity difference of about +750 km s|$^{-1}$|, respectively, a redshift of |$z_{\rm H\alpha ,GN20b}=4.06\,532\pm 0.00\,003$|. GN20b is also detected in continuum in the prism observations.
The map for GN20 reveals a complex, clumpy, loop-like structure. The emission is brightest in the north-western region, close to the location of the rest-frame UV emission tracing young stars, previously detected with HST (see Fig. 2). Further to the north-west of this region, we detect two fainter clumps (dashed circles in Fig. 1). In the remaining regions of GN20, the H|$\alpha$| emission is much fainter. A central flux concentration largely overlaps with the nuclear component identified in the MIRI imaging (Colina et al. 2023, the black-edged white circle in their fig. 2), which is also prominent in the NIRSpec data above |$\sim\!{5}\ \mu$|m (see Fig. 2). Immediately north of this region, H|$\alpha$| is barely detected. In the south-east, we detect clumpy H|$\alpha$| emission extending to the south (dashed ellipse in Fig. 1).
The peculiar surface brightness distribution of the H|$\alpha$| emission in GN20 could spark doubts regarding its disc-like nature. However, we know from previous observations in the rest-frame far-infrared continuum that the central regions of GN20 are very dusty (Hodge et al. 2015). This has also been shown through the recent analyses by Bik et al. (2024) and Crespo Gómez et al. (2024), finding high attenuation in the central parts of the galaxy. In addition, the analysis of the stellar light distribution from MIRI imaging is consistent with a fairly smooth stellar disc plus a compact nuclear component (Colina et al. 2023; Crespo Gómez et al. 2024). Clumpy H|$\alpha$| emission originating from smooth, disc-like mass distributions has also been observed at lower redshift (Wuyts et al. 2012). Notably, most of these galaxies show smooth H|$\alpha$| velocity fields consistent with disc rotation. Indeed, this appears to be case as well for GN20: The H|$\alpha$| kinematics, much like previous studies of GN20 utilizing CO and Pa|$\alpha$| as kinematic tracers, support the interpretation of a large rotating disc. We discuss the large-scale rotation and deviations from circular motions in Section 5.
The two H|$\alpha$| clumps in the north-west appear also visible in CO(2–1) and in the UV (Hodge et al. 2015), and there is also faint emission seen in the MIRI F560W image, on the level of a few per cent of the peak flux (see Colina et al. 2023, and Fig. 2). Some F560W flux extends from the main disc along the same direction of the south-east extension (see Colina et al. 2023). Clumpy UV emission is also seen here; however, this likely stems from a |$z\sim 1.74$| galaxy identified through rest-frame optical line emission in our prism data. The H|$\alpha$| clumps and extension could resemble real substructure embedded within GN20, e.g. young SF regions in the outer disc or a protruding spiral arm. Alternatively, they could correspond to fresh material in the process of accretion on to GN20. We note faint H|$\alpha$| flux between GN20 and GN20b, which could further indicate a past or ongoing interaction.
5 LARGE-SCALE ROTATION AND NON-CIRCULAR MOTIONS
In the middle and right panels of Fig. 3, we show H|$\alpha$| velocity and velocity dispersion maps based on our fits to the Voronoi-binned cube (top panel: one component; bottom panel: stitched narrow component, see Section 3 for details). We find a large velocity gradient across GN20 of about |$\Delta v_{\rm obs}\sim 610$| km s|$^{-1}$|, and observed velocity dispersion values of |$\sigma _{\rm obs}\sim 50{-}150$| km s|$^{-1}$| in the Voronoi bins in the outer disc. The large-scale H|$\alpha$| velocity field is consistent with disc rotation, and the kinematic major axis, observed velocities, and velocity dispersions are in general agreement with earlier results based on molecular gas kinematics (Carilli et al. 2010; Hodge et al. 2012). However, the data reveal clear deviations from circular motions in the velocity field. In the bottom-middle panel of Fig. 3, we indicate |$v_{\rm obs}\sim 0$| km s|$^{-1}$| by dashed lines, illustrating a twist of the apparent kinematic minor axis. Along the north-western |$v_{\rm obs}\sim 0$| km s|$^{-1}$| twist, we observe slightly elevated velocity dispersions, as evident from the bottom-right panel of Fig. 3.
In the following, we further investigate the deviations from circular motions through residual analysis of a pure circular motion dynamical model. We also compare our modelling results to previous studies of the kinematics in GN20 based on other kinematic tracers.
5.1 Dynamical modelling results and comparison to other kinematic tracers
We fit a dynamical model including a rotating disc, bulge, and dark matter halo, as described in Section 3, to our data. The best-fitting model and residuals are shown in Fig. 4. The model provides a reasonable fit to the data, with median offsets in velocity and velocity dispersion of |$\Delta v_{\rm med}=5.5$| km s|$^{-1}$| and |$\Delta \sigma _{\rm med}=14.9$| km s|$^{-1}$|. From this model, we measure a rotation velocity |$v_{\rm rot}(R_{\rm e}=3.6\ {\rm kpc})=469$| km s|$^{-1}$| (circular velocity |$v_{\rm c}(R_{\rm e})=496$| km s|$^{-1}$|), reaching a maximum value of |$v_{\rm max}=531$| km s|$^{-1}$| (|$v_{{\rm c},\rm max}=574$| km s|$^{-1}$|) at |$r=6.2$| kpc (|$r=6.8$| kpc). The circular velocity accounts for the effects of pressure support from turbulent motions, and is defined as |$v_\mathrm{ c}^2(r)=v_{\rm rot}^2(r)+2\sigma _0^2 r/R_\mathrm{ d}$|, with |$R_{\rm d}$| being the disc scale length (see Burkert et al. 2010, 2016). We constrain an intrinsic velocity dispersion of |$\sigma _0=89$| km s|$^{-1}$|. For a galaxy at |$z\sim 4.055$|, from the relation by Übler et al. (2019), calibrated based on ground-based observations up to |$z\sim 3.5$|, we would expect an intrinsic ionized gas velocity dispersion of |$\sigma _0\sim 63\pm 19$| km s|$^{-1}$|, somewhat lower than our best-fitting result. However, we note that some regions in the outer disc of GN20 show comparable dispersion values in |$\sigma _{\rm obs}$|. Evaluating the ratio of maximum rotation velocity to intrinsic velocity dispersion, we find |$v_{\rm rot}(R_{\rm e})/\sigma _0=5.3$| (|$v_{\rm rot,max}/\sigma _0=6.0$|). The dynamical mass enclosed within one |$R_{\rm e}$| is |$\log (M_{\rm dyn}(\lt R_{\rm e})/\mathrm{M}_\odot)=11.3$|, and within two |$R_{\rm e}$| is |$\log (M_{\rm dyn}(\lt 2R_{\rm e})/\mathrm{M}_\odot)=11.7$|. The inferred values from our best-fitting model are reported in Table 1.
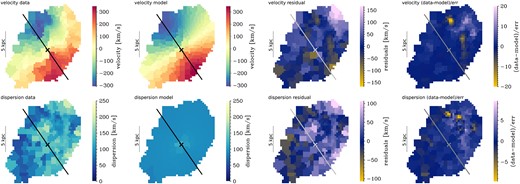
Our best-fitting dynamical model including a disc, bulge, and halo. Top (bottom) panels show the observed velocity (velocity dispersion) field (left panel), the best-fitting model (middle-left panel), residuals (data-model; middle-right panel), and goodness-of-fit (data-model)/uncertainties (right panel). The cross and line indicate the centre and best-fitting PA. For comparison, the dotted grey line in the top-left panel indicates the axis connecting the observed velocity minimum and maximum. The model provides a reasonable fit to the data, with a median velocity offset of |$\Delta v_{\rm med}=5.5$| km s|$^{-1}$| and an rms velocity difference of |$\Delta v_{\rm rms}=49.3$| km s|$^{-1}$|. Corresponding values for the velocity dispersion are |$\Delta \sigma _{\rm med}=14.9$| km s|$^{-1}$| and |$\Delta \sigma _{\rm rms}=34.7$| km s|$^{-1}$|. Yet, we observe strong residuals particularly in the north-western region, indicating a disturbance of the kinematics for instance through accretion or external perturbations.
Results from our best-fitting dynamical model including a thick disc, bulge, and dark matter halo. For |$\sigma _0$|, we adopt minimum uncertainties of 10 km s|$^{-1}$|. The effective radius is fixed to |$R_{\rm e}=3.6$| kpc.
| Fitted parameters | |
| |$\log (M_{\rm bar}/\mathrm{M}_\odot)$| | |$11.42^{+0.05}_{-0.06}$| |
| |$\sigma _0$| (km s|$^{-1}$|) | |$89\pm 10$| |
| |$f_{\rm DM}(\lt R_{\rm e})$| | |$0.30\pm 0.07$| |
| PA|$_{\rm kin}$| | |$34.7^{+0.6}_{-0.3}$| |
| Velocity shift (km s|$^{-1}$|) | |$29\pm 2$| |
| |$\chi ^2_{\rm red}$| | 4.9728 |
| Derived values | |
| |$v_{\rm rot}(R_{\rm e})$| (km s|$^{-1}$|) | 469 |
| |$v_{\rm circ}(R_{\rm e})$| (km s|$^{-1}$|) | 496 |
| |$v_{\rm rot,max}$| (km s|$^{-1}$|) | 531 |
| |$v_{\rm rot}(R_{\rm e})/\sigma _0$| | 5.3 |
| |$\log (M_{\rm dyn}(\lt 2R_{\rm e})/\mathrm{M}_\odot)$| | 11.68 |
To compare our modelling results with previous results on the kinematics of GN20 obtained in the literature, we repeat our dynamical modelling with the inclination fixed to the values adopted in the literature studies. Assuming |$i=45^\circ$|, Carilli et al. (2010) find a rotation velocity of |$v_{\rm rot}(r\sim 4\ {\rm kpc})=570$| km s|$^{-1}$| based on CO(6–5) molecular gas kinematics, with an enclosed dynamical mass of |$M_{\rm dyn}(r\ \lt\ 4\ {\rm kpc})=3\times 10^{11}\ \mathrm{M}_\odot$|. Repeating our modelling with the inclination fixed to |$i=135^\circ$| (i.e. corresponding to their |$i=45^\circ$|), we find a lower value of |$v_{\rm rot}(r\sim 4\ {\rm kpc})=442$| km s|$^{-1}$|, but a comparable enclosed total mass of |$M_{\rm dyn}(r\ \lt\ 4\ {\rm kpc})=2\times 10^{11}\ \mathrm{M}_\odot$|.
Hodge et al. (2012) and Bik et al. (2024) adopt an inclination of |$i=30^\circ$|. From the CO(2–1) kinematics, Hodge et al. (2012) inferred |$v_{\rm max}=575\pm 100$| km s|$^{-1}$| and |$\sigma _0=100\pm 30$| km s|$^{-1}$|. Bik et al. (2024) found |$v_{\rm max}(r\ \lt\ 4~{\rm kpc})=550\pm 40$| km s|$^{-1}$| and |$\sigma _{\rm m}=145\pm 53$| km s|$^{-1}$| from Pa|$\alpha$| kinematics, where |$\sigma _{\rm m}$| represents an upper limit on the intrinsic flux-weighted velocity dispersion. Repeating our modelling with the inclination fixed to |$i=150^\circ$| (i.e. corresponding to their |$i=30^\circ$|), we find a rotation velocity of |$v_{\rm rot}(R_{\rm e}=3.6\ {\rm kpc})=551$| km s|$^{-1}$| (|$v_{\rm max}=646$| km s|$^{-1}$|), and |$\sigma _0=89$| km s|$^{-1}$|. Our modelling results obtained by fixing |$i=150^\circ$| are in good agreement with what has been inferred from these studies analysing molecular gas kinematics and Pa|$\alpha$| kinematics on similar radial scales. Comparing the amount of rotational support, Hodge et al. (2012) find |$v_{\rm max}/\sigma _0\mid _{\rm CO(2-1)}=5.8$|, and Bik et al. (2024) find a somewhat lower value of |$v_{\rm max}/\sigma _{\rm m}\mid _{\rm Pa\alpha }=3.8\pm 1.4$|, however based on the upper limit on the flux-weighted velocity dispersion. Using |$i=150^\circ$|, we find even higher values of |$v_{\rm max}/\sigma _0=7.3$|, yet at the effective radius (fixed to |$R_{\rm e}=3.6$| kpc), we find |$v_{\rm rot}(R_{\rm e})/\sigma _0=6.2$|. This is in general agreement with the literature results. Hodge et al. (2012) infer a dynamical mass of |$M_{\rm dyn}=5.4\pm 2.4\times 10^{11}\ \mathrm{M}_\odot$|. Fixing |$i=150^\circ$|, we find |$M_{\rm dyn}(r\ \lt\ R_{\rm e})=2.6\times 10^{11}\ \mathrm{M}_\odot$| and |$M_{\rm dyn}(r\ \lt\ 2R_{\rm e})=7.0\times 10^{11}\ \mathrm{M}_\odot$|, in broad agreement with the results by Hodge et al. (2012).
Multiphase gas kinematic measurements at high redshift are still rare. Recently, Parlanti et al. (2024) measured |$v_{\rm rot}(R_{\rm e}=3\ {\rm kpc})/\sigma _0\mid _{\rm H\alpha }\ \sim 9.2$| in an obscured AGN at |$z=4.76$|, with a higher value of |$v_{\rm rot}(R_{\rm e})/\sigma _0\mid _{\rm [CII]]}\ \sim 15.8$| measured from the [C ii] line (Lelli et al. 2021). In this case, the authors speculate that the AGN might have deposited energy in the ionized gas phase, leading to higher dispersion values and therefore lower rotational support. In SPT0311−58, which is at the core of a massive proto-cluster, Arribas et al. (2024) find |$v_{\rm rot,max}/\sigma _0\mid _{\rm [O\,{\small III}]}\ \sim 1$| based on [O iii] |$\lambda 5007$|kinematics. Their median intrinsic velocity dispersion is |$\sigma _0=113\pm 19$| km s|$^{-1}$|, and in some regions 2–3 times higher than the velocity dispersion measured in [C ii]. This likely indicates that SPT0311−58 at |$z=6.9$| is in an earlier phase of disc formation compared with GN20.
5.2 Deviations from circular motions
Despite the relatively good fit of our circular motion model to the H|$\alpha$| kinematics of GN20, and the agreement with literature results, we find strong residuals in particular in the north-western region of the galaxy. This can be seen from the middle-right and right panels in Fig. 4. These residuals are close to the H|$\alpha$| clumps identified in Fig. 1. Furthermore, the best-fitting kinematic major axis appears tilted with respect to the velocity minimum and maximum in the data (see top-left panel in Fig. 4). Deviations from circular motions in disc galaxies can be associated with a variety of phenomena: perturbations through past or ongoing interaction with neighbours, smooth accretion, streaming motions due to non-axisymmetric substructure like a bar or spiral arms, or outflows (e.g. van der Kruit & Allen 1978; Roberts, Huntley & van Albada 1979; van Albada & Roberts 1981; Shlosman, Frank & Begelman 1989; Athanassoula 1992; Wada & Habe 1992; Bournaud & Combes 2002; Binney & Tremaine 2008; Tsukui et al. 2024).
GN20 is known to be located within a proto-cluster environment together with the AGN GN20.2a and GN20.2b, located at projected distances of about |$\sim\!{150}$| and |$\sim\!{200}$| kpc (Daddi et al. 2009). Based on the projected separations and stellar masses of GN20.2a and GN20.2b, we do not expect a significant effect on the kinematics of GN20: We find a tidal strength parameter (Dahari 1984; Verley et al. 2007) of |$Q=-3.9$|, while sizeable effects are generally expected for |$Q\ge -2$|. However, as mentioned in Section 4, we detect another galaxy (GN20b) to the north-west of GN20 which could be involved in an ongoing or past interaction. It is therefore possible that deviations from circular motions in GN20 are triggered by past or ongoing interactions with neighbours. This could also potentially explain the fairly large velocity dispersions found in some regions in GN20. We note that offset nuclear emission detected in the MIRI imaging by Colina et al. (2023) and Crespo Gómez et al. (2024) may also suggest a past gravitational interaction.
As mentioned in Section 3 and further discussed in Section 6, we detect broad emission in the central region of GN20 which may be associated with high-velocity outflows. However, the impact of these non-circular motions is already removed in the kinematic maps used for the dynamical modelling (see Fig. 3). Still, it is possible that past feedback activity in the centre of GN20, either by an AGN or an intense starburst, could have deposited energy in the interstellar medium, thus increasing the intrinsic velocity dispersion in the central parts of the galaxy (see e.g. Harrison et al. 2016; Übler et al. 2019; Marasco et al. 2023; Parlanti et al. 2024). We do not expect any further impact on the narrow-component kinematics from outflows.
Finally, we consider non-circular motions in the form of radial flows. Those could be triggered through smooth accretion from the circumgalactic medium or internal streaming motions caused by disc instabilities or substructures such as spiral arms or a bar. The stellar light distribution derived through the MIRI F560W data by Colina et al. (2023) does not provide evidence for a bar, though some substructure is revealed through their residual analysis which may indicate spiral-arm or ring-like features in the outer parts of the galaxy. Based on our assumption of clockwise rotation (i.e. the bright NW side being the ‘near side’, and the fainter SE side being the ‘far side’), the signature of an axisymmetric, planar radial inflow would be a mirrored S-shaped twist in the iso-velocity contours (see van der Kruit & Allen 1978, and the recent examples at |$z\sim 2$| by Genzel et al. 2023 and Price et al. 2021). We observe a similar effect in the velocity field of GN20 (see bottom-middle panel of Fig. 3). This motivates us to explore a second dynamical model including a uniform, planar radial inflow. This is clearly a simplified assumption for GN20, but it may still provide us with informative clues about the nature of the observed deviations from circular motions. We show the results from this second model in Fig. A1. This model, which includes an inflow with |$v_{\rm r}=130$| km s|$^{-1}$|, indeed provides a somewhat better fit to the observed kinematics (|$\Delta \chi ^2_{\rm red}=0.33$|), suggesting that gas may be flowing from the outskirts to the centre of GN20. However, the strong residuals in the NW largely remain, indicating that additional processes for instance recent or ongoing interaction disturb the kinematics in GN20.
6 BROAD NUCLEAR EMISSION AND AGN SIGNATURES
As discussed in Sections 3, we find broad emission in the H|$\alpha$| + [N ii] complex in the central region of GN20. To derive the narrow emission line maps we have used for the dynamical modelling, we have fitted this broad emission as a set of broad Gaussians for H|$\alpha$| and [N ii] |$\lambda \lambda 6548,6583$| in addition to a set of narrow components, i.e. interpreting this broad emission as an outflow component. However, the data are very noisy due to the high obscuration in the centre. In fact, if we alternatively fit the central regions with only one broad component for H|$\alpha$| in addition to the narrow line components for H|$\alpha$| + [N ii] |$\lambda \lambda 6548,6583$|, we get spectral fits of similar quality. We, therefore, cannot exclude, given the quality of the data, that the broad emission in the centre traces the BLR of an accreting black hole. Furthermore, more complex scenarios including both a potential BLR and an outflow component may be possible. In the following we briefly discuss the two ‘extreme’ scenarios of a pure outflow and a pure BLR; however, we stress that we cannot robustly distinguish between these two scenarios based on our data.
6.1 The outflow scenario
Starting with the outflow interpretation, we show examples of our two-component fits to the Voronoi bin in the central region showing the brightest emission (top panel), and to the integrated spectrum extracted over a larger aperture where broad emission is visible (bottom panel) in the left panels of Fig. 5. In both regions (and indeed in all individual regions encompassed by the larger aperture) the broad components are blue-shifted. Their FWHM of 820–1340 km s|$^{-1}$| are typical of AGN-driven winds (e.g. Veilleux, Cecil & Bland-Hawthorn 2005; Fabian 2012; Genzel et al. 2014; Heckman & Best 2014; Carniani et al. 2015; Harrison et al. 2016; Rupke, Gültekin & Veilleux 2017; Förster Schreiber et al. 2019; Veilleux et al. 2020, and references therein). From the large integrated aperture, we calculate a maximum outflow velocity of |$v_{\rm out}=\langle v_{\rm broad}\rangle +2\sigma _{\rm broad}=970\pm 220$| km s|$^{-1}$|, where |$\sigma _{\rm broad}$| is corrected for instrumental resolution (e.g. Genzel et al. 2011; Davies et al. 2019). The large outflow velocities indicate that the outflow is driven by an AGN (see also discussion by Maiolino et al. 2024).
![Two-component fits to integrated spectra in the central region of GN20. The top panels show fits to the central Voronoi bin with the brightest broad emission flux, while the bottom panel shows a fit to the larger aperture encompassing regions with broad emission based on visual inspection (see black contours in insets). Left panel: Fits including a set of broad components for H$\alpha$ + [N ii] $\lambda \lambda$$6548, 6583$, i.e. interpreting the broad emission as an outflow. The broad emission is blue-shifted with respect to the narrow emission, with FWHM typical of AGN-driven winds, particularly in the central Voronoi bin (FWHM$_{\rm broad}\ \gt\ 1000$ km s$^{-1}$). Right panel: Fits including a broad component only for H$\alpha$, i.e. interpreting the broad emission as the broad-line region (BLR) of an accreting black hole. The two fitting set-ups have a comparable goodness-of-fit. This is also apparent from the very similar residuals shown in the bottom part of the panels, res. = (data-model)/uncertainties. The integrated spectra are not corrected for the velocity field.](https://oup.silverchair-cdn.com/oup/backfile/Content_public/Journal/mnras/533/4/10.1093_mnras_stae1993/2/m_stae1993fig5.jpeg?Expires=1749145574&Signature=ovpRwhIvw1JHFcNN8Lt1aI6XQigc1enScJc8qnApOk18tFAN4u8P-ttBjhyJ3VTJqxyVAzjEtovlBurxi028T8nohrK3Wj56Mqv~it~nM5sg9v~48r9qgfrzvt3hBshZ0NuyrNn9H6-8y42VpDLlfC8ds4rSq2bFiCow4DDf-UfuKAdyMmKW3khNyQUZEXEaWu29ieHjXd46xxHM1AFrdgLQtKtrJYA1ei~MCBubuHatwrHXa6T-TWNviiwmNibkGW3sl-Zr82I8YKLheEIZ6M3YeXebZOo383hjMfAevvHV0k5l~pKdyKJzUGrUoY6bzIhzSC-CCK9mP1sHI1i6qw__&Key-Pair-Id=APKAIE5G5CRDK6RD3PGA)
Two-component fits to integrated spectra in the central region of GN20. The top panels show fits to the central Voronoi bin with the brightest broad emission flux, while the bottom panel shows a fit to the larger aperture encompassing regions with broad emission based on visual inspection (see black contours in insets). Left panel: Fits including a set of broad components for H|$\alpha$| + [N ii] |$\lambda \lambda$||$6548, 6583$|, i.e. interpreting the broad emission as an outflow. The broad emission is blue-shifted with respect to the narrow emission, with FWHM typical of AGN-driven winds, particularly in the central Voronoi bin (FWHM|$_{\rm broad}\ \gt\ 1000$| km s|$^{-1}$|). Right panel: Fits including a broad component only for H|$\alpha$|, i.e. interpreting the broad emission as the broad-line region (BLR) of an accreting black hole. The two fitting set-ups have a comparable goodness-of-fit. This is also apparent from the very similar residuals shown in the bottom part of the panels, res. = (data-model)/uncertainties. The integrated spectra are not corrected for the velocity field.
Assuming a photoionized, constant-velocity spherical outflow (Genzel et al. 2011; Newman et al. 2012; Davies et al. 2019, 2020; Förster Schreiber et al. 2019; Cresci et al. 2023) of the extent |$R_{\rm out}$| equal to the aperture radius (|$\sim 2$| kpc), with an electron density of |$n_{{\rm e}, \rm out}=1000$|/cm|$^{3}$| (e.g. Perna et al. 2017; Kakkad et al. 2018; Förster Schreiber et al. 2019), we would find a low mass-outflow rate of |$\dot{M}_{\rm out,ion}=0.7\pm 0.3~\mathrm{M}_\odot$| yr|$^{-1}$|. We note that this estimate is uncertain due to the unknown outflow geometry and electron density in the outflow (the data in the central region are too noisy for a direct measurement from the [S ii] doublet). Certainly, this value would correspond to a lower limit, considering the high obscuration in the centre of GN20, and because we are only tracing the warm ionized gas phase (e.g. Rupke & Veilleux 2013; Herrera-Camus et al. 2019; Roberts-Borsani 2020; Fluetsch et al. 2021; Avery et al. 2022; Baron et al. 2022; Cresci et al. 2023; Belli et al. 2024; Davies et al. 2024). For comparison, in a recent study of another obscured AGN at |$z=4.76$|, Parlanti et al. (2024) find a mass outflow rate of |$\dot{M}_{\rm out,ion}=11^{+57}_{-5.5}~\mathrm{M}_\odot$| yr|$^{-1}$|.
6.2 The BLR scenario
In the right panels of Fig. 5, we show the corresponding fits including only one broad component fixed at the position of the narrow H|$\alpha$| emission in the central Voronoi bin (see upper panel). The fit to the larger aperture is shown in the bottom, where we keep the position and FWHM of the broad component fixed to the fitting results from the central Voronoi bin. The fits are of comparable quality with the fits interpreting the broad emission as an outflow (|$\Delta$|BIC|$_{\rm outflow-BLR, central}=14$|, |$\Delta$|BIC|$_{\rm outflow-BLR, large~aperture}=9$|). From the properties of the (unobscured) putative BLR component, we would derive a black hole mass of |$\log (M_\bullet /\mathrm{M}_\odot)=7.3\pm 0.4$| following Reines & Volonteri (2015) and using the fit to the large aperture. For a galaxy of the stellar mass of GN20 (|$M_\star \sim 1.1\times 10^{11}\ \mathrm{M}_\odot$|), a value of |$\log (M_\bullet /\mathrm{M}_\odot)\sim 7.3$| would fall well within the scatter of local BLR AGN. However, this estimate does not account for extinction towards the BLR, and may therefore correspond to a lower limit, |$\log (M_\bullet /\mathrm{M}_\odot)\gtrsim 7.3$|.
Assuming that GN20 hosts an obscured AGN, Riechers et al. (2014) estimated an Eddington limit for its black hole mass of |$\log (M_\bullet ^{\rm Edd}/\mathrm{M}_\odot)=8.1{-}8.5$| based on its |$6\ \mu$|m continuum luminosity and an upper limit on the |$2{-}10$| keV X-ray luminosity. This value is consistent with our lower limit.
6.3 Emission line diagnostics
In addition to the broad linewidths in the central region of GN20, suggesting either large outflow velocities or the presence of an actively accreting black hole, we find high narrow-component ratios of [N ii] |$\lambda 6583$|/H|$\alpha \ \gt\ 0.6$| throughout large parts of GN20, and especially in the northern nuclear region and towards the south-west. This is illustrated in the left panel of Fig. 6, where we show a map of the narrow-component [N ii] |$\lambda 6583$|/H|$\alpha$| ratio based on the Voronoi-binned map (see Section 3). Values of [N ii] |$\lambda 6583$|/H|$\alpha \ \gt\ 0.6$| may be indicative of contributions through shocks, |$\alpha -$|enhanced evolved stellar populations, or photoionization by an AGN (Baldwin, Phillips & Terlevich 1981; Kewley et al. 2001; Kauffmann et al. 2003; Byler et al. 2019).
![Left panel: Map of the narrow-component [N ii] $\lambda 6583$/H$\alpha$ ratio derived from fits to the H$\alpha$ Voronoi-binned map (see Section 3). High ratios of [N ii] $\lambda 6583$/H$\alpha \ \gt\ 0.6$ throughout large parts of GN20, and especially in the northern central regions and towards the south-west, indicate likely photoionization by an AGN. Right panel: GN20 as classified through the WHAN diagnostic diagram (see Section 6.3). GN20 is largely consistent with the Seyfert regime, while some regions in the outskirts are consistent with being photoionized by SF. The black cross indicates the galaxy centre as adopted for the dynamical modelling.](https://oup.silverchair-cdn.com/oup/backfile/Content_public/Journal/mnras/533/4/10.1093_mnras_stae1993/2/m_stae1993fig6.jpeg?Expires=1749145574&Signature=lgwTaDgPj5vlxEuTExrrwjQNZ3Sq~qDThIlRdm9jv9xzFpy8g31gSdZd-SpDgUz3QvlCv8HGS1PBhy3UOiUj~9jeA7aJSEpsdpGva-sZrxZVyzHvn7x1wSzD1QgTGx0wvarRaqeQREB0oLMU7RsUwSpGq7GSUyrU7DcZbHafjM44Yi3KJ7o0uD46oBe30hgtOC0GYUUJwPtyYyvykZ5boUVSnLNR8W11BMYsbnzMQEzMB6exncUT~Je1zK3Gk9lbhmuAhyWjtwJfJfVWy0gyetfJ321WcwzC4~ppI4ct5nStpOrXbGLkRiVlUTXW3E6nlezyEiWInes9l-R1Ec6ZdA__&Key-Pair-Id=APKAIE5G5CRDK6RD3PGA)
Left panel: Map of the narrow-component [N ii] |$\lambda 6583$|/H|$\alpha$| ratio derived from fits to the H|$\alpha$| Voronoi-binned map (see Section 3). High ratios of [N ii] |$\lambda 6583$|/H|$\alpha \ \gt\ 0.6$| throughout large parts of GN20, and especially in the northern central regions and towards the south-west, indicate likely photoionization by an AGN. Right panel: GN20 as classified through the WHAN diagnostic diagram (see Section 6.3). GN20 is largely consistent with the Seyfert regime, while some regions in the outskirts are consistent with being photoionized by SF. The black cross indicates the galaxy centre as adopted for the dynamical modelling.
The BPT diagram (Baldwin, Phillips & Terlevich; Baldwin et al. 1981) comparing [N ii] |$\lambda 6583$|/H|$\alpha$| with [O iii] |$\lambda 5007$|/H|$\beta$| can provide insights into the dominant ionization mechanism in galaxies. The [O iii] |$\lambda 5007$| and H|$\beta$| lines are not covered in our grating observations. They are covered in the prism observations, yet due to the high obscuration they are undetected in most regions (see also Maseda et al. 2024). As an alternative diagnostic diagram, we use the equivalent width of H|$\alpha$| versus the [N ii] |$\lambda 6583$|/H|$\alpha$| ratio (the `WHAN' diagram; Cid Fernandes et al. 2010, 2011). In this diagram, for EW(H|$\alpha)\ \gt\ 6$| Å and log([N ii] |$\lambda 6583$|/H|$\alpha)\ \gt\ -0.4$|, galaxies fall into the Seyfert regime. Indeed, we find that most regions in GN20 are consistent with the Seyfert regime, while some regions in the outskirts are consistent with being photoionized by SF (EW(H|$\alpha)\ \gt\ 3$| Å and log([N ii] |$\lambda 6583$|/H|$\alpha)\ \lt\ -0.4$|). We show the classification based on the WHAN diagram throughout GN20 in the right panel of Fig. 6.
7 SUMMARY AND DISCUSSION
We have presented an analysis of the rest-frame optical kinematics in the large |$z\sim 4.055$| SMG GN20 using JWST/NIRSpec-IFU data. In the following, we discuss and summarize our main findings.
7.1 H|$\alpha$| morphology
We find extended, but clumpy and asymmetric H|$\alpha$| emission, that is largely arranged in a loop around a central emission peak. H|$\alpha$| is brightest along the loop in the north-western region (see Fig. 1). The central H|$\alpha$| emission peak broadly coincides with the compact rest-frame |$1.1\ \mu$|m nuclear (stellar) emission found through MIRI/F560W imaging by Colina et al. (2023) (see also Crespo Gómez et al. 2024). The edge of the extended envelope identified in their analysis overlaps with the H|$\alpha$| loop. The brightest H|$\alpha$| emission region partly overlaps with the rest-frame UV emission obtained with HST in F105W, but is generally located further to the north-east. We compare the rest-frame optical line emission obtained through our NIRSpec-IFS observations with rest-frame UV and near-infrared wavebands in Fig. 2.
7.2 Large-scale H|$\alpha$| kinematics
We find smooth, large-scale rotation in H|$\alpha$| (|$\Delta v_{\rm obs}\sim 610$| km s|$^{-1}$| and |$\sigma _{\rm obs,disc}\sim 50{-}150$| km s|$^{-1}$|; Fig. 3). We construct a 3D dynamical model including a thick disc, bulge, and dark matter halo, and simultaneously model the observed velocity and velocity dispersion maps by minimization on the projected 2D kinematics. From our best-fitting model (Fig. 4), we find |$v_{\rm rot}(R_{\rm e})=469$| km s|$^{-1}$|, |$\sigma _0=89$| km s|$^{-1}$|, |$v_{\rm rot}(R_{\rm e})/\sigma _0=5.3$|, and |$\log (M_{\rm dyn}(\lt 2R_{\rm e})/\mathrm{M}_\odot)\sim 11.7$|. These results are largely consistent with previous analyses of the molecular and ionized gas kinematics constrained by Very Large Array (VLA) observations of CO(2–1), Plateau de Bure Interferometer (PdBI) observations of CO(6–5), and MIRI/MRS observations of Pa|$\alpha$| (Carilli et al. 2010; Hodge et al. 2012; Bik et al. 2024).
7.3 Non-circular motions
The H|$\alpha$| velocity field shows deviations from circular motions. These deviations are particularly apparent in the north-western region of GN20, as also confirmed through a residual analysis based on our best-fitting dynamical model (Fig. 4). Non-circular motions may arise from a variety of phenomena, and several may be acting simultaneously in GN20, potentially including tidal interactions, accretion, and radial motions. To test one scenario, we construct a second dynamical model including a planar radial inflow of |$v_{\rm r}=130$| km s|$^{-1}$|, which indeed provides a slightly better fit to the data (|$\Delta \chi ^2_{\rm red}=0.33$|). However, significant residuals in the north-west remain also with this model, indicating that additional causes for perturbation of simple rotation exist in GN20 (Fig. A1).
7.4 AGN signatures
We find broad (FWHM |$\sim 1000{-}2000$| km s|$^{-1}$|) emission in the H|$\alpha$| + [N ii] complex in the central region of GN20. This broad emission can be modelled as a blue-shifted, high-velocity outflow in H|$\alpha$| and [N ii] (|$v_{\rm out}=970\pm 220$| km s|$^{-1}$|), or as a BLR in H|$\alpha$| emission, corresponding to a black hole of mass |$\log (M_\bullet /\mathrm{M}_\odot)\gtrsim 7.3$| (Fig. 5). We cannot robustly distinguish between these scenarios (or a combination of both) based on the data quality; however, both scenarios provide evidence for the presence of an active black hole in GN20. Further evidence is provided through high values of narrow-component [N ii] |$\lambda 6583$|/H|$\alpha \ \gt\ 0.4$| together with EW(H|$\alpha)\ \gt\ 6$| Å throughout large regions of the galaxy, consistent with photoionization by an AGN (Fig. 6).
7.5 Evidence for black hole feeding and feedback
Our kinematic and dynamical analysis provides tentative evidence that gas may be channelled into the nuclear region of GN20. These inflows could potentially fuel central SF and/or accretion on to the central black hole. Indeed we find evidence for an AGN in the centre of GN20 in the form of broad nuclear emission, signalling either AGN-driven outflows or an actively accreting black hole, and Seyfert-like ionization throughout the galaxy. In the local Universe, evidence for AGN feeding through molecular gas inflows has been observed, for instance through gravity torques induced by spiral or bar structure (e.g. Maiolino et al. 2000; Hunt et al. 2008; Casasola et al. 2011; Combes et al. 2014, 2019; Speights & Rooke 2016; Venturi et al. 2018; Audibert et al. 2019; Izumi et al. 2023). At higher redshift, |$1\ \lt\ z\ \lt\ 2.5$|, signatures of both ionized and molecular gas inflows have been revealed in deep observations of massive main-sequence galaxies (Price et al. 2021; Genzel et al. 2023).
In summary, our analysis suggests that GN20, an intriguingly large and massive SMG 1.5 billion years after the big bang, shows evidence for both non-circular motions (potentially fuelling AGN activity), and high ionization and possibly high-velocity outflows (i.e. feedback by the AGN), or the BLR of an actively accreting black hole. This work together with the recent studies by, e.g. Arribas et al. (2024), Jones et al. (2024), and Parlanti et al. (2024), highlight the potential of JWST/NIRSpec-IFS to unveil detailed, spatially resolved properties of |$z\ \gt\ 4$| dusty SF galaxies, such as the source(s) powering nebular emission and high-accuracy kinematic measurements, even in cases of extremely high dust attenuation. While SMGs were previously mainly characterized through their bright submillimetre emission, JWST opened up new avenues to study their formation and evolution. As argued by several authors, the rapid evolution, high ongoing SF, and dense environment make GN20 a prime progenitor candidate for present-day massive ETGs, those systems that contain the majority of the stellar mass existing today. Deeper NIRSpec observations of GN20 could help to further uncover the source of its broad nuclear emission, and to investigate in greater detail the deviations from circular motions in the H|$\alpha$| kinematics. This might shed further light on the assembly and evolution history of today’s most massive galaxies.
ACKNOWLEDGEMENTS
We are grateful to the anonymous referee for a constructive report that helped to improve the quality of this manuscript. We thank Chris Carilli, Luis Colina, Arjan Bik, and the MIRI GTO team for sharing data. We thank Arjan Bik and Takafumi Tsukui for comments on an earlier version of this manuscript. HÜ thanks the Infrared/Submillimeter Group at MPE for making the latest version of DysmalPy available prior to the code becoming public. Special thanks go to Stavros Pastras and Juan Manuel Espejo Salcedo for assistance with the code installation. AJB and GCJ acknowledge funding from the ‘FirstGalaxies’ Advanced Grant from the European Research Council (ERC) under the European Union’s Horizon 2020 research and innovation program (Grant agreement No. 789056). BRdP, MP, and SA acknowledge grant PID2021-127718NB-I00 funded by the Spanish Ministry of Science and Innovation/State Agency of Research (MICIN/AEI/10.13039/501100011033). FDE, JS, and RM acknowledge support by the Science and Technology Facilities Council (STFC), by the ERC through Advanced Grant 695671 ‘QUENCH’, and by the UKRI Frontier Research grant RISEandFALL. GV and SCa acknowledge support from the European Union (ERC, WINGS, 101040227). HÜ gratefully acknowledges support by the Isaac Newton Trust and by the Kavli Foundation through a Newton-Kavli Junior Fellowship. IL acknowledges support from PID2022-140483NB-C22 funded by AEI 10.13039/501100011033 and BDC 20221289 funded by MCIN by the Recovery, Transformation and Resilience Plan from the Spanish State, and by NextGenerationEU from the European Union through the Recovery and Resilience Facility.
DATA AVAILABILITY
The NIRSpec data used in this research have been obtained within the NIRSpec-IFU GTO programme GA-NIFS and is publicly available at MAST. Data presented in this paper will be shared upon reasonable request to the corresponding author.
Footnotes
As described in the Section 3.2, in our dynamical modelling we allow for an additional velocity shift of |$\pm 100$| km s|$^{-1}$|. Our fiducial model has a velocity shift of |$+28\pm 2$| km s|$^{-1}$|. This would correspond to a redshift of |$z_{\rm H\alpha ,model}=4.05\,325\pm 0.00\,075$|. However, we caution that the velocity shift can be degenerate with the adopted centre (fixed in our model). In addition, as discussed in Section 5, the model does not capture all kinematic features of the data.
REFERENCES
APPENDIX A: DYNAMICAL MODEL INCLUDING A FIXED RADIAL INFLOW
In Fig. A1, we show the results of our dynamical modelling including a uniform, planar radial inflow of fixed velocity |$v_{\rm r}=130$| km s|$^{-1}$|, i.e. we assume that gas is inflowing through the disc in an axisymmetric fashion and with radially constant velocity. The inflow velocity is not fitted for, but added as a fixed parameter (see Price et al. 2021). The preferred inflow velocity is initially identified through a grid search by injecting different values of |$v_{\rm r}$| in steps of 10 km s|$^{-1}$| from 0 to 200 km s|$^{-1}$|, using least-squares minimization. We then obtain the best-fit through MCMC techniques as described in Section 3, with the same free parameters as our fiducial model plus the radial inflow fixed at |$v_{\rm r}=130$| km s|$^{-1}$|. Our modelling results are listed in Table A1.

Same as Fig. 4, but including a planar radial inflow of |$v_{\rm r}=130$| km s|$^{-1}$| in addition to our fiducial disc, bulge, and halo model. Top (bottom) panels show the observed velocity (velocity dispersion) field (left panel), the best-fitting model (middle-left panel), residuals (data-model; middle-right panel), and goodness-of-fit (data-model)/uncertainties (right panel). The cross and line indicate the centre and best-fitting PA. The median velocity offset is |$\Delta v_{\rm med}=8.8$| km s|$^{-1}$| with an rms velocity difference of |$\Delta v_{\rm rms}=40.0$| km s|$^{-1}$|. Corresponding values for the velocity dispersion are |$\Delta \sigma _{\rm med}=15.4$| km s|$^{-1}$| and |$\Delta \sigma _{\rm rms}=34.6$| km s|$^{-1}$|. While we observe strong residuals particularly in the north-western region, as in our fiducial model, the magnitude of the residuals in the velocity field has decreased in this model, indicating that part of the deviations from circular motions could be explained by an inflow component.
Results from our best-fitting dynamical model including a thick disc, bulge, and dark matter halo, and a planar radial inflow of velocity |$v_{\rm r}=130$| km s|$^{-1}$|. For |$\sigma _0$|, we adopt minimum uncertainties of 10 km s|$^{-1}$|, and for the total baryonic mass we adopt minimum uncertainties of 0.1 dex. For |$f_{\rm DM}$|, we give the |$3\sigma$| upper limit.
| Fitted parameters | |
| |$\log (M_{\rm bar}/\mathrm{M}_\odot)$| | |$11.5\pm 0.1$| |
| |$\sigma _0$| (km s|$^{-1}$|) | |$89\pm 10$| |
| |$f_{\rm DM}(\lt R_{\rm e})$| | |$\lt 0.07$| |
| PA|$_{\rm kin}$| | |$17.1^{+0.4}_{-0.5}$| |
| Velocity shift (km s|$^{-1}$|) | |$31\pm 2$| |
| |$\chi ^2_{\rm red}$| | 4.6414 |
| Derived values | |
| |$v_{\rm rot}(R_{\rm e})$| (km s|$^{-1}$|) | 443 |
| |$v_{\rm circ}(R_{\rm e})$| (km s|$^{-1}$|) | 472 |
| |$v_{\rm rot,max}$| (km s|$^{-1}$|) | 483 |
| |$v_{\rm rot(R_{\rm e})}/\sigma _0$| | |$5.0\pm 0.6$| |
| |$\log (M_{\rm dyn}(\lt 2R_{\rm e})/\mathrm{M}_\odot)$| | 11.51 |
While we still find strong residuals with this second model specifically in the north-western region of GN20, the overall magnitude of the velocity residuals decreases. The reduced chi-squared statistics are improved compared with our fiducial model presented in Section 5 by |$\Delta \chi ^2_{\rm red}=0.33$|. This shows that the inclusion of a radial inflow can help to explain some of the non-circular motions observed in GN20.
We point out the change in the kinematic position angle of the best-fitting model including inflow with respect to our fiducial model. The best-fitting rotation velocities are reduced. In this model, we find little contribution of dark matter to the dynamics on galactic scales.
We compare the inflow velocity identified through our grid search to analytical estimates, as recently presented by Genzel et al. (2023). We follow their equation (11) and parameter choices to obtain an analytical expectation for the inflow velocity. For this, we evaluate the Toomre|$-Q$| parameter (Toomre 1964) following Binney & Tremaine (2008), Escala & Larson (2008), and Dekel, Sari & Ceverino (2009), at the radius where our best-fitting circular velocity curve reaches its maximum (see Übler et al. 2019), and find |$Q_{\rm gas}\sim 0.49$|. Following Genzel et al. (2023), we then obtain |$v_{\rm r}=102$| km s|$^{-1}$|, which is somewhat lower than our model-derived value. If we approximate the inflow velocity through |$v_{\rm r}\sim f_{\rm gas}^2 v_{\rm c}$| (Genzel et al. 2023), with |$v_{\rm c}$| measured at the effective radius, we obtain |$v_{\rm r}=138$| km s|$^{-1}$|, comparable with our model-derived value. In general, as pointed out by Genzel et al. (2023), analytical estimates of inflow velocities can vary by factors of a few (e.g. Dekel et al. 2009, 2013; Krumholz & Burkert 2010; Krumholz et al. 2018). Our comparison to analytical estimates shows that the model-derived inflow velocity is not unexpected for a galaxy with the mass and kinematics of GN20.
Evidence for inflows in massive, high-redshift (|$z\sim 1{-}2.5$|) SF disc galaxies has been found in deep ground-based observations (Price et al. 2021; Genzel et al. 2023). The radial velocities in those cases are measured to be |$v_{\rm r}\sim 30{-}120$| km s|$^{-1}$|, comparable with the putative inflow velocity of |$v_{\rm r}=130$| km s|$^{-1}$| in GN20.
In Fig. A2, we show the difference between our fiducial velocity model as presented in the top-middle-left panel of Fig. 3, and the velocity model including the radial inflow (top-middle-left panel of Fig. A1). The differences between the two models are most pronounced in the centre and in the outer regions.
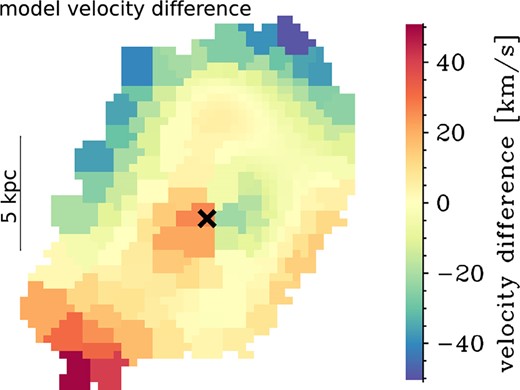
Difference in the model velocities of our fiducial model compared with the model including the radial inflow of |$v_{\rm r}=130$| km s|$^{-1}$|. The differences are most pronounced in the centre and in the outer regions.
