


ABSTRACT
The current and next observation seasons will detect hundreds of gravitational waves (GWs) from compact binary systems coalescence at cosmological distances. When combined with independent electromagnetic measurements, the source redshift will be known, and we will be able to obtain precise measurements of the Hubble constant H0 via the distance–redshift relation. However, most observed mergers are not expected to have electromagnetic counterparts, which prevents a direct redshift measurement. In this scenario, one possibility is to use the dark sirens method that statistically marginalizes over all the potential host galaxies within the GW location volume to provide a probabilistic source redshift. Here we presented H0 measurements using two new dark sirens compared to previous analyses using DECam data: GW190924|$\_$|021846 and GW200202|$\_$|154313. The photometric redshifts of the possible host galaxies of these two events are acquired from the DECam Local Volume Exploration Survey (DELVE) carried out on the Blanco telescope at Cerro Tololo. The combination of the H0 posterior from GW190924|$\_$|021846 and GW200202|$\_$|154313 together with the bright siren GW170817 leads to |$H_{0} = 68.84^{+15.51}_{-7.74}\, \rm {km\, s^{-1}\, Mpc^{-1}}$|. Including these two dark sirens improves the 68 per cent confidence interval (CI) by 7 per cent over GW170817 alone. This demonstrates that the addition of well-localized dark sirens in such analysis improves the precision of cosmological measurements. Using a sample containing 10 well-localized dark sirens observed during the third LIGO/Virgo observation run, without the inclusion of GW170817, we determine a measurement of |$H_{0} = 76.00^{+17.64}_{-13.45}\, \rm {km\, s^{-1}\, Mpc^{-1}}$|.
1 INTRODUCTION
The advent of gravitational wave measurements opened a new era of multimessenger observation, shedding light on the properties of our Universe. Standard sirens, a term introduced by Schutz (1986), provide a way to measure cosmological parameters by restricting the distance–redshift relation. The gravitational wave detections provide a direct measure of luminosity distance without any additional distance calibrator, justifying the name ‘standard sirens’ in analogy with standard candles. If a source has an electromagnetic counterpart, its redshift (z) can be directly measured, and we referred to them as ‘bright standard sirens’. The first bright standard siren measured was the binary neutron star (BNS) merger GW170817 (Abbott et al. 2017b), whose electromagnetic gamma-ray burst counterpart was detected by the Fermi Gamma-ray Burst Monitor (Goldstein et al. 2017) and the anticoincidence shield of the gamma-ray spectrometer on-board INTErnational Gamma-Ray Astrophysics Laboratory (Savchenko et al. 2017) within 0.1–0.647 s, and later complementing with the identification of the optical kilonova (e.g. Arcavi et al. 2017; Chornock et al. 2017; Coulter et al. 2017; Cowperthwaite et al. 2017; Evans et al. 2017; Kasliwal et al. 2017; Nicholl et al. 2017; Pian et al. 2017; Smartt et al. 2017; Soares-Santos et al. 2017; Tanvir et al. 2017; Valenti et al. 2017) detected about 11 h after the merger. This event produced the first direct and independent measure of H0, |$H_{0} = 70^{+12}_{-8}\, \rm {km\, s^{-1}\, Mpc^{-1}}$| (Abbott et al. 2017d).
After a 3-yr hiatus during which improvements in the sensitivity of the detectors were made, the upcoming fourth run of the LIGO, Virgo, and KAGRA collaboration will be able to observe a larger fraction of the universe than previous observing runs and projected to detect an estimated ∼90 gravitational wave events per year with an ∼85 per cent improvement in sky localization expected by the end of the run if all detectors are operating at their target sensitivities (Abbott et al. 2018). With more interferometers in operation (like the Einstein Telescope, Sathyaprakash et al. 2012; Cosmic Explorer, Abbott et al. 2017a; and the LISA space interferometer, Amaro-Seoane et al. 2017), it is possible that in the next years more standard sirens will be identified which can lead to an H0 measurement with precision in the same order as what is achieved with other cosmological probes such as the cosmological microwave background (CMB; Planck Collaboration 2020) and the Cepheid (Riess et al. 2021) or Red Giant Branch (Freedman et al. 2019)-calibrated type Ia supernovae. This new independent measurement of the Hubble constant can enable a way to clarify the origin of the observed current 4 − 6σ tension (Verde, Treu & Riess 2019; Di Valentino et al. 2021). Despite these improvements, detection of the events electromagnetic counterparts remains a challenge, requiring dedicated follow-up campaigns and strategies (Bom et al. 2023), particularly for those events involving black hole companions, which may have no electromagnetic signature emitted or be associated to a flare (Bom & Palmese 2023; Rodríguez-Ramírez et al. 2023).
A prime example of the challenge to localize and identify the electromagnetic emission of an event involving a black hole is the GW190814 event (Abbott et al. 2020b). GW190814 was the result of the coalescence of a 23.2Msun black hole with a compact object of mass 2.5–2.67 Msun. Since the secondary mass lies in the mass mass-gap region, this object was either the massive neutron star or the lightest black hole ever seen in a binary system. Due to its excellent sky localization (23 deg2), this event becomes a great candidate to provide the first detection of the counterpart of a binary system involving at least one black hole, hoping to shed light on the nature of this compact system. Several electromagnetic follow-ups, from gamma rays to radio, were started by different groups (e.g. Dobie et al. 2019; Gomez et al. 2019; Ackley et al. 2020; Andreoni et al. 2020; Vieira et al. 2020; Watson et al. 2020; Alexander et al. 2021; Kilpatrick et al. 2021; Tucker et al. 2021; de Wet et al. 2021) with a continuous duration of up to more than 250 d after the merger. The properties of the electromagnetic counterpart candidates were analysed and compared with the theoretical prediction for NSBH fusion, including optical spectra, variability of radio sources, their location, photometric evolution, and redshift of possible host galaxies. Despite immense dedicated effort, no sign of a gamma-ray burst or any optical counterpart has been identified, but allowed to discard some possible types of electromagnetic transients such as: kilonova with large ejecta mass M ≥ 0.1M⊙ (Ackley et al. 2020), ‘blue’ kilonovae with M > 0.5M⊙ (Kilpatrick et al. 2021), an AT2017gfo-like kilonova (de Wet et al. 2021), short gamma-ray burst with viewing angles less than 17° (Kilpatrick et al. 2021), and a short gamma-ray burst-like Gaussian jet with a particular configuration (Alexander et al. 2021). In view of these problems, an alternative to the lack of an electromagnetic counterpart is to use the redshifts of galaxies that are within the coalescence location volume to break the H0-z degeneracy and infer cosmological parameters. This methodology is known as dark standard sirens (see Gair et al. 2023 for a review of the method).
The dark standard sirens approach was applied to constrain the cosmology in several LIGO and Virgo detections. Fishbach et al. (2019) studied the event GW170807 and showed that the obtained precision of H0 is about 3 times worse than the ‘bright’ siren method (Abbott et al. 2017d). Soares-Santos et al. (2019) and Palmese et al. (2020) investigated the method with the Dark Energy Survey (DES) galaxy catalogue for binary black hole (BBH) mergers (GW170814 and GW190814, respectively) and showed that a single dark siren BBH provides a measure of H0 with a precision of 48 per cent for GW170814 and 55 per cent GW190814. Recently, Palmese et al. (2023) demonstrated that 8 dark sirens well localized in the sky are able to provide a measurement as accurate as that obtained with a single bright siren GW170817 (about 20 per cent against 18 per cent; Abbott et al. 2017d).
Chen, Fishbach & Holz (2018) predicted that 5 years of detections for LIGO, Virgo and KAGRA collaboration (at design sensitivity) could lead to a precision of ∼ 5 per cent and 10 per cent of H0 measurement for the BNS and BBH, respectively. For this result, they assumed that all events within 10 000 Mpc3 will be detected and that complete galaxy catalogues will be available. In the next decade, the arrival of the next generation of terrestrial interferometers, such as the Einstein Telescope and the Cosmic Explorer, could rapidly increase the number of detections, allowing us to check the predictions of the percentage level of the measure of H0 made by Muttoni et al. (2023).
The intent of this study is to investigate the ability of the dark siren events GW190924|$\_$|021846 and GW200202|$\_$|154313 to constrain the Hubble constant. We combine our results with that of 8 dark sirens present in Palmese et al. (2023) and perform the most precise H0 measurement with the better localized dark sirens. The choice for these events is justified due to the small localization volume, which decreases the number of potential host galaxies to be marginalized over, and because their localization region is covered by DELVE1 (Drlica-Wagner et al. 2021) galaxy catalogues. All the photometry redshift information is provided by the second release of DELVE data (DELVE DR22, Drlica-Wagner et al. 2022), the galaxy photometric redshift was estimated using the Mixture Density Network (MDN, Bishop 1994), a machine learning technique that provides the probability density function (PDF) of the photo-z. This technique uses magnitudes and colour information to train the various Gaussian distributions that will be combined into the final PDF. In contrast to previous work, our work innovates by applying DELVE data to the standard siren methodology for the first time for two new events from the third observing run (O3), implementing a more refined artificial neural network technique for photo-z measurements instead of the commonly used random forest algorithms (Zhou et al. 2020; Mucesh et al. 2021). The results of this study may provide insight into the potential of dark sirens as a cosmological probe, computing the precision level of H0 measurement that this methodology can achieve with realistic photometric uncertainty and sky coverage.
This paper is organized as follows: in Section 2 we describe the data used in the dark sirens methodology that is discussed in Section 3. Our results are presented and discussed in Section 4, and our final conclusions are presented in Section 5. Throughout the article, we adopt a flat ΛCDM cosmology with Ωm = 0.3 and H0 values in the 20–140 km s−1 Mpc−1 range. When not otherwise stated, quoted error bars represent the 68 per cent CI.
2 DATA
2.1 LIGO and Virgo data: gravitational wave events
Here, we extend the eight-event catalogue used in Palmese et al. (2023) by adding two new events: GW190924|$\_$|021846 and GW200202|$\_$|154313. In total, our sample includes the 10 best localized events in the sky detected during the third LIGO/Virgo observing period. For these two added events, we used the gravitational wave data from the maps publicly available by the LIGO and Virgo collaboration in Abbott et al. (2021a) and Collaboration et al. (2021). The right ascension (RA), declination (dec), and distance probability are given in HEALPIX pixels (Górski et al. 2005), where this probability is supposed to be Gaussian along each line of sight. GW200202|$\_$|154313 is the result of the merger of two black holes of approximately 7 and 10 solar masses, this is one of the best three-dimensional localizations from the second-half of the O3 (see Table 1), having a 90 per cent credible volume of 0.0034 Gpc3 and a 90 per cent CI area of 167 deg2. The location of maximum probability is centred at RA = 146.25 deg and dec = 20.98 deg. Marginalizing over all other parameters, the estimate of the luminosity distance has a mean equal to 364.3 Mpc with a standard deviation of 90.2 Mpc. The second detection, GW190924|$\_$|021846 is probably the result of the merger of two lowest-mass black holes so far observed (Abbott et al. 2021a), with inferred masses equal to |$m_{1} = 8.9^{+7.0}_{-2.0} {\rm M}_{\odot }$|, |$m_{2} = 5.0^{+1.4}_{-1.9} {\rm M}_{\odot }$| and a 90 per cent credible volume of ∼0.02 Gpc3 and a 90 per cent CI area of 348 deg2. The GW190924|$\_$|021846 has a maximum probability of being located at RA, dec = (134.561, 2.687) deg. At the peak location, the luminosity distance mean is 479.4 Mpc and the standard deviation is 151.7 Mpc. The area of the sky enclosing 90 per cent CI is 348 deg2. Fig. 1 shows the 90 per cent CI contours of all events used in this work with the area covered by DELVE. The two new events are fully covered by DELVE, except for a small tip on GW190924|$\_$|021846 containing approximately 2 per cent of the 90 per cent CI localization region.
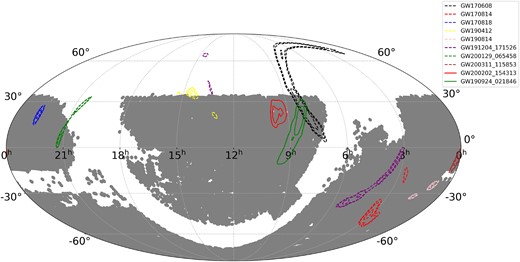
LIGO/Virgo GW dark standard sirens analysed in this paper, where the contours represent the 90 per cent CI localization from the sky maps. The shaded regions are those that are covered by the DELVE catalogues used in this work.
Luminosity distance, 90 per cent CI area, and volume of gravitational wave events and candidates used in this analysis. We also report the reference paper or GCN that reports the sky map used for each event. These events have estimated false alarm rates of fewer than 1 in 103–1023 years. These candidates have all recently been confirmed as gravitational wave events in Collaboration et al. (2021).
| Event | dL [Mpc] | A [deg2] | V [Gpc3] | Reference |
|---|---|---|---|---|
| GW170608 | |$320^{+120}_{-110}$| | 392 | 3 × 10⁻³ | Abbott et al. (2019) |
| GW170814 | |$540^{+130}_{-210}$| | 62 | 2 × 10⁻³ | Abbott et al. (2017c) |
| GW170818 | |$1060^{+420}_{-380}$| | 39 | 7 × 10⁻³ | Abbott et al. (2019) |
| GW190412 | |$740^{+120}_{-130}$| | 12 | 4 × 10⁻⁴ | Abbott et al. (2020a) |
| GW190814 | |$241^{+26}_{-26}$| | 19 | 3 × 10⁻⁵ | Abbott et al. (2020b) |
| S191204r | |$678^{+149}_{-149}$| | 103 | 6 × 10⁻³ | LIGO Scientific Collaboration and Virgo Collaboration (2019) |
| S200129m | |$755^{+194}_{-194}$| | 41 | 2 × 10⁻³ | LIGO Scientific Collaboration and Virgo Collaboration (2020a) |
| S200311bg | |$1115^{+175}_{-175}$| | 34 | 5 × 10⁻³ | LIGO Scientific Collaboration and Virgo Collaboration (2020b) |
| GW200202_154313 | |$410^{+150}_{-160}$| | 167 | 3 × 10⁻³ | Collaboration et al. (2021) |
| GW190924_021846 | 570 ± 220 | 348 | 2 × 10⁻² | Abbott et al. (2021a) |
2.2 The galaxies photo-z’s: a deep learning algorithm for DELVE data
The DELVE is a project that combines public data (including data from DES, Dark Energy Camera Legacy Survey and DECam eROSITA Survey) with more than 126 nights of novel observations made with the Dark Energy Camera (DECam, Flaugher et al. 2015) located on the 4-meter Blanco Telescope at Cerro Tololo Interamerican Observatory in Chile. DELVE uses the combination of the large field of view (3 deg2) and the fast readout time (27 s) of DECam with the expectation of providing complete coverage of the entire high-Galactic-latitude southern sky. In the WIDE observational program, the DELVE DR2 (Drlica-Wagner et al. 2022) covers >17,000 deg2 in the griz bands out to 23.5 mag.
The photometric redshifts (or photo-zs) for the DELVE data were computed using the deep learning method called Mixture Density Network. In brief, the method is a combination of a deep neural network with the assumption that any distribution can be written as a mixture of distributions (chosen to be the normal distribution in its traditional form). The deep neural network is trained, given some input features, to select the best parameters of the multiple distributions that will be mixed into a single distribution. The output parameters used are the mean, standard deviation, and mixing coefficients, which are the probabilistic weights of each normal distribution. In this way, the MDN is capable to reproduce the galaxy photo-z PDF, given some input features. The input features are the griz magnitudes, and the g − r, g − i, g − z, r − i, r − z, i − z colours. In the next sections, we use this approach to compute the photo-zs of the possible galaxy host whenever the spectroscopic redshift is not available.
The MDN was implemented with the following structure: a LMU layer with 212 units; a 2-layer Multi-Layer Perceptron with 96 units each; a Dropout layer with 20 per cent rate; and finally a MixtureNormal layer that returns the outputs (the mean, standard-deviation and weights of the 20 Gaussian distributions). The LMU layer was implemented using the keras-lmu Voelker, Kajić & Eliasmith (2019a) application; the inner Perceptron and Dropout layers, the standard DL framework and the MixtureNormal output layer were built within the tensorflow and tensorflow-probability libraries API3 (Abadi, Agarwal & et al. 2015).The architecture of the network also incorporates a Legendre Memory Unit (LMU, Voelker, Kajić & Eliasmith 2019b) Layer at the head of the network. This architecture was one of the networks submitted in the LSST-DESC Tomography Optimization Challenge (Zuntz et al. 2021), and it exhibited the best performance for the DELVE DR2 photo-z’s regression task. We combined the photo-z PDF estimated by the MDN output layer (also used for photometric redshift regression in the S-PLUS Survey in Lima et al. 2022) with the well-performing LMU layer to estimate the photometric redshifts. More details can be found in Teixeira et. al. Following the work of Zuntz et al. (2021), the LMU layer is included to more efficiently assign galaxies to redshift bins, selecting relevant information from previous data while simultaneously removing expendable data. For the loss function, we chose the maximum likelihood, which was minimized with the Nadam Optimizer (Dozat 2016) and results in a learning rate of 0.0002.
The network was trained to maximize the PDF peak value for the spectroscopic redshifts (zspec) of each galaxy. The spectroscopic information came from a crossmatch between DELVE DR2 and the data available in different large sky surveys (Colless et al. 2001; Mortlock, Madgwick & Lahav 2001; Wilson et al. 2006; Jones et al. 2009; Bacon et al. 2010; Drinkwater et al. 2010; Holwerda, Blyth & Baker 2011; Cooper et al. 2012; Mao et al. 2012; McLure et al. 2012; Bradshaw et al. 2013; Fèvre et al. 2013; Newman et al. 2013; Baldry et al. 2014; Treu et al. 2015; Wirth et al. 2015; Bayliss et al. 2016; Momcheva et al. 2016; Nanayakkara et al. 2016; Tasca et al. 2017; McLure et al. 2018; Scodeggio, M. et al. 2018; Masters et al. 2019; Ahumada et al. 2020; Newman et al. 2020; Pharo et al. 2020; Mao et al. 2021; Mercurio et al. 2021), which resulted in approximately 4.5 million galaxies with zspec measurements. We also added the zspec’s available from the DECals DR9 Catalogue (Dey et al. 2019) also by doing a crossmatch with the DELVE DR2 data. All the matches were made considering a maximal separation of 0.972 arcsec.
In order to guarantee high quality photometric data used to train and test the model, we apply the following constraints on the colours, signal-to-noise ratio (SNR), and the limit of zspec:
SNR > 3 for g
SNR > 5 for riz
−1 < g − r < 4
−1 < r − i < 4
−1 < i − z < 4
g < 22.5
0.01 < zspec < 1
The SNR cuts were used to eliminate spurious sources, bad measurements, and very faint galaxies. The g mag limitation serves to reinforce the exclusion of faint galaxies. The colour cuts were made in order to eliminate nonphysical (extremely blue and extremely red) objects (see Drlica-Wagner et al. 2018), thus the majority of the objects in our sample populate the colour-colour diagram in the regions −0.5 ≤ r − i ≤ 1.5 and −0.5 ≤ r − i ≤ 0.8. We restricted our zspec interval to avoid spurious detections of low surface brightness galaxies located at high redshift. We also used the MODEST_CLASS criteria (Drlica-Wagner et al. 2018) to remove contaminant stars by choosing the objects that lie in the classes 1 (high-probably galaxy) and 3 (ambiguous classification).
To account for the lack of a band on our data, we decided to train 3 different MDN’s for each different observation scenario: (1) full coverage, with optical data in griz bands and partial coverage when we are missing a band—coverage only in (2) gri bands or (3) grz bands. Each MDN was trained with the magnitude (and colours) appropriate to the different scenarios. We used all of them to predict the zphot’s. The objects with full coverage were assigned to the flag model_GRIZ, and the same was made for gri and grz coverages with the flags model_GRI and model_GRZ, respectively. For example, on the GW200202|$\_$|154313 event we have approximately 3.4M objects with estimated zphot’s, being |$\sim 62~{{\ \rm per\ cent}}$|, |$\sim 30~{{\ \rm per\ cent}}$| and |$\sim 8~{{\ \rm per\ cent}}$| of the objects covered by griz, grz, gri bands, respectively.
After the selection cuts, our training sample contains about one million objects distributed at redshift z < 1. There are 31 252 and 6367 of these galaxies in the 90 per cent probability region of GW190924|$\_$|021846 and GW200202|$\_$|154313, respectively. Fig. 2 shows this final distribution, where we plotted the redshift distribution dN/dz subtracted from uniform number density (dN/dz)com assuming |$H_{0} = 70\, \rm {km\, s^{-1}\, Mpc^{-1}}$| to emphasize the presence of overdensities along the line of sight.
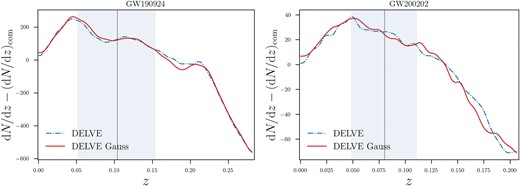
Redshift distribution of galaxies in the 90 per cent CI area of the dark siren events analysed in this work. The distribution is subtracted with a dN/dz with uniform number density to highlight the presence of overdensities and underdensities along the line of sight. The dashed blue line shows the distribution using the photometric redshift point estimates from the DELVE, the red line shows the same redshifts when their uncertainty is considered as a Gaussian error. The grey vertical lines represent the luminosity distance of each GW event marginalized over the entire sky, assuming an H0 of 70 km s−1 Mpc−1, and the shaded regions are the 1σ uncertainties considering the same H0; these regions are only shown for reference.
To evaluate the performance of our MDN method, we performed a complete analysis, evaluating the point statistics and PDF’s metric for the validation sample (represented by the 2.3|$\times 10^{5}\, z_{spec}$|’s that have not been used for training the photo–z’s). The predicted photo-z’s as a function of the measured spectroscopic redshifts is shown in the left panel of Fig. 3. We can see that the majority of data points lie close to the diagonal, thus pointing to the accuracy of the predicted redshifts. Additionally, we can see the presence of outliers in every redshift interval. However, the outlier fraction (which is defined as |Δz| > 0.15 × (1 + zspec)) results indicate that these data points only represent a minimum fraction (< 4 per cent) of the entire sample over the redshift range of interest. In order to avoid any systematic biases in DELVE galaxy distribution and their photo-z, we select three different areas with the same size of LIGO 90 per cent probability region and analyse the photo-z quality for these regions (solid lines and shadows in the right panel in Fig. 3). The right panel of Fig. 3 shows the median photo-z bias in photo-z bins of size 0.025 for DELVE and LEGACY-DR9 measurements. The results for DELVE full spectroscopic sample (dashed red line) and DELVE limited areas (dashed red line) revealed that the photo-z bias is under control at zphot = 0.5, having median bias values smaller than 0.01 for each photo-z bins and when considering the complete sample, the value reduces to -0.001. Thus, the measurements are uniform over the DELVE footprint. In contrast, the photo-z results from the LEGACY full spectroscopic sample (blue dashed line) appear to outperform DELVE, displaying median bias values consistently below 0.005. This difference in quality could be attributed to the fact that LEGACY measurements benefit from uniform coverage across all bands and also leverage the advantages of infrared bands in their Spectral Energy Distributions (SEDs). The scatter of zphot predictions was quantified with the normalized median absolute deviation, defined as |$\sigma _{\rm {NMAD}} = 1.48\times \rm {median}\left(|\Delta z|/\left(1+z_{spec}\right)\right)$|, and the 68th percentile width of the bias distribution about the median (σ68). Data for DELVE objects brighter than r < 21 yields σNMAD = 0.023 for all the galaxies in 0 < zspec < 0.3 and the σ68 is less than 0.04 for all the photo-z bins. These results are in agreement with previous works that use similar techniques to measure photometric redshift in large sky surveys (see, Lima et al. 2022). In order to validate the individual photo-z PDF as a whole, we use two different metrics: the probability integral transform (PIT) distribution and the Odds value. The PIT distribution for DELVE data has a positive skewness, which indicates that our deep learning methods overestimate the zphot. The Odds value represents the fraction of the photo-z PDF that is contained in the interval zspec ± 0.06, its distribution reveals that our MDN models produce narrow photo-z PDFs with their values centred near 1.
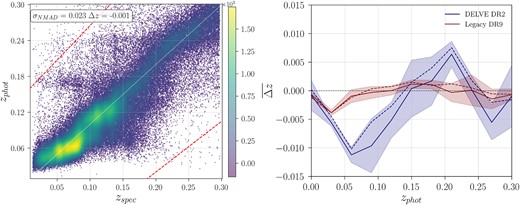
Photometric redshift quality assessment plots using the testing sample from the available spectroscopic data. Left: density plot of galaxies in the validation sample, showing the predicted zphot’s (PDF peaks) as a function of spectroscopic redshift. The red dotted lines represent the outliers’ limits, where outliers |$z_{\mathrm{ phot}}^{\mathrm{ out}}$| are defined as |$|z_{\mathrm{ phot}}^{\mathrm{ out}}-z_{\mathrm{ spec}}| \gt 0.15/(1+z_{\mathrm{ spec}})$|. Right: median value of the bias distribution Δz = zphot − zspec in bins of photometric redshift for our model used in the DELVE DR2 and the Legacy Survey DR9 photometric redshifts. The median was calculated taking three different non-correlated regions in the sky covered by our test sample. The regions were chosen to have the same area as GW200202|$\_$|154313. Both panels are plotted with r < 21 mag, zspec < 0.3 and zphot < 0.3.
As shown previously (Soares-Santos et al. 2019; Palmese et al. 2020; Palmese et al. 2023), to overcome the fact that our sample is magnitude-limited, we have to ensure that it is volume-limited. For that, we follow the same steps used in Palmese et al. (2023). For each GW event, we start by computing the maximum redshift after converting the higher 90 per cent CI bounds in luminosity distance into the redshift, adopting the largest value of H0 we considered in the prior. The next step is to find an absolute magnitude threshold value that corresponds to the apparent magnitude limit at the maximum redshift. Finally, we exclude all galaxies in our sample that have an absolute magnitude above this threshold (−19.39 and −20.32 for GW200202|$\_$|154313 and GW190924|$\_$|021846, respectively). The galaxies that survive this cut represent the most luminous galaxies. In this work we assume that the GW hosts trace the large-scale structure similarly to these most luminous galaxies. Thus, if the GW event occurred in a galaxy below our magnitude cut, the fainter galaxies follow the same matter distribution as the most luminous galaxies. The formation channel of binary systems has an influence on the specific properties of the GW hosts and whether it is able to pass through this cut. There are studies (e.g. Rauf et al. 2023) in the literature that point to the fact that more massive galaxies are indeed more likely to host BBH mergers, in favour of the chosen cuts. However, more work on this front is needed to expand the discussion for the different formation channels and their parameter space (e.g. the assumptions that go in the binary population synthesis).
3 METHOD
In this work, we used the Bayesian formalism, described in detail in Chen, Fishbach & Holz (2018) and adapted into Soares-Santos et al. (2019) and Palmese et al. (2020, 2023), to estimate the posterior probability of H0 for the dark siren method. The H0 posterior for a gravitational wave measurement dGW and electromagnetic data dEM for a galaxy survey is written via Bayes’ theorem as
where p(H0) is the prior on H0 and p(dGW, dEM|H0) is the joint GW–EM likelihood. Assuming that the GW and EM measurements are independent, the joint likelihood can be written as p(dGW, dEM|H0) = p(dGW|H0)p(dEM|H0). By marginalizing over the true redshift z, the sky position of the GW source, the photo-z bias Δz and over all the possible galaxy hosts, the H0 posterior can be written as in Palmese et al. (2023):
where r(z, H0) is the comoving distance, H(z) = H0(Ωm(1 + z)3 + 1 − Ωm)1/2 is the Hubble parameter in a Flat ΛCDM model, p(Δz) is the prior on the photometric redshift bias which is measured with the method described in the Section 2.2 (see Fig. 3), β(H0) is the selection function responsible for normalizing the likelihood, and |$\mathcal {Z}$| is the evidence term defined as |$\mathcal {Z}=\int dz_{i} p\left(d_{\rm EM}|z_{i}\right)r^2\left(z_{i}\right)/H\left(z_{i}\right)$|. The term |$p(d_{\rm GW}|d_{L}\left(z,H_{0}\right),\hat{\Omega }_i)$| is the marginal GW likelihood computed at the solid angle |$\hat{\Omega }_{i}$| and the redshift of the observed galaxy i, where we assume that this follow a Gaussian function according to Singer et al. (2016a). The second term in the integral represents the marginal EM likelihood of the galaxy shifted by the photo-z bias Δz, which is written as a product of galaxies photo-z PDFs computed using the deep learning algorithm described in Section 2.2. The above expression includes the assumption that the source of the GW is located in one of the galaxies present in the galaxy catalogue, making it a function of the solid angle |$\hat{\Omega }_{i}$| and the redshift of each galaxy.
The above posterior has two important ingredients: the selection effect defined by the β function and the photo-z bias Δz. The first is associated with the selection effects adopted in the measurement process (of the electromagnetic counterparts and the detection of gravitational waves), the β(H0) function is computed following the same steps described in Chen, Fishbach & Holz (2018) and Palmese et al. (2023). For the electromagnetic emission selection effects, we used galaxies from the DELVE DR2 catalogue distributed up to the known absolute magnitudes for each of the GW events in the analysis, where we consider only those in z < 0.5. As reported in Chen, Fishbach & Holz (2018) despite this being a simplification of the real EM selection effect, since it disregards any sky accessibility, weather, and observing conditions, it is still a coherent approximation for estimating the observation of the real-time electromagnetic follow-up. On a large scale, we assume that galaxies are isotropically distributed across the sky. By marginalizing over the entire sky, the selection function can be written as
where p(z) is the distribution of possible host galaxies and |$p^{\rm GW}_{\rm sel}\left(d_{L}\left(z,H_{0}\right)\right)$| is the probability of a source located at dL being detected. This term quantifies the GW selection effect introduced by detector sensitivity and detection conditions. For the computation of β(H0) we follow the same steps as Palmese et al. (2023): first we simulate 70 000 BBH mergers for 20 different values of H0 within our prior range |$\left[20,140\right] \rm {km\, s^{-1}\, Mpc^{-1}}$|. The BBH population is distributed through the redshift distribution p(z) which is a function of the merger rate evolution and the cosmology-dependent comoving volume element. For simplicity, we assume that the merger rate follow the Madau-Dickinson star formation rate (Madau & Dickinson 2014). The mass of the black holes is distributed according to a power-law with index 1.6 (in agreement with the results found in Abbott et al. 2021b). We draw spins from a uniform distribution between (− 1, 1). The GW signals were generated using the BAYESTAR software (Singer & Price 2016; Singer et al. 2016a, b) using the frequency domain approximant IMRPhenomD. Finally, we assume the O3 sensitivity curves for LIGO and Virgo4, use a matched-filter analysis, and calculate the SNR of each event. We assume, as a detection condition, that the network SNR is above 12 and at least 2 detectors have a single-detector SNR above 4.
Another important effect considered in our analysis is the photo-z bias correction. When we are dealing with simulated data, the machine learning algorithm used for photometric redshift estimates can provide a biased redshift probability distribution function. The non-uniform training samples can cause systematic biases in the photo-z, causing the peak of the distribution to be shifted by Δz from the true value of z. In order to consider this effect, we use the photo-z bias computation5 for the DELVE DR2 catalogue (see the detailed description of this calculation in Section 2.2) in different values of z that enter on H0 posterior through p(dEM|z, Δz).
This methodology can be extended to a sample of multiple events j with a combined data {dGW, j} and dEM, if we assume that the events are independent of each other and that they share the same galaxy catalogue. The Hubble constant posterior can be written as the product of the single event j likelihoods:
Note that the above expression does not apply to the two dark sirens studied here, since they do not share the same catalogue of galaxies because they are located in distinct regions of the sky and distance.
4 RESULTS AND DISCUSSION
We now use the DELVE photo-z’s in the dark siren methodology to produce the H0 posterior for GW190924|$\_$|021846 and GW200202|$\_$|154313. Then we combine the results for these two new GW events with those for eight dark siren events (GW170608, GW170818, GW190412, S191204r, S200129m and S200311bg, GW170814, and GW190814) from Palmese et al. (2020, 2023). The first five events were found in Palmese et al. (2023) using the DESI Legacy Survey galaxies’ redshifts, and the last two are presented in Palmese et al. (2020) with the photo-z catalogue from DES. Fig. 4 shows the H0 posterior from the combination of these two new dark sirens (dark red curve) and the final result (black curve) after combining the posterior of all the ten dark siren events. For comparison, we also show the results (blue curve) found in Palmese et al. (2020) with the dark sirens GW170814 and GW190814 and for the eight well-localized events (dark grey curve) found in Palmese et al. (2023). The two new events reduce the 68 per cent CI of the H0 prior to values close to those found in Palmese et al. (2023) (see Table 2): GW190924|$\_$|021846 is able to reach the value of 85 per cent and GW200202|$\_$|154313 achieve the constraint of 90 per cent. The H0 posterior distributions for GW190924|$\_$|021846 and GW200202|$\_$|154313 are presented in Fig. 5, we can see that both dark sirens display an evident peak at a low value of H0 (near 70 km s−1 Mpc−1 for GW190924|$\_$|021846 and ∼51 km s−1 Mpc−1 for GW200202|$\_$|154313) that is a consequence of the notable overdensity of galaxies (see Fig. 2) around redshift 0.05 to 0.1 and 0.05 for GW190924|$\_$|021846 and GW200202|$\_$|154313, respectively. As a result of better localization volume, which corresponds to a marginalization over a smaller number of galaxies, we can see that the posterior of GW200202|$\_$|154313 has a narrower peak, but the presence of a secondary peak at H0 ∼ 114 km s−1 Mpc−1 makes it flatter than GW190924|$\_$|021846 (its kurtosis value is lower, ∼1.79, than that produced by GW190924|$\_$|021846, ∼1.95). The analysis of the skewness showed that event GW190924|$\_$|021846 produces a slightly more asymmetric posterior (a relative difference of approximately 58 per cent) than GW200202|$\_$|154313. The individual posteriors shown in Fig. 5 present a high probability at the high H0 end. The same result was observed for the H0 posterior of GW190814 and GW170814 in Palmese et al. (2020), as explained by the authors, this is a characteristic of the dark siren method once the GW analysis only provides a dL that is coherent with high values of H0. Here we decided not to adopt a wide H0 prior, allowing to find a vast amount of galaxies distributed in redshifts that correspond to high values of H0. Fig. 2 reveals that the galaxies distributions for the two dark sirens are more uniformly distributed in comoving volume at high z, which results in a less informative EM likelihood and implies the recovery of the flat prior. The cut on the prior range does not bias the final result, as it only changes the redshift range considered in the dark siren analysis and not the posterior behaviour.
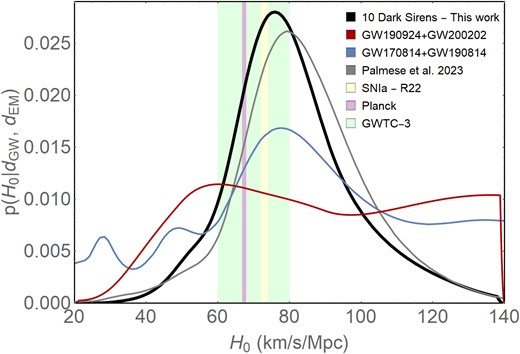
Hubble constant posterior distributions for the dark sirens considered in this work and previous works. The black line is the result of the combination of the two dark sirens considered here with the posteriors of all the eight dark sirens (grey line) found in Palmese et al. (2023). The combination H0 posteriors of GW190924|$\_$|021846 and GW200202|$\_$|154313 is shown in red, and for comparison we also show the combination result of GW170814 and GW190814 (blue line) presented in Palmese et al. (2020). For comparison, we show the 1σ constraints on H0 found by Planck Collaboration (2020), Riess et al. (2021) (R22), and Abbott et al. (2023) (GWTC-3) as the vertical shaded regions.
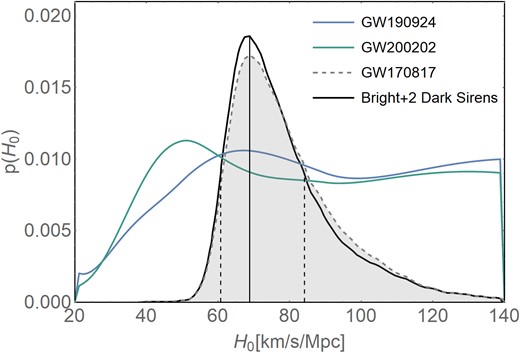
Hubble constant posterior distributions found using the DELVE galaxies for GW200202|$\_$|154313 (green line) and GW190924|$\_$|021846 (blue line). The dashed line represents the GW170817 bright siren result adapted from Nicolaou et al. (2020), which includes the peculiar velocity corrections for the galaxy host NGC 4993. The black line is the result from the combination of the two dark sirens from this work with GW170817, and the vertical dashed lines show the 68 per cent region for this posterior. Posteriors are arbitrarily rescaled only for visualization purposes.
Hubble constant measurements found with the dark sirens from the three LIGO/Virgo runs and the bright siren GW170817. All priors are flat in the range [20, 140]. The uncertainty from the flat prior is derived by assuming the same H0 maximum found in the analysis. Quoted uncertainties represent 68 per cent HDI around the maximum of the posterior. The ‘|$\sigma _{H_0}/\sigma _{\rm prior}$|’ column shows the 68 per cent CI from the posterior divided by 68 per cent CI of the prior width.
| Event | |$H_0\, \left(\rm {km\, s^{-1}\, Mpc^{-1}}\right)$| | |$\sigma _{H_0}\, \left(\rm {km s^{-1} Mpc^{-1}}\right)$| | |$\sigma _{H_0}/\sigma _{\rm prior}$| | Reference |
|---|---|---|---|---|
| GW190924|$\_$|021846 | |$70.4^{+54.7}_{-15.1}$| | 34.9 | 85 % | This work |
| GW200202|$\_$|154313 | |$51.2^{+61.6}_{-11.8}$| | 36.7 | 90 % | This work |
| GW170817—bright | |$68.8^{+17.30}_{-7.63}$| | 12.3 | 30 % | Nicolaou et al. (2020) |
| GW190814 | |$78^{+57}_{-13}$| | 35 | 86 % | Palmese et al. (2020) |
| GW190924 + GW200202 | |$60.33^{+55.79}_{-13.61}$| | 34.7 | 85 % | This work |
| GW190814 + GW170814 | |$77^{+41}_{-22}$| | 31.5 | 77 % | Palmese et al. (2020) |
| 8 dark sirens | |$79.8^{+19.1}_{-12.4}$| | 15.8 | 39 % | Palmese et al. (2023) |
| 10 dark sirens | |$76.00^{+17.64}_{-13.45}$| | 15.55 | 38 % | This work |
The combined result of all 10 dark sirens is shown in black in Fig. 4. The mode of the final posterior and the 68 per cent CI is |$H_{0}=76.00^{+17.64}_{-13.45}\, \rm {km\, s^{-1}\, Mpc^{-1}}$|. The addition of the two new dark sirens causes a reduction of ∼1 per cent over the 68 per cent confidence region found in Palmese et al. (2023). Table 2 summarizes our results and compares the performance with other standard siren analyses.
Fig. 6 illustrates the photo-z bias effect on the H0 posterior distribution for the events GW190924|$\_$|021846 and GW200202|$\_$|154313. We see that the effect is a little more significant for GW200202|$\_$|154313, with a relative difference of ∼0.1(0.09) for low(high) H0 values. For the GW190924|$\_$|021846 dark siren, these values vary from 0.0002 to 0.18. This is different than what was discussed in Palmese et al. (2020), which showed that the effect of marginalization over the photo–z bias is minimum for all values of H0.
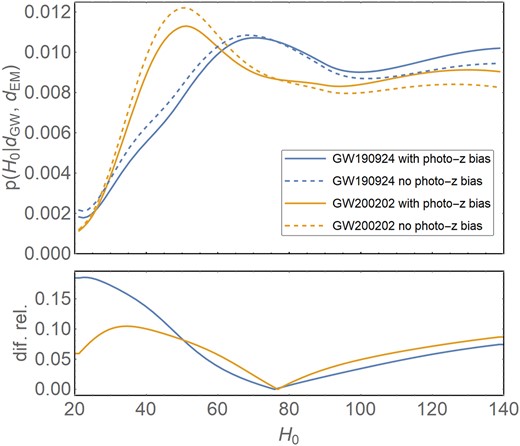
Photo-z bias effect on the Hubble constant posterior distributions for GW190924|$\_$|021846 (blue lines) and GW200202|$\_$|154313 (yellow lines). Solid curves are the results considering the inclusion of the photo-z bias correction, and dashed curves ignore this correction. The subplots present the relative difference between these two curves.
Another correction applied here is the full redshift PDF instead of a Gaussian approximation. The effect of this correction is shown in Fig. 7, where it is almost the same for the two dark sirens, with the relative difference varying between 0.0001 and ∼0.2 for the entire interval of H0.
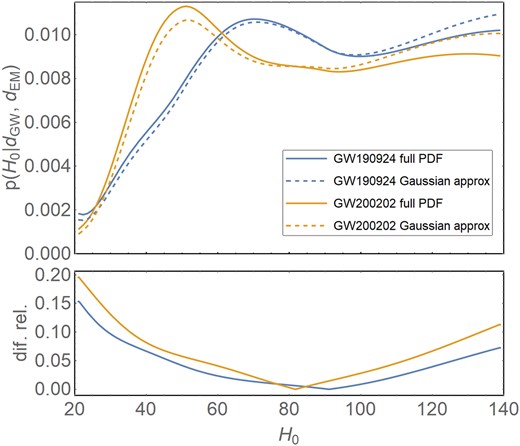
Comparison between the Hubble constant posterior distributions for GW190924|$\_$|021846 (blue curves) and GW200202|$\_$|154313 (yellow curves) obtained by using the full galaxies redshift PDFs and a Gaussian approximation. The subplots present the relative difference between the curves.
In order to understand the impact of dark sirens on the precision of H0, we combine our results with the bright siren GW170817 from Nicolaou et al. (2020). Fig. 5 presents the combined H0 posterior. The combination of GW190924|$\_$|021846, GW200202|$\_$|154313, and GW170817 gives |$H_{0} = 68.84^{+15.51}_{-7.74} \, \rm {km\, s^{-1}\, Mpc^{-1}}$|. We also combine the 10 dark sirens with GW170817, it gives |$H_{0} = 71.54^{+10.96}_{6.61} \, \rm {km\, s^{-1}\, Mpc^{-1}}$| representing an improvement of 6 per cent in the precision of the GW170817 measurement. This result highlights the improvement obtained when well-localized GW events at redshifts well covered by galaxy catalogues are incorporated into the analysis. Our results are in agreement with the recently presented results in Abbott et al. (2023), |$H_{0} = 68^{+8}_{-6} \, \rm {km\, s^{-1}\, Mpc^{-1}}$|, that used 47 dark sirens (43 BBH, 2 BNS, and 2 NSBH) from the third LIGO–Virgo–KAGRA GW transient catalogue (Collaboration et al. 2021) with GLADE + galaxy catalogues (Dálya et al. 2018, 2022). This constraint represents a reduction of ∼7 per cent in the 68 per cent CI of the H0 measurement found with only GW170817. Although our measurements is less precise than Abbott et al. (2023) (as expected given the smaller number statistics), we note that we expect our result to be less sensitive to the black hole population assumptions. As noted in Abbott et al. (2023), these assumptions, and specifically the shape of the mass distribution, strongly dominate the inference on H0. A possible cause of this dependency is the lack of completeness of GLADE + catalogue at the redshifts of interest.
5 CONCLUSIONS
In this work, we investigate the dark siren method to constrain H0, and present a new measure of H0 provided by two GW events detected by LIGO/Virgo, GW190924|$\_$|021846 and GW200202|$\_$|154313, with the redshifts of the potential host galaxies derived using DELVE DR2 data. The estimation of galaxies photo-z’s was performed using the deep learning technique Mixture Density Network. Our analyses implement the full redshift PDF of the galaxies instead of the Gaussian approximation. The main result of this study includes the measurement of the Hubble constant of |$70.4^{+54.7}_{-15.1}$| and |$51.2^{+61.6}_{-11.8}\, \rm {km\, s^{-1}\, Mpc^{-1}}$| for GW190924|$\_$|021846 and GW200202|$\_$|154313, respectively, which is consistent with previous measurements of H0. The combination of GW190924|$\_$|021846 and GW200202|$\_$|154313 together with GW170817 bright siren leads to |$H_0 = 68.84^{+15.51}_{-7.74} \, \rm {km\, s^{-1}\, Mpc^{-1}}$|, i.e. the addition of the two dark sirens reduces the 68 per cent CI interval by ∼7 per cent, which is comparable to the ∼12 per cent found in Palmese et al. (2020) when they add GW190814 and GW170814. This result demonstrates the power of well-localized dark siren events in better constraining the determination of the Hubble constant using deep imaging photometry obtained from surveys performing wide-sky coverage.
In addition, we also present the Hubble constant using only the dark standard siren method. We combine the H0 posteriors found here with the posteriors of the eigh well-localized dark siren events (GW170814, GW190814, GW170608, GW170818, GW190412, S191204r, S200129m, and S200311bg) presented by Palmese et al. (2020, 2023). The H0 measurement found is |$76.00^{+17.64}_{-13.45}$| km s−1 Mpc−1, which has a precision of 20 per cent and the 68 per cent CI interval is ∼38 per cent of the prior width. Our result indicates that a sample with ten well-localized dark sirens and a complete galaxy catalogue can provide a significant constraint on the Hubble constant that is equivalent to that achieved with a standard siren, providing complementary information to the standard method.
Our results provide an indication of the dark siren potential as a precision cosmological probe. After a period of sensitivity upgrades, over the past few months, the LIGO/Virgo/KAGRA collaboration has returned to operation and is expected to make ∼90 detections of mergers per year (Abbott et al. 2018). With the increase in GW observations and the arrival of deeper and wider surveys, like the forthcoming Vera C. Rubin Legacy Survey of Space and Time (LSST; Ivezić et al. 2019), it is possible that in the next few years, dark sirens will provide a measure of H0 at the several percentage level (Del Pozzo 2012). In this regime, we highlight the need for a more robust analysis, which takes into account potential systematics neglected in the methodology adopted here. Likely, some of the most significant sources of systematics will be the galaxy catalogue selection effects, galaxy catalogue completeness, the dependence of host galaxy properties on the BBH formation channels, and the use of a Gaussian approximation for the GW likelihood instead of its full asymmetric distribution. In future work, we intend to improve the dark siren methodology in order to consider these corrections.
ACKNOWLEDGEMENTS
For the analysis, we use the python programming language, along with the following package: astropy (Robitaille et al. 2013; Price-Whelan et al. 2018), matplotlib (Hunter 2007), numpy (Harris et al. 2020), scipy (Virtanen et al. 2020), tensorflow (Abadi et al. 2015), and ligo.skymap (Singer & Price 2016; Singer et al. 2016a, b; Kasliwal et al. 2017).
GT and CB acknowledge the financial support from CNPq (402577/2022-1). CB acknowledges the financial support from CNPq (316072/2021-4), FAPERJ (grants 201.456/2022 and 210.330/2022), and the FINEP contract 01.22.0505.00 (ref. 1891/22). The authors made use of Sci-Mind servers machines developed by the CBPF AI LAB team and would like to thank P. Russano and M. Portes de Albuquerque for all the support in infrastructure matters. CEM-V is supported by the International Gemini Observatory, a program of NSF’s NOIRLab, which is managed by the Association of Universities for Research in Astronomy (AURA) under a cooperative agreement with the National Science Foundation, on behalf of the Gemini partnership of Argentina, Brazil, Canada, Chile, the Republic of Korea, and the United States of America. GEM acknowledges support from the University of Toronto Arts & Science Postdoctoral Fellowship program. Time-domain research by DJS is supported by NSF grants AST-1821987,1813466, 1908972,2108032, and 2308181 and by the Heising-Simons Foundation under grant #2020-1864. JAC-B acknowledges support from FONDECYT Regular N 1220083.
The DELVE project is partially supported by the NASA Fermi Guest Investigator Program Cycle 9 No. 91201 and NSF awards AST-2108168 and AST-2307126. This work is partially supported by Fermilab LDRD project L2019-011.
This project used data obtained with the Dark Energy Camera (DECam), which was constructed by the Dark Energy Survey (DES) collaboration. Funding for the DES Projects has been provided by the U.S. Department of Energy, the U.S. National Science Foundation, the Ministry of Science and Education of Spain, the Science and Technology Facilities Council of the United Kingdom, the Higher Education Funding Council for England, the National Center for Supercomputing Applications at the University of Illinois at Urbana-Champaign, the Kavli Institute of Cosmological Physics at the University of Chicago, Center for Cosmology and Astro-Particle Physics at the Ohio State University, the Mitchell Institute for Fundamental Physics and Astronomy at Texas A&M University, Financiadora de Estudos e Projetos, Fundacao Carlos Chagas Filho de Amparo, Financiadora de Estudos e Projetos, Fundacao Carlos Chagas Filho de Amparo a Pesquisa do Estado do Rio de Janeiro, Conselho Nacional de Desenvolvimento Cientifico e Tecnologico and the Ministerio da Ciencia, Tecnologia e Inovacao, the Deutsche Forschungsgemeinschaft and the Collaborating Institutions in the Dark Energy Survey. The Collaborating Institutions are Argonne National Laboratory, the University of California at Santa Cruz, the University of Cambridge, Centro de Investigaciones Energeticas, Medioambientales y Tecnologicas-Madrid, the University of Chicago, University College London, the DES-Brazil Consortium, the University of Edinburgh, the Eidgenossische Technische Hochschule (ETH) Zurich, Fermi National Accelerator Laboratory, the University of Illinois at Urbana-Champaign, the Institut de Ciencies de l’Espai (IEEC/CSIC), the Institut de Fisica d’Altes Energies, Lawrence Berkeley National Laboratory, the Ludwig-Maximilians Universitat Munchen and the associated Excellence Cluster Universe, the University of Michigan, the National Optical Astronomy Observatory, the University of Nottingham, the Ohio State University, the University of Pennsylvania, the University of Portsmouth, SLAC National Accelerator Laboratory, Stanford University, the University of Sussex, and Texas A&M University.
Based on observations at Cerro Tololo Inter-American Observatory, NSF’s NOIRLab (NOIRLab Prop. ID 2019A-0305; PI: Alex Drlica-Wagner), which is managed by the Association of Universities for Research in Astronomy (AURA) under a cooperative agreement with the National Science Foundation.
BASS is a key project of the Telescope Access Program (TAP), which has been funded by the National Astronomical Observatories of China, the Chinese Academy of Sciences (the Strategic Priority Research Program ‘The Emergence of Cosmological Structures’ Grant # XDB09000000), and the Special Fund for Astronomy from the Ministry of Finance. The BASS is also supported by the External Cooperation Program of Chinese Academy of Sciences (Grant # 114A11KYSB20160057), and Chinese National Natural Science Foundation (Grant # 11433005).
This manuscript has been authored by Fermi Research Alliance, LLC, under contract No. DE-AC02-07CH11359 with the U.S. Department of Energy, Office of Science, Office of High Energy Physics. The United States Government retains and the publisher, by accepting the article for publication, acknowledges that the United States Government retains a non-exclusive, paid-up, irrevocable, worldwide license to publish or reproduce the published form of this manuscript, or allow others to do so, for United States Government purposes.
DATA AVAILABILITY
The data underlying this article will be shared on reasonable request to the corresponding author.
Footnotes
Tensorflow v2.9.1; Tensorflow Probability v0.17.0; keras-lmu v0.5.0
Available at https://dcc.ligo.org/LIGO-P1200087/public
