


ABSTRACT
This study aims to investigate the strong gravitational lensing effects in f(T) gravity. We present the theoretical analytic expressions for the lensing effects in f(T) gravity, including deflection angle, magnification, and time delay. On this basis, we also take the plasma lensing effect into consideration. We compare the lensing effects between the General Relativity in a vacuum environment and the f(T) gravity in a plasma environment. From a strongly lensed fast radio burst, the results indicate that in a plasma environment, General Relativity and f(T) gravity can generate indistinguishable image positions, but the magnification and time delay on these positions are significantly different, which can be distinguished by current facilities in principle. Therefore, the discrepancies between observational results and theoretical expectations can serve as clues for a modified gravity theory and provide constraints on f(T) gravity.
1 INTRODUCTION
The acceleration of the cosmic expansion is a pivotal discovery in modern cosmology (Caldwell, Dave & Steinhardt 1998; Perlmutter et al. 1999). To explain the accelerating expansion of the Universe, two scenarios have been proposed, one is to introduce the cosmological constant or ‘dark energy’ under the framework of General Relativity (GR), postulating the existence of new, unknown forms of energy driving the Universe’s expansion (e.g. Caldwell et al. 1998; Clowe et al. 2006; Frieman, Turner & Huterer 2008). The other explanation emerges from modified gravity theories (e.g. Clifton et al. 2012), which usually introduce modifications to the Einstein–Hilbert action through the addition of extra terms (e.g. Nojiri & Odintsov 2006; De Felice & Tsujikawa 2010). Similarly, the corresponding Lagrangian can be extended in various ways from the Teleparallel Equivalent of General Relativity, which uses torsion instead of curvature to describe gravity (Unzicker & Case 2005; Cai et al. 2011; Maluf 2013; Krššák et al. 2019; Bahamonde et al. 2023; Hohmann 2023). It has been demonstrated that these modified torsional gravity theories, particularly the f(T) theory, exhibit reliable performance in cosmology. It can explain not only the early inflation but also the current acceleration of the expansion of the Universe (e.g. Bengochea & Ferraro 2009; Bamba et al. 2011; Böhmer, Mussa & Tamanini 2011; Cai et al. 2011, 2016; Capozziello & de Laurentis 2011; Zheng & Huang 2011; Bamba, Odintsov & Sáez-Gómez 2013; Farrugia & Said 2016; Li et al. 2018b; Wang & Mota 2020; Yan et al. 2020; Ren et al. 2021a, 2022; Zhao et al. 2022).
For the f(T) power-law model, represented as |$f(T)=T+\boldsymbol {\mathring{\alpha }}T^n$|, extensive research has been conducted to investigate the constraints on the spherically symmetric solutions of f(T) gravity through Solar-system experiments (e.g. Iorio & Saridakis 2012; Xie & Deng 2013; Iorio et al. 2016). For example, in Ruggiero (2016), an upper limit for the parameter |$\boldsymbol {\mathring{\alpha }}$| is estimated, 5 × 10⁻¹ m2, giving a relatively stringent numerical constraint. To further determine the range of the |$\boldsymbol {\mathring{\alpha }}$|, experiments beyond the Solar system are necessary. The phenomenon of strong gravitational lensing offers an extension of the experimental scope from the Solar system to the cosmological scale.
The Universe contains massive objects, such as galaxies and galaxy clusters, which possess strong gravitational potential (Kravtsov & Borgani 2012). When passing near massive objects, the light emitted from distant sources experiences deflection, resulting in the formation of distorted images of the source, a phenomenon known as gravitational lensing (Refsdal 1964; Blandford & Narayan 1992; Schneider, Ehlers & Falco 1992b; Surdej et al. 1993). The magnification of these images is a crucial aspect of gravitational lensing, it provides us with the opportunity to probe distant objects (e.g. Kelly et al. 2015), and study the matter distribution of the lens (e.g. Blandford & Narayan 1986; Keeton 2001). Another remarkable feature of gravitational lensing is the time delay effect between the multiple images of a single source. The time delay is sensitive to both the geometry of the Universe and mass distribution of the lensing object (e.g. Oguri et al. 2002; Bozza & Mancini 2004; Gürkan et al. 2010; Suyu et al. 2013; Treu, Suyu & Marshall 2022). Consequently, the gravitational lensing effect has proven to be a powerful tool in astrophysics and cosmology, enabling researchers to probe the properties of both the lensing objects and the background sources, and also testing cosmological theories (e.g. Zhang et al. 2007; Treu 2010; Hildebrandt et al. 2017).
Gravitational lensing can be also used to constrain and validate different modified gravity theories (e.g. Schmidt 2008; Narikawa et al. 2013; Yang et al. 2019; Bahamonde, Levi Said & Zubair 2020; Ren et al. 2021b; Kuang et al. 2022; Nazari 2022). Given the high precision achievable in gravitational lensing time delay measurements (e.g. Sluse et al. 2012; Tewes et al. 2013; Chen et al. 2016), we specifically focus on comparing the f(T) gravity with General Relativity by lensing time delay. Therefore, rapid transient sources are necessary for background source (Oguri 2019; Liao, Biesiada & Zhu 2022). Fast Radio Burst (FRB) has served as a powerful probe for studying theories related to cosmic accelerating expansion (e.g. Zitrin & Eichler 2018; Oguri 2019; Abadi & Kovetz 2021). With the advantage of extremely bright pulses (∼50 mJy–100 Jy) and short duration (∼ms) (Lorimer et al. 2007; Spitler et al. 2016; Marcote et al. 2017; Cordes & Chatterjee 2019), the time delays induced by lensing can be precisely estimated from the observational data and provide tight constraints to cosmology (e.g. Wu et al. 2014; Muñoz et al. 2016; Abadi & Kovetz 2021; Wucknitz, Spitler & Pen 2021; Gao, Li & Gao 2022). The predicted number of events of lensed FRBs is reasonable in the future (Connor & Ravi 2023).
The emission of FRBs mainly falls in low-frequency radio bands. The radio signals from cosmic distances are refracted as they travel through cold plasma thus resulting in plasma lensing effect (e.g. Clegg, Fey & Lazio 1998; Tuntsov et al. 2016). The plasma in the lens galaxy can induce such an effect on the signal of a lensed FRB. In this work, we address the lensed FRBs produced by f(T) gravity in a plasma environment and discuss their differences from the gravitational lensing effects in GR. Additionally, we give predictions of the lensing effect generated by plasma in both GR and f(T) for various |$\boldsymbol {\mathring{\alpha }}$| values.
The outline of this paper is as follows: In Section 2, we give a brief introduction to the lensing framework. In Section 3, we derive the gravitational lensing effects under f(T) gravity. In Section 4, the plasma lensing effects are included as well for strongly lensed radio sources. We compare the f(T) gravity with GR by simulating an example of lensed FRB. Finally, Section 5 gives the discussion and summary.
2 LENSING FRAMEWORK
We outline the basic formulae of the gravitational lensing effect in this section, one can find more details in (Meneghetti 2022). Thin lens approximation and weak field approximation are adopted in this work, i.e. the impact parameter is much larger than the Schwarzschild radius of the lens (Blandford & Narayan 1992; Narayan & Bartelmann 1996). The difference between the GR and f(T) becomes significant in the case of a strong field, i.e. a small impact parameter. Such kinds of observations at the moment can be achieved only near the black hole, e.g. the shadow of black hole (e.g. Johannsen et al. 2016; Ayzenberg & Yunes 2018; Cunha & Herdeiro 2018; Mizuno et al. 2018; Psaltis et al. 2020; Afrin, Vagnozzi & Ghosh 2023). Thus, we only consider the weak field cases in which the observation will be easier to perform (e.g. Berti et al. 2015; Hees et al. 2017; GRAVITY Collaboration 2018; Ferreira 2019). Here, we present the relevant coordinate definitions for lensing: we begin by considering an optical axis that is perpendicular to both the lens and source planes, passing through the observer. On the source plane, |$\vec{\beta }$| represents the angular position of the source, while on the lens plane, |$\vec{\theta }$| represents the apparent angular position of the received light, and |$\vec{\alpha }(\vec{\theta })$| denotes the deflection angle caused by the lensing effect. The effective gravitational lensing potential |$\Psi (\vec{\theta })$| is defined as
where ϕ is the gravitational potential, and Z is the comoving angular diameter distance along the line-of-sight. DLS, DS, DL is, respectively, the angular diameter distance between lens and source, source and observer, lens and observer. The gravitational lensing effects are fully determined by the surface mass density of the lens in the thin lens approximation. The dimensionless surface mass density κ, which also represents the lensing convergence and can be given by half of the Laplacian of Ψ,
The gravitational lensing effects are determined by Ψ (or κ) and then show up by the deflection of light. The deflection angle can be calculated from the gradient of lens potential
For simplicity, we will use dimensionless coordinates. The image position |$\vec{x}$| obtained from the observation can be related to the deflection angle |$\vec{\alpha }(\vec{x})$| and source position |$\vec{y}$| through the lens equation:
where |$\vec{y} = \vec{\beta }/\theta _\mathrm{ E}$|, |$\vec{x} = {\vec{\theta }}/{\theta _\mathrm{ E}}$|, and |$\vec{\alpha }(\vec{x}) ={{\vec{\alpha }(\vec{\theta })}}/{\theta _\mathrm{ E}}$|. The Einstein radius, denoted as θE, is the radius of the Einstein ring, marking the boundary inside which strong lensing effects become noticeable. This radius reflects the total mass of the lensing object and influences the distances between the lensed images (Meneghetti 2022).
The surface mass density κ can be estimated from observation, such as image positions, distortions, and magnifications, but degeneracy exists in general (Schneider 2019). If the angular size of the source is small, the lensing image distortion can be described by the Jacobian matrix of the lens equation
The determinant of |$\mathcal {A}$| gives the magnification of the image μ by
Along the curve where det|$\mathcal {A}=0$|, the theoretical magnification becomes infinity, and the curve is called the critical curve on the image plane. The corresponding curve on the source plane is caustic. The shear γ, which characterizes the stretching for an extended source, can be calculated from the second derivative of the lensing potential (e.g. |$\partial ^2 \Psi /{\partial x_i \partial x_j} \equiv \Psi _{i j}$|),
3 LENSING EFFECT UNDER F(T) GRAVITY
In this section, we derive the gravitational lensing effects for the power-law model of f(T) gravity, i.e. |$f(T) = T+ \boldsymbol {\mathring{\alpha }}T^2$| (e.g. Ruggiero & Radicella 2015; Ruggiero 2016). In the point mass model, the deflection angle of f(T) gravity is given by Chen et al. (2020):
where ξ = DLθ (|$\theta \equiv |\vec{\theta }|$|) is the impact parameter, m is the mass of the point lens, and |$\boldsymbol {\mathring{\alpha }}$| indicate the departure of f(T) from GR. The point model is used for compact objects such as neutron stars or black holes. For f(T) gravity theory, the constraint parameter |$\boldsymbol {\mathring{\alpha }}$| is generally considered to be a constant independent of mass. Predictions of different values of the |$\boldsymbol {\mathring{\alpha }}$| between the f(T) gravity theory and GR for the deflection angle have been proposed, and compared with actual observational data (e.g DeBenedictis & Ilijić 2016; Ilijić & Sossich 2018). Similarly, we assume that |$\boldsymbol {\mathring{\alpha }}$| is a constant independent of the lens mass in this work.
3.1 SIS model
The Singular Isothermal Sphere (SIS) model is commonly used to describe the dark matter halo profile of a lens galaxy, particularly for the elliptical galaxies (Binney & Tremaine 1987; Schneider, Ehlers & Falco 1992a; Binney & Tremaine 2008; Hurtado, Castañeda & Tejeiro 2014). In this model, the mass density is inversely proportional to the radius to the power of two, i.e. ρ ∝ r−2, with r ≡ (ξ2 + Z2)1/2. Such a profile can give a constant velocity dispersion σv of the dark matter ‘particle’ of the galaxy halo. The surface mass density of an SIS halo is
The Einstein radius of an SIS halo in GR is
In order to calculate the effective lensing potential, we start from the gravitational potential of f(T). By integrating equation (9) and comparing with the deflection angle from GR, one can obtain the gravitational potential of f(T):
The convergence under f(T) gravity can be calculated using equation (2):
It can be simplified to
where x ≡ θ/θE is the dimensionless coordinate. The parameter A absorbs the redshifts (zS, zL), the Einstein radius θE, and the f(T)-related parameter |$\boldsymbol {\mathring{\alpha }}$|. In this work, we consider the following ranges: zL ∈ (0.15, 1.5) and zS ∈ (0.6, 6.0), which encompass the redshift range of strongly lensed quasars observed to date.1 For θE, we assume a typical value of 1 arcsec. As for the parameter |$\boldsymbol {\mathring{\alpha }}$| in the power-law model of f(T) gravity, f(T) will regress to GR gravity when |$\boldsymbol {\mathring{\alpha }}=0$|. Thus, its lower limit often left unspecified (Bahamonde et al. 2023), while its upper limit varies widely (e.g. Iorio, Radicella & Ruggiero 2015; Ruggiero 2016; Chen et al. 2020). In this analysis, we adopt an upper limit of recent observation |$\boldsymbol {\mathring{\alpha }} = 0.33$| pc2 (Chen et al. 2020), which gives A = 1. In order to explore a large portion of the possible values, we adopt A in this analysis spanning from 1 to 10−15.
In terms of polar coordinate defined by |$\vec{x}=x(\cos \varphi , \sin \varphi)$|, the lensing potential can be found by solving the Poisson equation:
which is
Then, the deflection angle can be written by
The expression of the deflection angle in modified gravity is typically more complex than equation (17), many of them show non-single power-law behaviours (e.g. Nzioki et al. 2011; Wei, Yang & Liu 2015; Campigotto et al. 2017; Sharma et al. 2023). And most works focus on the point lens (e.g. Alhamzawi & Alhamzawi 2016a, b; Panpanich, Ponglertsakul & Tannukij 2019). In Enander & Mörtsell (2013), the deflection angle in Hassan–Rosen bimetric gravity is expressed as |$\alpha (x) = \alpha _{\mathrm{ GR}}(1+c^2 e^{-z_{\mathrm{ E}}})$|, where |$z_{\mathrm{ E}} = m D_{\mathrm{ L}} \theta _{\mathrm{ E}} \sqrt{\frac{(c+c^{-1})(\beta _1 + 2\beta _2 c + \beta _3 c^2)}{q}}$| is a specific parameter that depends on the Einstein radius and the distance of the lens, and other parameters in the Hassan–Rosen theory: m, c, βi and q. When zE varies from 50 to 100, the addition term of deflection angle ranges from 10−5 to 10−27 arcsec (in case of θE = 1 arcsec). In Sharma, Yadav & Verma (2021), the deflection angle in f(R) gravity express as |$\alpha = 16 \pi G \rho (\frac{r_{out}}{\xi })^2 (-\frac{1}{2} e^{-(\frac{\xi }{r_{out}})^2} + \frac{\sqrt{\pi }}{4} (\frac{r_{out}}{\xi })\text{erf}(\frac{\xi }{r_{out}}))$|, where ξ = xθEDL still represents the impact parameter, rout is the cutoff radius of the dark matter halo where ρ(rout) = 0. For a case rout = 5 kpc, dark matter halo core density ρ = 10−14 kg m−3 in general (see Sobouti 2007; Wong et al. 2012) and the same zL as we use, the value of the deflection angle varies around 10−5 arcsec (in case of x = 1, θE = 1 arcsec). Unlike our result, which decreases with x, these modified deflection angles also show non-monotonous behaviours with x.
Comparisons of dimensionless deflection angle under f(T) and GR are shown in Fig. 1. Since the correction to the deflection angle is proportional to the parameter A, we choose a midpoint of the A range, 10−8, to illustrate the differences in the deflection angle caused by GR and f(T). In the left panel, we show the dimensionless deflection angle αGR, αf(T), and Δα ≡ αf(T) − αGR as a function of image positions x. We find that the divergence of f(T) only appears when the image forms close to the centre of the lens. In the right panel, we show the difference in the deflection angle Δα as a function of the parameter A. Three colours are used to indicate three different image positions. We take the most accurate space-borne telescope, Gaia, as our reference, which can reach microarcsecond (μarcsec) global astrometry.2 The radio observation by very long baseline interferometry (VLBI) can achieve a milliarcsecond level of accuracy (e.g. Thompson, Moran & Swenson 2017). We adopt the limit accuracy of the image position by 10−6 arcsec and a typical Einstein radius θE = 1 arcsec. The minimum separation between the lens and the images needs to be larger than the effective radius of the galaxy. We use an optimistic value of separation, 0.1 arcsec, which corresponds to a lens with effective radius of several kpc (Chen et al. 2019). With that, we show the possible detection area for the parameter A by the grey shadow in the right panel of Fig. 1. We also show a more conservative limit of image separation 1 arcsec and image astrometry 10−3 arcsec by the darker region.
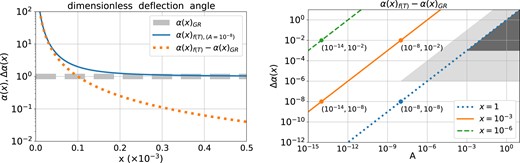
The left panel shows the dimensionless deflection angle in GR (dashed line), f(T) gravity (solid line), and their difference (dotted line). The right panel shows α(x)f(T) − α(x)GR with different values of A. Three image positions are shown with different colours. The coordinates of several points are presented for better comparison. The grey area shows the possible range that is distinguishable by the current telescope.
Now we turn to investigate other properties of the lensing effect in f(T) gravity. The weak lensing shear under f(T) can be given by
and the magnification is
Fig. 2 compares μGR and μf(T) with A = 10−2, 10−8 as an example to demonstrate how the magnification shift when different values of A are chosen. In GR, μ becomes infinity at exact x = 1, i.e. the critical curve. In f(T) gravity, the critical curve will shift outwards, and the larger A is, the outer the critical curve. For small A, the green curve almost overlaps with the curve of GR. The difference between GR and f(T) case becomes significant near the critical curve, where the lensing effects are strong.
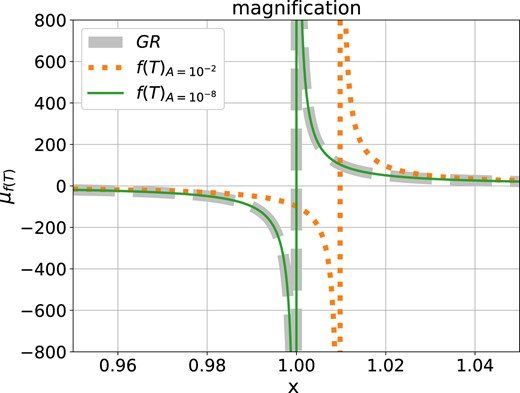
The magnification near the critical curves on the image plane with different A. The grey dashed line represents that of GR. The other two coloured curves show that of f(T) with different A.
The critical curve can be obtained by solving μ−1 = 0 from equation (19). For the SIS halo is axially symmetric, the solutions give the radii of the critical curve. Since A > 0, under the condition that the solution is positive and real, we obtain:
When A = 0, the solution returns back to GR, i.e. |$X_{t_{\mathrm{ GR}}}=1$|. We show the relation of equation (20) in Fig. 3. When A ≥ 10−3, |$X_{t_{f(T)}}$| differs significantly from |$X_{t_{\mathrm{ GR}}}$|.
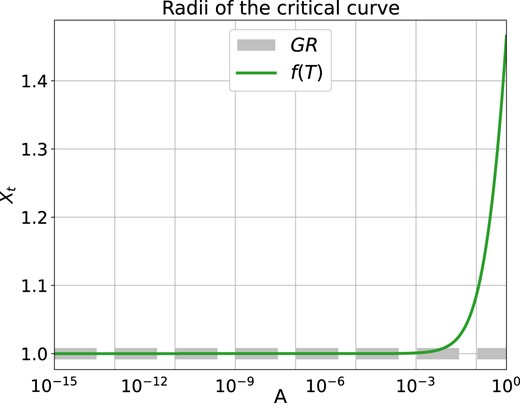
The relation between the radii of critical curve Xt and the parameter A for SIS lens (equation 20). The horizontal coordinate is shown in the logarithmic scale.
In Fig. 4, we compare the image positions between the GR (left panel) and the f(T) (right panel). In GR, the SIS halo can generate two images when the source is within the caustics, i.e. |$|\vec{\beta }|\lt \theta _\mathrm{ E}$|. While in f(T), the lens can always generate two images in principle, even if the source is outside the caustic. However, when the secondary image is very close to the lens, it will be strongly demagnified. Furthermore, Fig. 5 shows the image position corresponding with the different source locations in f(T) and GR lensing system. For GR, there is a ‘jump’ in the x − y relationship, which is absent in the f(T) case. In the two solutions of x, one is close to that of GR, while the other approaches 0 as |y| increases.
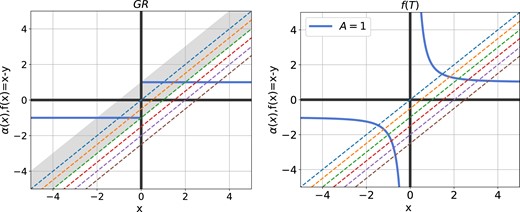
Image diagram for SIS halo under GR (left panel) and f(T) (right panel). The blue solid lines represent the deflection angle α(x). The coloured dashed lines show the function f(x) = x − y for a range of y ∈ (0, 2.5), the corresponding y values from top to bottom are y = 0, 0.5, 1, 1.5, 2, 2.5. According to lens equation equation (4), intersections of the dashed and solid line indicate the positions of images. While the grey area in the left panel is where α(x) and f(x) have two intersections, i.e. lensing can generate two images in this region.
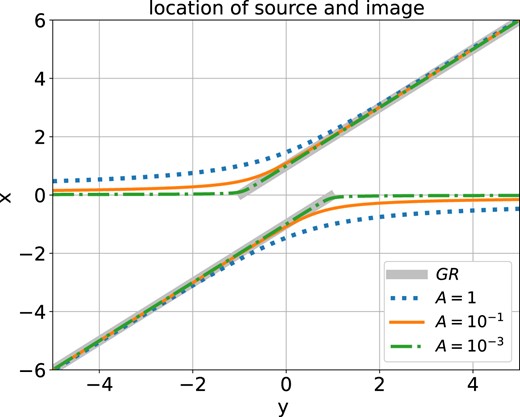
Image diagram for location of source and image. The abscissa y represents the position of the source, and the ordinate x represents the position of the corresponding image. The x − y relation under f(T) gravity is marked by coloured lines, and the solid grey line is the relation under GR for reference.
3.2 SIE model
A more general mass model for the lens galaxies is the Singular Isothermal Ellipsoid (SIE). It can be generalized by introducing elliptical coordinates |$\vec{x}^{\prime }=(x_1, fx_2)$|, where f is the axis ratio between the minor and major axis (Kassiola & Kovner 1993; Kormann, Schneider & Bartelmann 1994). We can also write the radial coordinates of the SIE model by |$x^{\prime }\equiv |\vec{x}^{\prime }|=x\Delta (\varphi)$|, with |$\Delta (\varphi)\equiv \sqrt{\cos ^{2}\varphi +f^{2}\sin ^{2}\varphi }$|. Then, the convergence can be written by
The lensing potential can be found by solving the Poisson equation
By solving the Poisson equation (see Appendix for more details), we get the effective SIE lensing potential for f(T) gravity
where |$f^{\prime } = \sqrt{1-f^2}$|. The two components of the deflection angle are
and the shear components are
γ1 and γ2 respectively denote the components of shear along the horizontal and vertical coordinates.
4 GRAVITATIONAL AND PLASMA LENSING EFFECTS
The difference in lensed image position between GR and f(T) is small, making it difficult to distinguish the f(T) theory from a strongly lensed galaxy or Quasi-Stellar Object (QSO). A feasible candidate is the lensed FRB, which has been proposed to study cosmology and fundamental physics (e.g. Dai & Lu 2017; Li et al. 2018a; Chen et al. 2021; Wucknitz, Spitler & Pen 2021). Nevertheless, the propagation of the radio signal is affected by the ionized medium, i.e. plasma, leading to non-negligible plasma lensing effects that introduce intriguing changes (e.g. Tsupko & Bisnovatyi-Kogan 2012, 2014; Er & Mao 2022; Perlick & Tsupko 2023). Thus, to achieve more precise predictions, we investigate the lensing of FRBs within the framework of f(T) theory combined with plasma lensing.
The plasma lensing effect primarily depends on the plasma density (mainly free electrons) and observational wavelength (e.g. Bisnovatyi-Kogan & Tsupko 2015; Cordes et al. 2017; Kumar & Beniamini 2023). The plasma density in the lens galaxy is not well constrained from observation yet. We simply adopt two electron density models on the galactic scale in this work, the power-law and the exponential ones (Mathews & Brighenti 2003; Gutiérrez & Beckman 2010). The parameters of these two plasma density models are shown in Table 1, with further details available in (Er & Rogers 2018). Additionally, we introduce the column-density power-law model for simplicity in our calculations. In Table 1, we summary the expressions of the parameters for three density models. For power-law plasma lens, |$N^{\mathrm{ pl},c}_0$| and |$N^{\mathrm{ pl},v}_0$| are the electron column/volume density at a characteristic radius r = R0 or θ = θR. And we recall that |$\theta \equiv |\vec{\theta }|$| and r ≡ (ξ2 + Z2)1/2. For an exponential plasma lens, |$N^{\mathrm{ exp}}_0$| represents the maximum electron column density within the lens and σ is the angular size of the lens. θ0 represents the characteristic angular scale for plasma lensing, which is an analogy to the Einstein radius in gravitational lensing. λ is the wavelength and re is the classical electron radius. The plasma lensing potential Ψ(θ) and Ψ(x) are given by the projected electron density. In this work, we use the spectral index h > 0 and H > 0. α(θ) is the deflection angle and the α(x) is the dimensionless version scaled by the Einstein radius θE. In the following part, we mark the corresponding parameters for different plasma models with an extra superscript, e.g. |$\alpha _{1}^{\mathrm{ pl},c}$| represents the component of α(x) for the power-law model with column-density along the x-axis.
The expressions of parameters in three plasma lensing models: the column-density power-law model, volume-density power-law model, and exponential model from left to right respectively.
| Column-density power-law lenses | Volume-density power-law lenses | Exponential lenses | |
|---|---|---|---|
| Ne | |$N^{\mathrm{ pl},c}_0 \frac{\theta _R^H}{\theta ^H}$| | |$N^{\mathrm{ pl},v}_0 \frac{{R_0}^h}{r^h}$| | |$N^{\mathrm{ exp}}_0 \mathrm{exp}\left(-\frac{\theta ^h}{h \sigma ^h}\right) \quad$| |
| θ0 | |$\left(\frac{\lambda ^2}{2\pi } \frac{D_{\mathrm{ LS}}}{{D_\mathrm{ S}}{D_{\mathrm{ L}}}} {r_{\mathrm{e}} H N_0^{\mathrm{ pl},c} \theta _R^H}\right)^{\frac{1}{H+2}}$| | |$\left(\lambda ^2 \frac{{D_{\mathrm{ LS}}}}{D_{\mathrm{ S}} D_{\mathrm{ L}}^h} \frac{r_{\mathrm{e}} N_0^{\mathrm{ pl},v} R_0^h}{\sqrt{\pi }} \frac{\Gamma \left(\frac{h}{2}+\frac{1}{2}\right)}{\Gamma \left(\frac{h}{2}\right)}\right)^{\frac{1}{h+1}}$| | |$\lambda \left(\frac{D_{\mathrm{ LS}}}{D_{\mathrm{ S}} D_{\mathrm{ L}}} \frac{1}{2 \pi } r_{\mathrm{e}} N_0^{\mathrm{ exp}}\right)^{\frac{1}{2}}$| |
| Ψ(θ) | |$\frac{1}{H}\frac{\theta _0^{H+2}}{\theta ^H}$| | $$\begin{eqnarray}
\left\lbrace \begin{array}{l}\frac{\theta_{0}^{h+1}}{(h-1)} \frac{1}{\theta^{h-1}}, \quad h \ne 1 \\-\theta _0^2 \ln \theta , \quad h=1 \end{array}\right.
\end{eqnarray}$$ | |$\theta _0^2 e^ {-\frac{\theta ^h}{h \sigma ^h}}$| |
| Ψ(x) | |$\frac{1}{H x^{H}} \left(\frac{\theta _0}{\theta _E}\right)^{H+2}$| | $$\begin{eqnarray}
\left\lbrace \begin{array}{l}\left(\frac{\theta _0}{\theta _\mathrm{ E}}\right)^{h+1} \frac{1}{(h-1)x^{h-1}}, \quad h \ne 1 \\-\left(\frac{\theta _0}{\theta _\mathrm{ E}}\right)^2 \ln (\theta _\mathrm{ E} \cdot x), \quad h=1 \end{array}\right.
\end{eqnarray}$$ | |$\left(\frac{\theta _0}{\theta _\mathrm{ E}}\right)^2 e ^{-\frac{\theta _\mathrm{ E}^h}{h \sigma ^h} \cdot x^h}$| |
| α(θ) | |$-\frac{\theta _0^{H+2}}{\theta ^{H+1}}$| | |$-\frac{\theta _0^{h+1}}{\theta ^h}$| | |$-\theta _0^2 \frac{\theta ^{h-1}}{\sigma ^h} e^{-\frac{\theta ^h}{h \sigma ^h}}$| |
| α(x) | |$-\left(\frac{\theta _0}{\theta _\mathrm{ E}}\right)^{H+2} \frac{1}{x^{H+1}}$| | |$-\left(\frac{\theta _0}{\theta _\mathrm{ E}}\right)^{h+1} \cdot \frac{1}{x^h}$| | |$-x^{h-1} \frac{{\theta _\mathrm{ E}}^{h-2}}{\sigma ^h {\theta _0}^{-2}} e^{-\frac{x^h}{h} \cdot \frac{\theta _\mathrm{ E}^h}{\sigma ^h}}$| |
The plasma clumps at small scales can cause deflection and even dominate the plasma lensing effects. This is difficult to predict and strongly depends on the line of sight. We thus consider the simply smooth model at the current study, i.e. only a plasma lens on galactic scale, and leave the analysis of small scales in future work.
There is coupling between GR and plasma lensing Bisnovatyi-Kogan & Tsupko (2010), also in the f(T) gravity. Such effects are tiny and thus are not included in our calculations. We treat the overall lensing potential as the sum of individual contributions from modified gravity and plasma lensing.
4.1 f(T) & plasma lensing for SIS profile
4.1.1 Power-law plasma lenses
For the SIS model, we take the power-law density for plasma with index h = 2. Such a choice can give the same density profile as the dark matter halo. We introduce the parameter |$b_{\mathrm{ pl}} = (\frac{\theta _0}{\theta _\mathrm{ E}})^{h+1}$| to indicate the strength of plasma lensing. Then, the deflection angle can be written as
From this expression, it is evident that the modification due to f(T) gravity and plasma lensing can be distinguished into the following three cases: when A > bpl, the modification is dominated by f(T) gravity; when A = bpl, the effects of f(T) and plasma cancel out; and when A < bpl, the modification is dominated by the plasma lensing effect.
The time delay is
It consists of the following three components: path deflection, f(T) gravity, and plasma environment, respectively. Dt is defined by Dt ≡ DLDs(1 + zL)/(cDLS). The total magnification μ is a combination of plasma and gravitational lensing effects, which is given by
4.1.2 Exponential plasma lenses
The derivation of exponential plasma with f(T) gravity lensing effects is similar to that of the power-law plasma model. We start from the deflection angle:
We adopt the Gaussian model in this work, i.e. h = 2, and define |$b_{\mathrm{ exp}}\equiv \theta _0^2/\sigma ^2$|. We take the derivative to compare the modification by f(T) and plasma
Unlike the deflection angle caused by f(T) gravity and power-law plasma distribution, which can be simply evaluated by given A and bpl, the deflection angle here shows complicated behaviour. To simplify the calculation, we take σ = θ0 (bexp = 1) as an example. In Fig. 6, we show the deflection angle, where we take A = 10−5, zS = 0.08, zL = 0.01, σv = 200 km s−1, the corresponding θE ≈ 1 arcsec. For plasma, we use |$N_{0}^{\mathrm{ exp}}= 10^3$| pc cm−3. The curves with different colour present the deflection angles at different frequencies, which are 195, 290, and 565 MHz. The corresponding θ0/θE are 0.0305, 0.0205, and 0.0105, respectively. When θ0/θE < 0.0205, the deflection angle is always greater than 1; when θ0/θE = 0.0205, the deflection angle has a minimum value (blue dot) at which the deflection caused by the plasma cancels out the extra deflection by f(T). Then as x increases, the deflection angle exhibits a small peak and then gradually decreases. When θ0/θE > 0.0205 (ν < 290 MHz), the plasma effect becomes more significant, and the deflection angle can be smaller than that of GR.
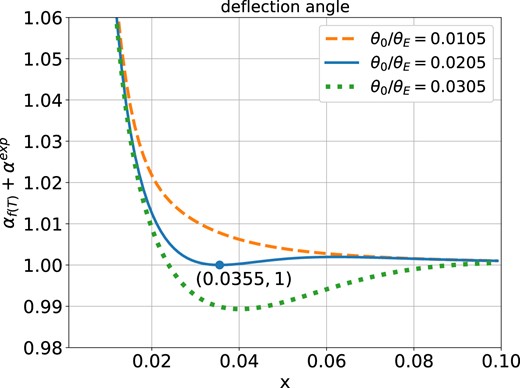
Deflection angle αexp + αf(T) of x with different θ0. The dot marked in the figure is the minimum value of αexp + αf(T) when θ0/θE = 0.0205.
The time delay consists of three components
The total magnification μ is composed of plasma and gravitational lensing effects:
4.1.3 Results
We present the lensing effect of an SIS halo with plasma, including the defection angle, time delay, and magnification in Figs 7 and 8. We adopt the velocity dispersion σv = 250 km s−1 for the galaxy halo. The redshifts of the lens and the source are zL = 0.1 and zS = 0.6, respectively. The parameters of the plasma lens are shown in Table 2. We arbitrary choose a high plasma density to exaggerate the plasma lensing effects.
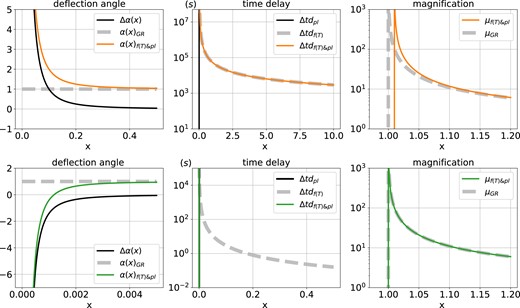
Comparison of lensing effects between f(T) gravity, w/o plasma lensing. SIS halo is used for the mass of the lens, and the power-law model is used for the plasma. The top (bottom) row depicts the quantifies for the f(T) lensing with parameter A = 10−2 (A = 10−8). Δα(x) refers to |$\alpha (x)_{f(T) \& \mathrm{ pl}}-{\alpha (x)}_{\mathrm{ GR}}$|, and |$\Delta \mathrm{ t}\mathrm{ d}_{f(T) \& \mathrm{ pl}}$|, Δtdpl, Δtdf(T) respectively represents the value of |$\mathrm{ t}\mathrm{ d}_{f(T) \& \mathrm{ pl}\mathrm{ }}-\mathrm{ t}\mathrm{ d}_{\mathrm{ GR}}$|, tdpl − tdGR, tdf(T) − tdGR. The horizontal scale of each panel is different for better visibility.
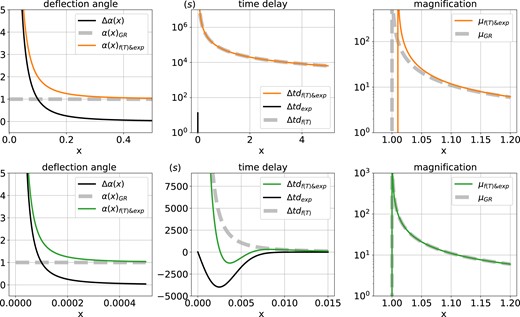
Same as Fig. 7 but for Gaussian plasma density profile. In top (bottom) panel, A = 10−2 (A = 10−8) is used for f(T).
The parameters for the plasma density model, the observational frequency fobs = c/λ. |$N_0^{\mathrm{ pl},v}$| is the volume density of power-law model at |$R_0^{\mathrm{ pl},v}$|.
| fobs | |$N_0^{\mathrm{ pl},v}$| | |$R_0^{\mathrm{ pl},v}$| | |$N_0^{\mathrm{ exp}}$| |
|---|---|---|---|
| 375 MHz | |$10^{-3}\, \mathrm{cm^{-3}}$| | 10 kpc | |$500\, \mathrm{pc\, cm^{-3}}$| |
| fobs | |$N_0^{\mathrm{ pl},v}$| | |$R_0^{\mathrm{ pl},v}$| | |$N_0^{\mathrm{ exp}}$| |
|---|---|---|---|
| 375 MHz | |$10^{-3}\, \mathrm{cm^{-3}}$| | 10 kpc | |$500\, \mathrm{pc\, cm^{-3}}$| |
In Fig. 7, the lensing properties for power-law plasma model are depicted. One can easily understand the difference between the top and bottom panels: the positive Δα(x) is dominated by the f(T) gravity, while the negative one is by plasma. Moreover, the difference becomes greater with smaller x. In the middle panels, we can see the different extra delays induced by the f(T) gravity and plasma. The f(T) gravity leads to a positive extra delay, while the plasma causes a negative extra delay (which cannot be shown in the figure, black, and green solid lines in the bottom middle panels). The reason for that is the plasma reduce the deflection angle, and then the geometric delay. When A is larger than bpl, f(T) dominates the change in time delay (orange solid line in the top middle panel). From the right panels, the size of the critical curves is enlarged mainly by f(T) gravity. The effect of plasma lensing is not significant in the magnification.
In Fig. 8, we change to the exponential plasma model. In both cases (large and small A), the deflection angle is dominated by the f(T) gravity and remains positive, since θ0/θE ≪ 1. The extra time delay by plasma lensing is still negative, but smaller than that of power-law. In the bottom middle panel, we are able to show Δtdexp (black solid line), which show a minimum delay near x ∼ σ. The total time delay |$\Delta \mathrm{ td}_{f(T)\& \mathrm{ exp}}$| (green solid line) is dominated by plasma near x ∼ σ, and by f(T) at the other x. The magnification of the exponential models is similar to that with the power-law profile: the difference is mainly caused by f(T) and becomes significant near x = 1. However, the difference in magnification is small and difficult to distinguish in real observation.
4.2 f(T) & plasma lensing for SIE profile
In a general case, e.g. the SIE halo, it is reasonable to assume that the free electron shares a similar elliptical distribution to the dark matter halo. Therefore, we require the lensing properties of plasma to be similar with that of SIE dark matter halo. Again we generalized the coordinate by |$x^{\prime }\equiv |\vec{x}^{\prime }|=x\Delta (\varphi)$|. One can find the detailed analysis of elliptical plasma lensing in (Er & Rogers 2019).
4.2.1 Power-law plasma lenses
We use the capitalized H for the two-dimensional power index to distinguish that in three dimensions. The free electron density Ne is given by
Thus, the plasma lensing potential is
Here, we define |$B_{\mathrm{ pl}}\equiv \frac{\theta _0^{H+2}}{\theta _\mathrm{ E}^{H+2}}$|, the corresponding plasma lensing deflection angles are
After combining with equation (24), the total dimensionless deflection angle can be expressed as
The shear and convergence for power-law plasma lensing can be given by
4.2.2 Exponential plasma lenses
Similarly, for SIE model, the Ne(x) can be generalized by elliptical coordinate x
Thus, the plasma lensing potential is
Here we define |$B_{\mathrm{ exp}} =\frac{\theta _0^h}{\sigma ^h}$|, for the Gaussian model in this work, i.e. h = 2, the deflection angle reads
with
After combining with equation (24), the total dimensionless deflection angle can be expressed as
And then the shear and convergence for exponential plasma lensing can be given by
and
with
respectively.
4.3 A mock lensed FRB with SIE lens
We adopt a toy lensing model to simulate strongly lensed FRBs and compare them in GR and f(T) gravity. In this section, we take H = 1 for power-law plasma density and h = 2 for the exponential plasma model (Gaussian model). For the power-law plasma lensing, the lensing effects of plasma with column density H = h − 1 are equivalent to the volume density with power index h (Er & Rogers 2019). For the gravitational lens, we take zL = 0.005, zS = 0.012, σv = 250 km s−1, and the ellipticity is taken to be 0.55, which is consistent with the plasma lens. Other parameters related to the plasma lens are shown in Table 3. Different source FRB locations are used for comparison. In Fig. 9, we place the source (yellow stars) on the x1-axis, near the fold, and close to the cusp from top to bottom. There are small differences in lensed images between the GR and f(T) gravity (shown by the red and blue points).
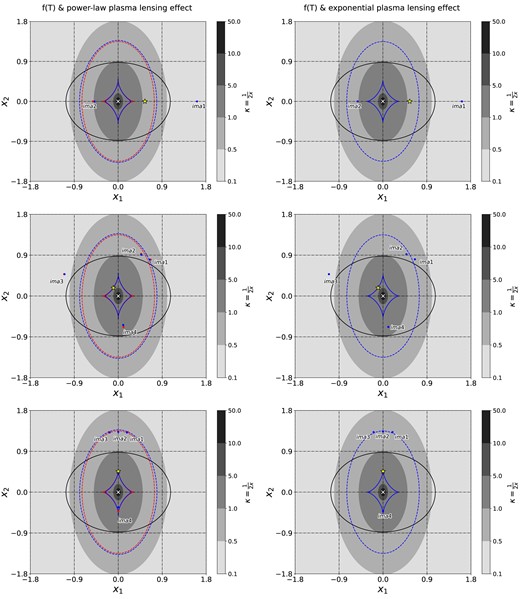
The mocked lensed FRB: in the left (right) panels, the power-law plasma model (Gaussian plasma model) is used. The greyscale indicates the surface mass density κ. The lens is located at the origin (white cross). For both two plasma models, locations of the source (yellow star) are (+0.55, +0.0), (−0.10, +0.18), (0, +0.46) from top to bottom, corresponding to the source located on the horizontal coordinate, near the fold and inside the cusp, respectively. The red and blue dots mark the image positions under GR and f(T) gravity, respectively. The dashed line, the solid line in red (blue) marks the critical curve and caustic under GR gravity (f(T) gravity) with plasma. The solid black line represents the cut for the GR case (as stated above, there is no cut for f(T) gravity lensing effect).
The parameters of plasma density in the SIE lens model.
| f (axis ratio) | fobs | |$R_0^{\mathrm{ pl},c}$| | |$N_0^{\mathrm{ pl},c}$| | |$N_0^{\mathrm{ exp}}$| |
|---|---|---|---|---|
| 0.55 | |$375\,$|MHz | |$8\,$|kpc | |$500\, \mathrm{pc\, cm^{-3}}$| | |$2000\, \mathrm{pc\, cm^{-3}}$| |
| f (axis ratio) | fobs | |$R_0^{\mathrm{ pl},c}$| | |$N_0^{\mathrm{ pl},c}$| | |$N_0^{\mathrm{ exp}}$| |
|---|---|---|---|---|
| 0.55 | |$375\,$|MHz | |$8\,$|kpc | |$500\, \mathrm{pc\, cm^{-3}}$| | |$2000\, \mathrm{pc\, cm^{-3}}$| |
In the left panels of Fig. 9, we have A = 0.001 for f(T) gravity and Bpl = 0.011 for plasma lensing. The critical curve with plasma (blue dashed) is larger and ‘fatter’ than that under GR gravity (red dashed curve). While the blue caustic is thinner in the lateral direction than the red one. The reason is that the potential of plasma lensing has a slightly different ellipticity than that of gravitational lensing (the potential of plasma lensing is proportional to the electron density). The lensed images are closer to the lens with plasma than the GR case. For lensing with exponential plasma model (right panel in Fig. 9), we have A = 10−12, Bexp = 0.0001. The lensed image positions produced by the two theories are indistinguishable. In additional tests with higher electron density, we find more noticeable changes in image positions and shape of caustics as well. When the source located near the caustics, the tiny difference between f(T) and GR can be manifested, from the number of images, the image positions and the magnifications.
In this work, we assume that the electron density distribution is the same as the mass distribution, thus the plasma lensing effect only causes changes in the image position along the radial directions. While f(T) gravity influences the image position in both radial and tangential directions. The changes induced by f(T) gravity mainly depend on the ellipticity of the mass distribution f as well as A (see Appendix for more details).
Although the image positions can be precisely measured, e.g. from VLBI, it is difficult to distinguish the gravity theory from that only, especially due to the degeneracy between plasma and gravity. The magnification can be contaminated by several factors, such as subhaloes, thus is difficult to be calibrated either. However, it is worth noting that time measurements can be achieved with high precision (e.g. Deller et al. 2008; Desvignes et al. 2016; Goldstein et al. 2018). In Table 4, we display the results obtained from our mock lensed FRB with power-law plasma, of which the corresponding image positions are shown in the left column of Fig. 9. In all three examples, we tune the lens parameters (A, Bpl, and source position), in order to obtain the similar or even the same image positions between GR and f(T). From Table 4, we can see that for three pairs of lensing systems, the lensed image positions from both GR and f(T) lens are the same. The magnifications of the images differ among each pair. Especially those near the critical curve, there exists large difference. More importantly, the time delay between multiple images exhibits differences from tens of seconds to hundreds of seconds, which can be easily distinguished by current facilities. In Fig. 10, we present the frequency-delay relation of the two lensed images in Len1 system (top left panel in Fig. 9). For simplicity, we use the image position at 375 MHz, and calculate the arrival time of the signal, i.e. the change of image position due to frequency is not taken into account. In all cases, the extra delay in Fig. 10 are positive, and the delay caused by f(T) is higher than that by GR. The two curves in each panel show different slopes which can be used to distinguish the gravity. For the image 2, which is closer to the lens, the difference in arrival time is larger. For both two images, the green and orange solid and dashed curves converge at low frequencies, where the plasma lensing dominates. Thus, it cannot provide good constraint to the gravity theory. Comparatively, the best frequency range to distinguish the f(T) gravity will be around 400 MHz, where the change of slope is significant. In our simulations, we use extremely high electron density to exaggerate the plasma lensing effects, e.g. the electron density near the image position is ∼105–106 pc cm−3. In a more realistic case, ∼10 pc cm−3, the extra time delay is small, ∼1 s, but the offset between the solid and dashed curve does not change much since that is caused by the f(T) gravity.
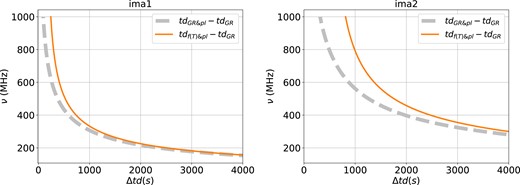
The frequency-delay time relation for the two lensed images in len1 system. The delay time (in unit of second) caused by GR is subtracted for better comparison. An extremely high density is used when producing the figure.
The properties of lensed images. Len1, Len2, and Len3 correspond to the three panels in the left column of Fig. 9, from top to bottom. In each lens, two sets of parameters (|$A\&B_{\mathrm{ pl}}$|) are adopted for comparison. Those with A = 0 corresponds to GR. (y1, y2) – source position, (x1, x2) – image position. The last column is the time delay between multiple images: Δt = ti − t1, where ti is the arrival time of image i.
| Lens | |$A \& B_{\mathrm{ pl}}$| | image | (x1, x2) | (y1, y2) | Magnification | Time delay (s) |
|---|---|---|---|---|---|---|
| Len1 | A = 0 | ima1 | (+1.62, 0) | (0.55, 0.0) | 1.9 | 0 |
| – | Bpl = 0.00873 | ima2 | (−0.48, 0) | – | 1.3 | 64 606 |
| – | A = 0.001 | ima1 | (+1.62, 0) | (0.55, 0.0) | 1.9 | 0 |
| – | Bpl = 0.011 | ima2 | (−0.48, 0) | – | 1.1 | 65 300 |
| Len2 | A = 0 | ima1 | (+0.64, +0.80) | (−0.1, 0.1815) | 46.0 | 0 |
| – | Bpl = 0.00926 | ima2 | (+0.47, +0.91) | – | 9.1 | 3885 |
| – | – | ima3 | (−1.10, +0.48) | – | 3.0 | −10 861 |
| – | – | ima4 | (+0.10, −0.64) | – | 0.8 | 18 489 |
| – | A = 0.001 | ima1 | (+0.64, +0.80) | (−0.1, 0.18) | 89.8 | 0 |
| – | Bpl = 0.011 | ima2 | (+0.47, +0.91) | – | 8.5 | 3779 |
| – | – | ima3 | (−1.10, +0.48) | – | 3.1 | −10 995 |
| – | – | ima4 | (+0.10, −0.64) | – | 0.8 | 18 846 |
| Len3 | A = 0 | ima1 | (0.18, 1.32) | (0.0, 0.4615) | 71.3 | 0 |
| – | Bpl = 0.01034 | ima2 | (0, 1.33) | – | 28.5 | 575 |
| – | – | ima3 | (−0.18, 1.32) | – | 71.3 | 0 |
| – | – | ima4 | (0, −0.33) | – | 0.19 | 54 160 |
| – | A = 0.001 | ima1 | (0.18, 1.32) | (0.0, 0.46) | 59.6 | 0 |
| – | Bpl = 0.011 | ima2 | (0, 1.33) | – | 26.8 | 562 |
| – | – | ima3 | (−0.18, 1.32) | – | 59.6 | 0 |
| – | – | ima4 | (0, −0.33) | – | 0.17 | 54 298 |
5 SUMMARY
In this study, we investigate the gravitational lensing effects within the framework of f(T) gravity, in particular for the SIS and SIE mass models. Our findings reveal that in f(T) gravity, for both mass models, the deflection angle is greater than that in GR. This phenomenon becomes significant when the source and lens are well aligned. We show the parameter region of possible detection of image positions for the SIS model as shown in Fig. 1. In the gravitational lensing effect, the term ‘Cut’ refers to the position where the number of images changes due to the changes in source position. In the SIS model, GR generates either one or two images. Whereas in f(T) gravity, there are always two images. As depicted in Fig. 5, when the source lies outside the GR’s ‘Cut’, f(T) gravity generates one image close to the result of GR while the other is close to the lens centre and de-magnified. Similarly, in the SIE model, the ‘Cut’ is also absent. And since the change in the number of images is influenced by the position of the source with respect to the critical curve and caustic, the specific result depends on the parameter of f(T) gravity, |$\boldsymbol {\mathring{\alpha }}$|. For both SIS and SIE models, the critical curve generated by f(T) gravity will be larger than that by GR, and the exact distortion depends on the value of |$\boldsymbol {\mathring{\alpha }}$|.
In most cases, the difference between GR and f(T) is tiny. Although radio facilities allow for precise measurements of image positions, the degeneracy between modified gravitational lensing and plasma lensing hinders us to differentiate f(T) theory from GR. Other lensing signatures, such as magnification and time delay, are essential. FRBs are bright radio sources with milli-seconds duration and are able to provide unprecedented high precision in the time delay measurement. However, since ionized interstellar medium exists generally in galaxies, the plasma lensing effects cannot be neglected when we study the lensed FRBs. We perform toy simulations of lensed FRBs including both gravitational and plasma lensing, and compare the lensing effects between GR and f(T) theory. Plasma lensing can cause negative deflection angle and change all the lensing effects. In some particular cases, e.g. axis-symmetric model and some specific radial profiles, the plasma can compensate the change by f(T) gravity (see equation 26 and Fig. 6 for SIS model and Table 4 for SIE model). But in general, the difference caused by f(T) gravity shows distinguish behaviours. In our simulations, we specifically select our lensing properties and source position to have similar or even exact same image positions produced by GR and f(T) gravity for three different cases: source is on the horizontal axis, near the fold and inside the cusp. In all three cases, we find significant differences in magnification and time delays. In additional tests with different plasma models, similar discrepancies can be found. Therefore, we expect that there is a possibility to examine the gravity theory through strongly lensed FRBs, even with the influence of plasma, although accurate lens modelling and time delay measurement are necessary.
In summary, our research centred on the analysis of gravitational lensing effects within the framework of f(T) gravity, taking the additional influence of plasma into account, particularly in the context of lensed FRBs. Our findings suggest that it is possible to test and differentiate gravitational theories through strongly lensed FRBs. However, our models are far more simple in several aspects. For instance, we only consider the macro lensing model. The substructures, and more importantly the microlensing effects are not taken into account (e.g. Chen et al. 2021). Given the small physical size of FRBs, the microlensing effects are expected to be large and non-negligible. The free electrons along the light of sight, e.g. in the Milky Way, host galaxy, or intergalactic medium, can cause perturbations as well, thus the real observational data will contain more structures and lead to further degeneracy or bias. Even the lens model of the whole galaxy, large uncertainty still exists. Some of observed signatures that discussed in this work can be attributed to either f(T) gravity or the mass profile of the lens, e.g. a slightly different power index. Additionally, in the context of f(T) gravity, the ‘isothermal’ halo profile can diverge from a power law with index of −2, and that is beyond the scope of this work. On top of that, so far there is not a single strongly lensed FRB that has been confirmed. How to search for and identify the lensed FRB events will be a more interesting and important question at the moment. On the other hand, in order to test gravity, a strong field will be a better laboratory, e.g. near black hole (e.g. Perlick & Tsupko 2022). Thus the shadow of a black hole can provide even stringent constraints to the gravity theory.
ACKNOWLEDGEMENTS
We would like to thank the referee Prof. Marek Biesiada for valuable comments on the draft. We thank Prof. Alessandro Sonnenfeld, Emmanuel Saridakis, and Yaqi Zhao for their helpful discussions. XE was supported by the National Natural Science Foundation of China Grant No. 11933002, and the China Manned Space Project with No. CMS-CSST-2021-A07 and No. CMS-CSST-2021-A12. Y-FC was supported in part by National Key Research and Development Program of China (2021YFC2203100), by Chinese Academy of Sciences Young Interdisciplinary Innovation Team (JCTD-2022-20), by National Natural Science Foundation of China (12261131497), by 111 Project for ‘Observational and Theoretical Research on Dark Matter and Dark Energy’ (B23042), by Fundamental Research Funds for Central Universities, by China Scholarship Council Innovation Talent Funds, by University of Science and Technology of China Fellowship for International Cooperation, by University of Science and Technology of China Research Funds of the Double First-Class Initiative.
DATA AVAILABILITY
The data underlying this article will be shared on reasonable request to the corresponding author.
Footnotes
References
APPENDIX: SIE LENSING POTENTIAL UNDER F(T) GRAVITY
We simply present how we solve the lens equation to obtain the lens potential in f(T). ΨGR stands for the gravitational potential of GR, while Ψδ represents the gravitational potential difference term between f(T) and GR.
Thus the Poisson equations read
Since x and φ are not coupled, we have
We already know the solution for |$\tilde{\Psi }_{\mathrm{ GR}}$| is
Same as |$\tilde{\Psi }_{\mathrm{ GR}}$|, we used Green’s function method for |$\tilde{\Psi }_{\delta }$|,
and Green’s function can be constructed as
θ(x) is the step function, W is the Wronskian of |$\hat{\phi }_{+}$| and |$\hat{\phi }_{-}$|,
Combining the two equations above, the solution for |$\tilde{\Psi }_{\delta }$| is
For homogenoeous equation of |$\tilde{\Psi }_{2}$|, we write
Thus,
Taking the solution back to the original Poisson equation, |$g(x) = \frac{1}{x}$|,
