


ABSTRACT
We present a tomographic analysis of metal absorption lines arising from the circumgalactic medium (CGM) of galaxies at z ≈ 0.5–2, using Multi Unit Spectroscopic Explorer (MUSE) observations of two background quasars at z ≈ 2.2 and 2.8, which are two of the few currently known quasars with multiple images due to strong gravitational lensing by galaxy clusters at z ≈ 0.6 and 0.5, respectively. The angular separations between different pairs of quasar multiple images enable us to probe the absorption over transverse physical separations of ≈0.4–150 kpc, which are based on strong lensing models exploiting MUSE observations. The fractional difference in rest-frame equivalent width (ΔWr) of Mg ii, Fe ii, and C iv absorption increases on average with physical separation, indicating that the metal-enriched gaseous structures become less coherent with distance, with a likely coherence length-scale of ≈10 kpc. However, ΔWr for all the ions vary considerably over ≈0.08–0.9, indicating a clumpy CGM over the full range of length-scales probed. At the same time, paired Mg ii absorption is detected across ≈100–150 kpc at similar line-of-sight velocities, which could be probing cool gas clouds within the same halo. No significant dependence of ΔWr is found on the equivalent width and redshift of the absorbing gas and on the galaxy environment associated with the absorption. The high-ionization gas phase traced by C iv shows a higher degree of coherence than the low-ionization gas phase traced by Mg ii, with ≈90 per cent of C iv systems exhibiting ΔWr ≤ 0.5 at separations ≤10 kpc compared to ≈50 per cent of Mg ii systems.
1 INTRODUCTION
By regulating the flow of baryons in and out of galaxies, the circumgalactic medium (CGM) plays a vital role in galaxy evolution (Tumlinson, Peeples & Werk 2017). On one hand, pristine gas is accreted from the large-scale structures through the CGM on to the galaxy, while on the other hand, star formation and nuclear activity in the galaxy drive metal-enriched outflows into the CGM. The expelled metals either fall back on to the galaxy or spread in the intergalactic medium. Studying the distribution and mixing of metals around galaxies is therefore crucial to understanding the star formation history and chemical enrichment of galaxies (Péroux & Howk 2020).
Due to its low density, the CGM has been most effectively probed in absorption against bright background sources such as quasars. Large surveys have statistically mapped the distribution of metal absorption lines around galaxies across different gas phases and redshifts (e.g. Tumlinson et al. 2011; Nielsen, Churchill & Kacprzak 2013; Turner et al. 2014; Dutta et al. 2020, 2021; Galbiati et al. 2023). Ionization modelling of absorption line systems has been used to place constraints on the average physical conditions of the gas clouds such as metallicity, density, and size (e.g. Werk et al. 2014; Fumagalli, O’Meara & Prochaska 2016; Haislmaier et al. 2021; Sameer et al. 2021; Zahedy et al. 2021; Lofthouse et al. 2023), albeit these estimates are subject to the model assumptions.
The major limitation of absorption line studies is that they probe the gas only along a pencil-beam sightline towards the background point source and hence cannot directly map the spatial distribution of the gas. In contrast, spatially resolved emission can directly map the extent and morphology of the gas around galaxies. However, due to its low-surface brightness, the CGM has been challenging to detect in emission at cosmological distances. Now, thanks to sensitive integral field unit (IFU) spectrographs, such as the Multi Unit Spectroscopic Explorer (MUSE; Bacon et al. 2010) on the Very Large Telescope, it is becoming possible to detect extended Ly α emission (e.g. Borisova et al. 2016; Leclercq et al. 2017; Arrigoni Battaia et al. 2019; Fossati et al. 2021), and metal-line emission (e.g. Burchett et al. 2021; Zabl et al. 2021; Leclercq et al. 2022; Dutta et al. 2023) around galaxies, although individual detections of metal-line emission from the CGM are still only a handful and limited to the inner, most dense, CGM.
Alternative approaches to study the spatial extent and coherence scale of the CGM have been to use quasar pairs, gravitationally lensed quasars and arcs, and extended background galaxies. Absorption lines detected towards close quasar pairs have been used to measure the physical extent of the metal-enriched CGM using transverse clustering analysis over hundreds of kpc (e.g. Hennawi & Prochaska 2007; Martin et al. 2010; Rubin et al. 2015; Mintz et al. 2022). Multiple images of gravitationally lensed quasars have been used to study the structure of the absorbing gas on smaller length-scales of few kpc (e.g. Rauch, Sargent & Barlow 2001; Chen et al. 2014; Zahedy et al. 2016; Rubin et al. 2018; Kulkarni et al. 2019; Augustin et al. 2021). Estimates of the coherence length-scale, i.e. the length-scale over which absorption does not vary significantly, from these studies suggest that the high-ionization gas phase is more coherent and spread out than the low-ionization gas phase. Recently, it has become possible to probe the absorbing gas over an extended region at sub-kpc scales using MUSE observations of background lensed arc images and extended galaxies (e.g. Lopez et al. 2018; Péroux et al. 2018; Tejos et al. 2021). These studies have found that the distribution of metals around individual galaxies is similar to that around statistical samples of galaxies, and that there are indications of metals being mixed efficiently on kpc-scales in the CGM.
However, systems in which tomographic studies can be conducted are rare, and the structure of the CGM at different length-scales is still poorly constrained. It is, therefore, important to expand the sample of systems in which one can spatially map the metal-enriched gas. In this work, we study the metal absorption towards multiple images of two background quasars that are gravitationally lensed by galaxy clusters. Thanks to strong gravitational lensing (magnification ≈2.5–17), the MUSE spectra of the multiple quasar images are among the ones with the largest equivalent exposure times (≈30–1400 h) available to date. Unlike most lensed quasar studies that typically probe smaller physical separations (≲20 kpc), the angular separations (≈2–22 arcsec) between the different pairs of quasar images studied here enable us to probe the absorbing gas over a wide range of physical separations, ≈0.4–150 kpc. The MUSE spectroscopic observations of these two fields enable constructing an accurate lens mass model and, consequently, accurate estimates of the physical separation between quasar sightlines at the absorber redshifts. We use the Mg ii and Fe ii absorption lines to study the coherence of the low-ionization gas phase and the C iv absorption lines to study the coherence of the high-ionization gas phase. Furthermore, the MUSE observations of the two lensed systems allow us to study the association of metal absorption with nearby galaxies.
The paper is structured as follows: We provide a brief overview of the observations used in this work in Section 2. The results on the correlation of metal absorption lines between different quasar sightlines and on the connection with galaxies are presented in Section 3. We discuss and summarize the results in Section 4. We adopt a Flat Λ cold dark matter cosmology with H0 = 70 km s−1 Mpc−1 and ΩM = 0.3, and express all distances in physical units.
2 OBSERVATIONS & ANALYSIS
The fields Sloan Digital Sky Survey (SDSS) J1029+2623 (J1029 hereafter) and SDSS J2222+2745 (J2222 hereafter) were observed with MUSE for 4.8 and 4.4 h on target, respectively [PID: 0102.A-0642(A), 0103.A-0554(A); P.I.: C. Grillo]. The observations took place between 2019 March and July. Based on the analysis of the MUSE Analysis of Gas around Galaxies survey (Lofthouse et al. 2023), which consists of similar exposure times, we estimate the MUSE data to have a 90 per cent photometric completeness limit of r ≈ 26 mag for point sources, and a 90 per cent spectroscopic flux completeness limit of ≈3 × 10⁻¹⁸ |$\rm erg\, s^{-1}\, cm^{-2}$| at 5000 Å for point sources. The data were reduced using the European Southern Observatory (ESO) pipeline (Weilbacher et al. 2020) following standard procedures. The sky subtraction was performed using the Zurich Atmosphere Purge (Soto et al. 2016). Further details of the data reduction are provided in Acebron et al. (2022a, b). The wavelength coverage of the MUSE data is ≈4750–9350 Å, and the spectral resolution is ≈2000–3000.
The sources are detected based on the Hubble Space Telescope (HST) WFC3/F814W image using SExtractor (Bertin & Arnouts 1996). The HST observations and data reduction are described in Oguri et al. (2013) and Sharon et al. (2017). The one-dimensional spectra of the sources detected in HST were extracted from the MUSE cubes within a circular aperture of radius 0.8 arcsec, similar to the full-width at half-maximum of the point spread function. The redshifts of the sources were estimated by cross-matching the spectra with different spectral templates and emission lines. In this work, we consider the galaxies with reliable redshifts (quality flag ≥2; Acebron et al. 2022a, b).
The left panel of Fig. 1 shows the MUSE image of the field J1029. This field contains three multiple images (A, B, C) of a quasar at zQSO = 2.1992 that is lensed by a galaxy cluster at zlens = 0.588. The angular separation between the quasar images ranges from 1.9 to 22.5 arcsec. The MUSE spectra of the three quasar multiple images are shown in the right panel of Fig. 1.
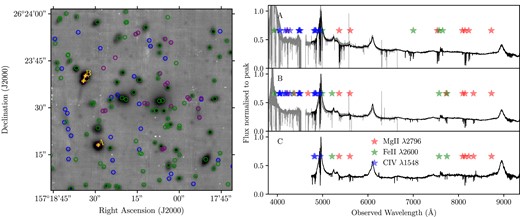
Left: MUSE white light image of the field J1029. The three multiple images, A, B, and C, of the quasar are marked with ‘ + ’. The blue circles identify all the sources detected in the HST F814W image, the green circles denote the sources that have reliable spectroscopic redshifts, and the purple circles indicate the multiple imaged sources. Right: Spectra of the three quasar multiple images extracted from the MUSE cube. The UVES spectra are also shown for images A and B in grey. The stars mark the Mg ii λ2796 (red), Fe ii λ2600 (green), and C iv λ1548 (blue) absorption lines detected in the spectra.
In addition to the MUSE spectra, archival [PID: 092.B-0512(A)] Ultraviolet and Visual Echelle Spectrograph (UVES) spectra are available for the multiple images A and B of the quasar J1029. The UVES observations were performed from 2014 January to February. The reduced UVES spectra were obtained from the ESO archive. The individual exposure spectra were combined by interpolating to a common wavelength array and weighting each flux pixel by the inverse variance. The wavelength coverage of the final spectrum is ≈3300–6600 Å, and the spectral resolution is ≈30 000. The UVES spectra of the quasar multiple images A and B, along with the MUSE spectra, are shown in the right panel of Fig. 1.
The field J2222 (see left panel of Fig. 2) contains six multiple images (A, B, C, D, E, F) of a background quasar at zQSO = 2.801 that is lensed by a galaxy cluster at zlens = 0.489. The quasar images D, E, and F are contaminated by the light from nearby bright cluster members in the MUSE data, and their one-dimensional spectra cannot be utilized for an absorption line analysis. This work exploits the spectra of the quasar images A, B, and C (see right panel of Fig. 2). The angular separation between these images ranges from 4 to 15 arcsec.
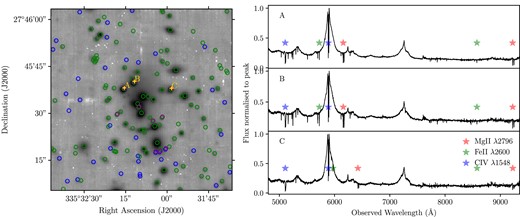
Same as in Fig. 1 for the field J2222.
All the MUSE and UVES quasar spectra were converted into the heliocentric frame and vacuum wavelength for the analysis. For the identification and analysis of absorption lines, the continuum normalization of the quasar spectra was carried out by spline fitting using linetools. The signal-to-noise ratio per pixel of the MUSE quasar spectra ranges between ≈30 and ≈90 around 7000 Å, and that of the UVES quasar spectra is ≈20 around 5000 Å.
3 RESULTS
3.1 Metal absorption across two quasar sightlines
We identified all the metal absorption lines, such as Mg ii, Mg i, Fe ii, C iv, and Si iv, in each of the quasar normalized spectra redward of the quasar Ly α emission line. The Mg II, Fe II, and C IV systems identified in the different quasar image spectra are listed in Appendix A (Tables A1, A2 and A3 for J1029, and Tables A4, A5, A6 for J2222) and also marked on top of the quasar spectra shown in the right panels of Figs 1 and 2. We estimate the optical depth-weighted median redshift and rest-frame equivalent width of the absorption lines. We note that in the case of J1029, the UVES spectra of the quasar multiple images A and B provide coverage of the Mg ii and Fe ii lines at the redshift of the lens cluster, z ≈ 0.588. However, we do not detect any absorption from the cool low-ionization gas (rest equivalent width of Mg ii ≤ 0.05 Å) at the redshift of the cluster. For both quasars, C iv absorption is detected at the quasar redshift towards all the multiple images. However, we do not include the intrinsic absorption in the following analysis.
For each quasar, we search for counterpart absorbers within ±500 km s−1 towards the different images. For context, the escape velocity at the virial radius for a galaxy group at z = 1 with halo mass, |$\rm \mathit{ M}_{\rm h}$| ≈ 1013 |$\rm M_\odot$|, is ≈500 km s−1. In most cases, the absorber pairs lie within ±100 km s−1 of each other. Some examples of absorption lines detected across the multiple quasar sightlines are shown in Fig. 3. We find 20 Mg ii absorber pairs and 10 Fe ii absorber pairs over z ≈ 0.5–2.3, and 18 C iv absorber pairs over z ≈ 1.6–2.3. For similar redshift, line-of-sight velocity window, and equivalent width limits (0.01 Å for Mg ii and 0.05 Å for C iv), and based on the observed number density of Mg ii and C iv absorbers (Mathes, Churchill & Murphy 2017; Hasan et al. 2020), we expect to detect at random ≈0.6 Mg ii and ≈1.4 C iv absorber pairs, respectively, across two quasar sightlines.
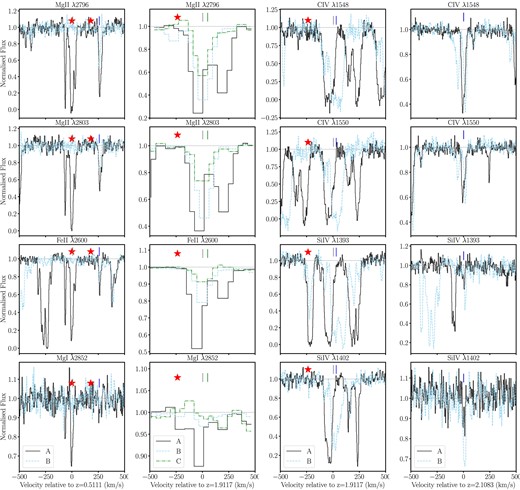
Examples of absorption lines detected towards the different multiple images, A, B, and C, of the quasar J1029. The corresponding ion is indicated at the top of each panel. The second column shows the normalized MUSE spectra of the multiple images A (black solid lines), B (blue dashed lines), and C (green dot–dashed dashed lines). The other columns show the normalized UVES spectra of the quasar images A (black solid lines) and B (blue dashed lines), respectively. The optical depth-weighted median redshifts of the absorbers are marked by vertical ticks (grey for A, blue for B, green for C). The relative velocities of the galaxies identified in MUSE are marked by red stars.
To quantify the variation in absorption across two different sightlines (X and Y), we estimate the fractional difference in the rest-frame equivalent width for each absorber pair as,
where |$W_\mathrm{ r}^X \gt W_\mathrm{ r}^Y$|. In case of non-detection in one of the sightlines, we estimate the 3σ upper limit on the equivalent width at the same redshift as the absorber along the other sightline, for a velocity width of 100 km s−1 (typical of Mg ii absorbers at these redshifts; e.g. Dutta et al. 2020) using the signal-to-noise ratio.
To compute the transverse physical separation between two sightlines, we first ray-trace the positions of the quasar multiple images to the absorber redshifts using the best-fitting lens models presented in Acebron et al. (2022a, ES-Model and 2022b, Model 1). For further details on these lens models, we refer to the above papers. Using the best-fitting predicted positions of the quasar multiple images at different redshifts, we estimate the physical separation between the sightlines in the absorber plane. The uncertainties in the physical separation, at the median redshift of ≈1.8 of the sample, due to uncertainties in the lens modelling, range from ≈0.4 to ≈1 kpc with an average of ≈0.8 kpc for J1029, and from ≈0.8 to ≈4 kpc with an average of ≈3 kpc for J2222. The fractional difference in equivalent width as a function of the physical separation for the Mg ii λ2796, Fe ii λ2600, and C iv λ1548 intervening absorption lines are shown in Fig. 4.
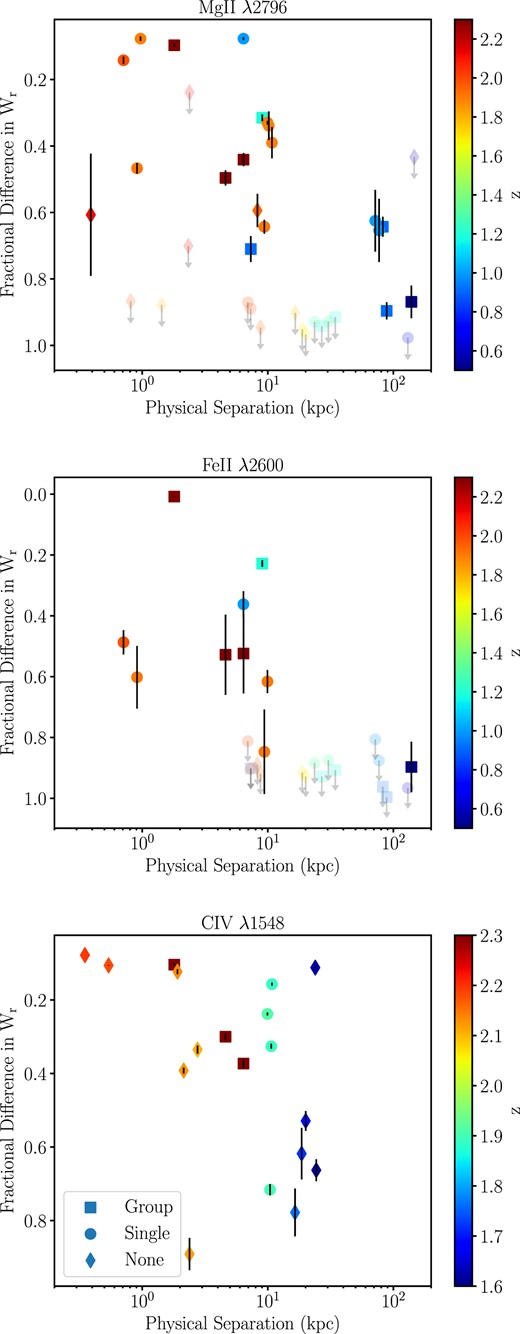
The fractional difference in equivalent width of Mg ii (top), Fe ii (centre), and C iv (bottom) absorbers as a function of physical separation between two quasar multiple images. The markers are coloured by the redshift of the absorbers. Square, circle, and diamond markers indicate groups, single, and no galaxies within ±500 km s−1 of the absorber redshift in the MUSE field-of-view, respectively.
In the case of the Mg ii and Fe ii absorber pairs, we are able to probe over a large range of transverse physical separations, ≈0.4–150 kpc, while we probe up to ≈25 kpc separations for the C iv absorber pairs. The fractional difference in equivalent width, ΔWr, shows a positive correlation with the physical separation. Considering the detections, for Mg ii, the Spearman rank order correlation coefficient is rs = 0.58, and the probability of the correlation arising by chance or p-value = 0.007, for Fe ii, rs = 0.55, p-value = 0.09, and for C iv, rs = 0.49, p-value = 0.04, with similar results obtained considering the limits as detections. This increasing trend of ΔWr with physical separation indicates that, as expected, the metal absorption becomes less spatially coherent over larger separations. We highlight specifically a transition around physical separation of ≈10 kpc, particularly for Mg ii and Fe ii, beyond which the fractional difference shows a considerable drop. Based on this we suggest a coherence length-scale of ≈10 kpc for the metal-enriched gas around galaxies.
However, as can also be seen from Fig. 4, there is a considerable scatter in ΔWr (ΔWr ranges from ≈0.08 to ≈0.9) over the full range of physical separations, suggesting large variations in the spatial coherence. Particularly for Mg ii, we see non-detections of paired absorption over almost the full range of physical separation probed. On the contrary, C iv absorption is always detected in both sightlines, albeit we probe up to only ≈25 kpc in this case. On average, the high-ionization gas phase shows a slightly higher level of coherence than the low-ionization gas phase, with C iv systems showing average ΔWr ≈ 0.3 compared to average ΔWr ≈ 0.4 for Mg ii systems, and ΔWr ≈ 0.5 for Fe ii systems, at a separation of less than 25 kpc.
Fig. 5 shows the fractional difference in the equivalent width of the metal absorbers as a function of the equivalent width of the stronger absorber in a pair. We do not find any significant dependence of ΔWr on the equivalent width for Mg ii, Fe ii, and C iv absorbers, suggesting that coherence is independent of the absorption strength. Additionally, we do not find any significant dependence of ΔWr on the absorber redshift. This indicates that the correlation found between metal absorption in this sample is primarily driven by the physical separation between the sightlines.
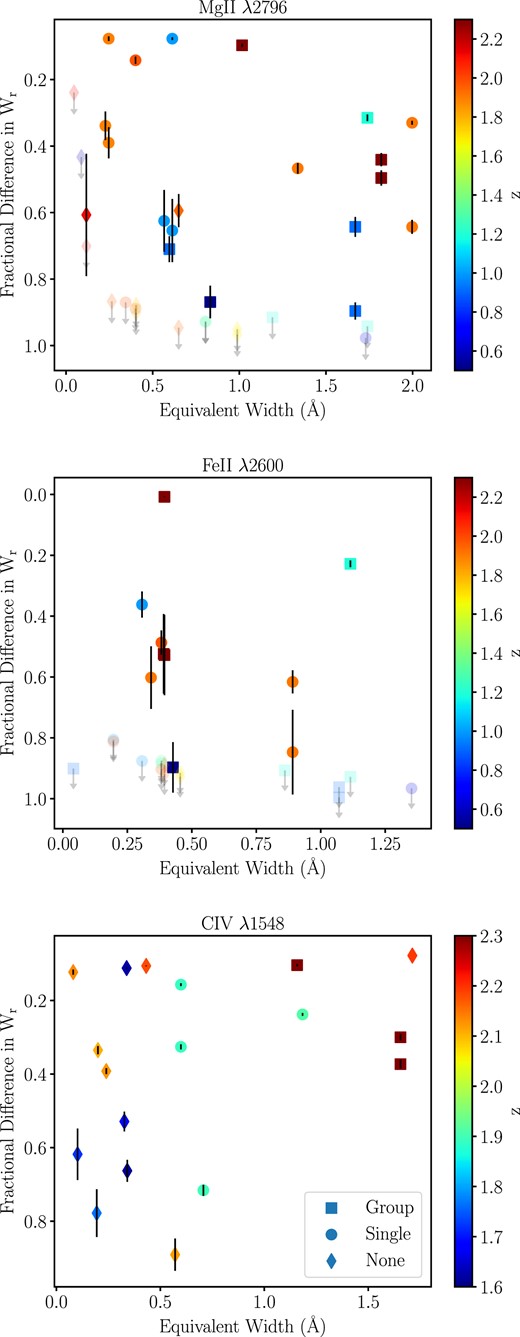
The fractional difference in equivalent width of Mg ii (top), Fe ii (centre), and C iv (bottom) absorbers as a function of the equivalent width of the stronger absorber in a pair. The symbols are the same as in Fig. 4.
To further investigate the coherence of the metal absorption as a function of physical separation, we plot in Fig. 6 the incidence of ΔWr ≤ 0.5 in three different physical separation bins, 0–10, 10–50, and 50–150 kpc. We consider the 3σ limits as detections for this analysis, however, the relative trends do not change if we consider only the detections. The trends also remain similar when considering variations on the separation bins and coherence levels.
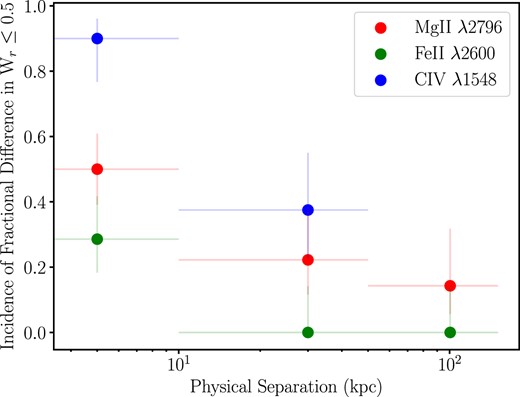
Incidence of fractional difference in equivalent width less than 0.5 as a function of the physical separation. Red, green, and blue markers show the incidence for Mg ii, Fe ii, and C iv absorbers, respectively. The vertical bars show 1σ Wilson score confidence intervals on the incidence. The range in physical separation included in each bin is shown by the horizontal bars.
Consistent with the results from Fig. 4, the incidence decreases with increasing physical separation for the Mg ii, Fe ii, and C iv absorbers. The drop in incidence by a factor of ≈2 at separations larger than 10 kpc further supports this length-scale being a characteristic coherence scale. C iv absorbers show the highest incidence of coherence, with about 90 per cent of absorbers having ΔWr ≤ 0.5 at separations ≤10 kpc, and ≈40 per cent having ΔWr ≤ 0.5 over 10–50 kpc separation. This sample lacks sightline pairs that probe C iv at larger separations. Mg ii absorbers exhibit a factor of two lower incidences than C iv, and a factor of two higher incidences than Fe ii at separations less than 10 kpc. About 50 per cent of the Mg ii absorbers have ΔWr ≤ 0.5 at separations ≤10 kpc, and the fraction drops to ≈22 per cent at 10–50 kpc, and ≈14 per cent at 50–150 kpc. The presence of paired Mg ii absorption, even at large separations, could represent coherent structures composed of cool gas clouds extending over an area of several tens of kpc2. However, detailed comparison of the chemical composition and kinematic structure of the absorption is required to confirm this.
3.2 Metal absorption across three quasar sightlines
Taking advantage of the presence of three quasar multiple images in each of the fields, we next look at the coherence of metal absorption across three different sightlines. Same as when searching for paired absorption in the previous section, we search for absorbers that are detected in all three quasar sightlines within ±500 km s−1 of each other along the line-of-sight direction. We find in total five Mg ii absorber triplets, two Fe ii absorber triplets, and three C iv absorber triplets. For comparison, we expect to detect ≈0.005 and ≈0.03 Mg ii and C iv absorber triplets, respectively, in three random quasar sightlines for the above velocity window and median redshift of the sample, based on the observed number density of Mg ii and C iv absorbers (Mathes, Churchill & Murphy 2017; Hasan et al. 2020).
Similar to the analysis in Section 3.1, we quantify the variation in absorption across the three different sightlines (X, Y, and Z) by estimating the fractional difference in equivalent width or ΔWr for each pair of sightlines, XY, XZ, and YZ. The minimum and maximum of the ΔWr estimates among the three pairs are plotted as a function of the corresponding physical separation in Fig. 7. Given the limited sample size, we consider ΔWr of all three ions together for the below discussion.
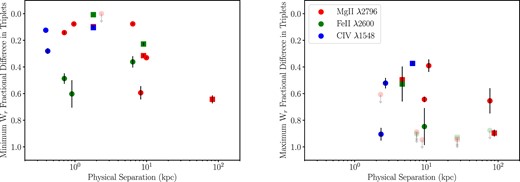
The minimum (left) and maximum (right) fractional difference in equivalent width of Mg ii (red), Fe ii (green), and C iv (blue) absorbers between two quasar multiple images in a triplet system as a function of the physical separation between the images. Square and circle markers indicate that the absorption system is associated with group and single galaxies, respectively.
If absorption of similar strength was present across all three sightlines, then the minimum and maximum ΔWr distributions would have been similar. Instead we find that the distributions are significantly different, with the minimum ΔWr being ≈0.2 on average, and the maximum ΔWr being ≈0.8 on average. A two-sample Kolmogorov–Smirnov (KS) test gives the maximum difference between the cumulative distributions of the two samples as D = 0.8 with a p-value of 3 × 10⁻⁵. Moreover, the minimum ΔWr occurs between sightlines with smaller physical separations (median of ≈2 kpc) compared to the maximum ΔWr (median of ≈9 kpc). The distributions of the two physical separations are also different based on a KS test (D = 0.5, p-value = 0.01).
The above tells us that typically metal absorption of similar strength are detected across two close (≲10 kpc) quasar sightlines, and when detected towards a third sightline further apart, the metal absorption strength changes significantly. In other words, consistent with the results found in Section 3.1, the metal absorption becomes less coherent with increasing physical separation. Combining the minimum and maximum ΔWr estimates, there is a clear correlation of ΔWr with physical separation (rs = 0.57, p-value = 5 × 10⁻⁴).
3.3 Association of galaxies and metal absorption
When studying the galaxy-diffuse gas connection, the advantage of MUSE IFU data is that they allow us to simultaneously study the galaxy environment around the gas detected in absorption towards the quasar multiple images. Having investigated the coherence of metal absorption lines across the multiple quasar images, we look next at how the absorption is connected to galaxies. To do this, we search for galaxies within ±500 km s−1 of the absorber redshift in the MUSE field-of-view (≈500 × 500 kpc2 at z ≈ 1).
In Figs 4 and 5, the different markers indicate whether the absorber pair detected across two quasar sightlines is associated with a single, more than one, or no galaxies. For almost all the Mg ii (90 per cent) and Fe ii (100 per cent) absorber pairs, there is at least one galaxy counterpart detected in MUSE. About 40 per cent and 50 per cent of the Mg ii and Fe ii absorber pairs are associated with more than one galaxies (loosely termed as groups henceforth), respectively. For only about 40 per cent of the C iv absorber pairs, we are able to identify galaxies. This is because at the redshifts of the C iv absorbers (z ≈ 1.5–2) that can be detected redward of the quasar Ly α forest, it is typically challenging to identify galaxies due to the lack of strong emission lines in the optical wavelengths. When metal absorption is detected across all three quasar sightlines, we find that there is always at least one associated galaxy, with ≈60 per cent of the systems being associated with a single galaxy, and rest with a group of galaxies (Fig. 7).
There appears to be no significant difference between groups and single galaxies regarding the distribution of the fractional difference in the equivalent width of the associated metal absorption, albeit the sample sizes are statistically small. For the Mg ii absorber pairs, which have the largest sample size, we estimate the incidence of ΔWr ≤ 0.5 similar to Fig. 6, but for groups and single galaxies separately, in two physical separation bins, 0–10 and 10–150 kpc. We do not find any significant difference in the incidence between Mg ii absorbers associated with groups and single galaxies. However, given the small sample sizes, which hinder controlling for other parameters such as physical separation and redshift, it is difficult to derive any physical implication from the above.
Furthermore, we combined all the Mg ii absorbers detected towards the different quasar multiple images and looked at how they are distributed around the associated galaxies (i.e. those within ±500 km s−1 and in the MUSE field-of-view). Fig. 8 shows the locations of the Mg ii absorbers around the isolated and group galaxies, and also around the geometric centre of the groups. We again do not find any significant difference in the distribution of the Mg ii absorbers around groups and single galaxies. Although, the range of physical distances probed around the single and group galaxies is quite different, making a direct comparison challenging.
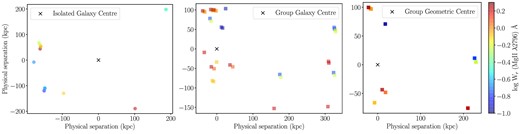
The locations of the Mg ii absorbers around the isolated galaxies (left), group galaxies (centre), and geometric centre of the groups (right). The x and y axes are the physical separations in RA and Dec, respectively, with respect to the galaxy/group in the absorber plane. The markers are coloured by the equivalent width of the Mg ii absorbers.
4 DISCUSSION AND SUMMARY
Spectra of multiple images of strongly lensed quasars offer the opportunity to tomographically map the foreground absorbing gas. In this work, we leverage the recent MUSE observations of two fields containing multiple images of quasars (z ≈ 2.2, 2.8), that are strongly lensed by galaxy clusters (z ≈ 0.5, 0.6), to study the foreground metal absorption. Thanks to the boost from the magnification effect (median magnification of the multiple quasar images ≈2.5–17; Acebron et al. 2022a, b), the MUSE effective integration times on the multiple quasar images are some of the largest, ranging from 30 to 1400 h, leading to signal-to-noise per pixel of ≈30–90 around 7000 Å in the spectra. The best-fitting strong lensing models presented by Acebron et al. (2022a, b) are used to accurately estimate the physical transverse separations between the quasar multiple images in the absorber plane. The angular separations between the quasar multiple images range from 2 to 22 arcsec, allowing us to study the low-ionization gas, traced by Mg ii and Fe ii absorption, over physical separations of 0.4–150 kpc at z ≈ 0.5–2.3, and the high-ionization gas, traced by C iv absorption, over 0.4–25 kpc at z ≈ 1.6–2.3.
By looking at how the fractional difference in rest equivalent width (ΔWr) of the metal absorption between two quasar sightlines varies with the physical separation, we investigate the coherence of metal-enriched gas. The main results of this study are discussed below.
– Overall, ΔWr shows an increasing trend with physical separation for both the low- and high-ionization gas phase, indicating that the metal absorption becomes less coherent on going to larger separations (Fig. 4). Within a characteristic length-scale of ≈10 kpc, the metal-enriched gas in the CGM shows a higher level of coherence. However, there is also considerable scatter in ΔWr, with values ranging from ≈0.08 to ≈0.9, suggesting clumpy metal-enriched gas in the CGM even at separations smaller than coherent length-scale of ≲10 kpc. Interestingly, we find paired Mg ii absorption even at ≈100–150 kpc, which could be tracing the same halo. A detailed analysis of the chemical composition and kinematic structure of the absorption lines is required to check whether they trace large-scale spatially coherent structures.
– We do not find any significant dependence of ΔWr on the equivalent width, redshift, and associated galaxy environment, i.e. single or groups of galaxies (Figs 5 and 8).
– Comparing the coherence of the different metal absorption, we find that C iv shows the highest degree of coherence, followed by Mg ii and Fe ii, implying that the coherence length of the high-ionization gas phase is likely to be larger than that of the low-ionization gas phase (Fig. 6). At separations less than 10 kpc, about 90 per cent, 50 per cent, and 30 per cent of the C iv, Mg ii, and Fe ii absorbers have ΔWr less than 0.5, respectively.
– Finally, we find cases of coherent metal absorption detected across three quasar sightlines, with the coherence being the highest across the closest quasar sightlines at separations ≲10 kpc (Fig. 7).
Our results are qualitatively similar to what has been found in previous observations of metal absorption towards lensed quasars (e.g. Ellison et al. 2004; Rubin et al. 2018; Augustin et al. 2021). Based on a compilation of paired Mg ii and C iv absorption towards lensed quasars in the literature, Rubin et al. (2018) reported similar increase in ΔWr with physical separation, as well as significant scatter in the relation, similar to what we find in this work. Consistent with our results, they find that C iv systems exhibit a higher degree of coherence than Mg ii, with ≈90 per cent of C iv systems having ΔWr less than 0.5 at separations less than 10 kpc compared to ≈64 per cent for Mg ii. Using observations of the MUSE Ultra Deep Field, which consists of a bright quasar pair at z ≈ 3, Fossati et al. (2019) detected a system of correlated Mg ii absorption at z ≈ 0.88 along two sightlines separated by ≈480 kpc that has ΔWr ≈ 0.68 and is associated with a group of six galaxies. This is in line with the trends we find in this work, and supports the existence of at least some large-scale coherent structures in the cool gas.
In addition to the observational studies, a large spread in ΔWr of Mg ii absorption has been found in high resolution (≈0.1 kpc) FOGGIE simulations of the CGM (Augustin et al. 2021). Further, this study found that extended inflowing filaments show coherence over larger scales than outflowing clumpy structures. Therefore, they suggest that Mg ii systems that vary strongly over small scales likely trace outflowing clumps rather than filamentary structures. On the other hand, using the Illustris TNG50 simulations, Nelson et al. (2020) found that the CGM is composed of thousands of small (≈1 kpc) cold gas clouds that are predominantly infalling and not outflowing. Additionally, using three-dimensional hydrodynamical simulations, (Fielding et al. 2020) have found evidence of a fractal nature of the cooling surface that arises within the radiative turbulent mixing layers in a multiphase medium. Further analysis of a statistical sample of galaxy haloes in high-resolution simulations is required to understand the effect of spatial resolution and different feedback models on the origin of cold gas clouds in the CGM (e.g. van de Voort et al. 2019).
A complimentary and indirect observational technique to map the distribution and extent of CGM gas has typically been to study the radial profiles of equivalent width and covering fraction in statistical ensembles of quasar–galaxy pairs. The trend of decreasing coherence of metal absorption with separation that we observe in this study is qualitatively consistent with the general decreasing trend of covering fraction of metals with projected separation from galaxies reported in the literature (e.g. Chen et al. 2010; Nielsen et al. 2013; Bordoloi et al. 2014; Dutta et al. 2020, 2021). It is interesting to note that such studies find a more extended distribution of C iv absorption than Mg ii around galaxies, and increasing ionization state of the gas with increasing distance from galaxies (e.g. Werk et al. 2014; Dutta et al. 2021). Taken together with the results from this study, this could point towards a simple picture where the clumpier low-ionization gas is embedded in a more homogeneous and highly ionized gas. Additionally, studies have found signatures of more extended Mg ii absorption in overdense group-environments (e.g. Bordoloi et al. 2011; Nielsen et al. 2018; Dutta et al. 2020, 2021). Here we do not find any discernible difference in the coherence and distribution of Mg ii absorption between single and groups of galaxies, with the caveat that the sample sizes are statistically small and different in properties.
In the future, a more detailed comparison of the column densities and kinematics of individual absorption components using high resolution (R ≳ 20 000) spectra would place tighter constraints on the sizes of individual gas clouds and larger-scale coherent structures, parameters that are key to constrain models of metal enrichment and mixing. Combining this with the physical properties of the galaxies obtained from the MUSE data, we can study in more detail the connection between structures of the metal-enriched CGM and the galaxy environment.
ACKNOWLEDGEMENTS
We thank the anonymous reviewer for their helpful comments. This work is based on observations collected at the European Organisation for Astronomical Research in the Southern Hemisphere under ESO programme IDs 0102.A-0642(A), 0103.A-0554(A), 092.B-0512(A). We acknowledge financial support through grants PRIN-MIUR 2017WSCC32 and 2020SKSTHZ. AA received funding from the European Union’s Horizon 2020 research and innovation programme under the Marie Skłodowska-Curie grant agreement no. 101024195 – ROSEAU. This project received funding from the European Research Council (ERC) under the European Union’s Horizon 2020 research and innovation programme (grant agreement no. 757535) and by Fondazione Cariplo (grant no. 2018 – 2329).
DATA AVAILABILITY
The observational data used in this work are available from the European Southern Observatory archive: https://archive.eso.org.
References
APPENDIX A: METAL ABSORPTION LINES DETECTED TOWARDS THE QUASAR MULTIPLE IMAGES
List of Mg ii and C iv systems detected towards image A of J1029.
| Ion | Rest | Redshift | Equivalent | Error in Wr |
|---|---|---|---|---|
| Wavelength (Å) | Width, Wr (Å) | (Å) | ||
| Mg ii | 2796 | 0.5111 | 0.832 | 0.011 |
| Mg ii | 2803 | – | 0.635 | 0.012 |
| Mg i | 2852 | – | 0.114 | 0.012 |
| Fe ii | 2600 | – | 0.427 | 0.008 |
| Mg ii | 2796 | 0.9186 | 1.669 | 0.008 |
| Mg ii | 2803 | – | 1.461 | 0.009 |
| Mg i | 2852 | – | 0.395 | 0.010 |
| Fe ii | 2600 | – | 1.071 | 0.007 |
| Mg ii | 2796 | 1.0059 | 0.212 | 0.030 |
| Mg ii | 2803 | – | 0.094 | 0.017 |
| Mg ii | 2796 | 1.6931 | 0.988 | 0.021 |
| Mg ii | 2803 | – | 0.715 | 0.021 |
| Mg i | 2852 | – | 0.064 | 0.020 |
| Fe ii | 2600 | – | 0.455 | 0.014 |
| Mg ii | 2796 | 1.8912 | 0.150 | 0.016 |
| Mg ii | 2803 | – | 0.083 | 0.015 |
| Mg ii | 2796 | 1.9117 | 1.997 | 0.019 |
| Mg ii | 2803 | – | 1.749 | 0.019 |
| Mg i | 2852 | – | 0.186 | 0.019 |
| Fe ii | 2600 | – | 0.891 | 0.024 |
| Mg ii | 2796 | 1.9417 | 0.650 | 0.019 |
| Mg ii | 2803 | – | 0.402 | 0.015 |
| Mg i | 2852 | – | 0.069 | 0.014 |
| Fe ii | 2600 | – | 0.394 | 0.017 |
| C iv | 1548 | 1.6150 | 0.341 | 0.005 |
| C iv | 1550 | – | 0.324 | 0.006 |
| Si iv | 1393 | – | 0.105 | 0.006 |
| Si iv | 1402 | – | 0.074 | 0.006 |
| C iv | 1548 | 1.6228 | 0.338 | 0.005 |
| C iv | 1550 | – | 0.185 | 0.005 |
| C iv | 1548 | 1.6930 | 0.327 | 0.008 |
| C iv | 1550 | – | 0.155 | 0.009 |
| C iv | 1548 | 1.7210 | 0.102 | 0.005 |
| C iv | 1550 | – | 0.047 | 0.005 |
| C iv | 1548 | 1.7651 | 0.043 | 0.003 |
| C iv | 1550 | – | 0.031 | 0.003 |
| C iv | 1548 | 1.8908 | 0.505 | 0.009 |
| C iv | 1550 | – | 0.466 | 0.008 |
| Si iv | 1393 | – | 0.182 | 0.003 |
| Si iv | 1402 | – | 0.272 | 0.003 |
| CI v | 1548 | 1.8947 | 0.404 | 0.005 |
| CI v | 1550 | – | 0.333 | 0.005 |
| CI v | 1548 | 1.8981 | 0.201 | 0.004 |
| CI v | 1550 | – | 0.152 | 0.006 |
| Si iv | 1393 | – | 0.020 | 0.003 |
| Si iv | 1402 | – | 0.011 | 0.003 |
| C iv | 1548 | 1.9117 | 1.184 | 0.014 |
| C iv | 1550 | – | 0.884 | 0.015 |
| Si iv | 1393 | – | 0.882 | 0.008 |
| Si iv | 1402 | – | 0.492 | 0.008 |
| C iv | 1548 | 2.1083 | 0.133 | 0.003 |
| C iv | 1550 | – | 0.080 | 0.003 |
| Si iv | 1393 | – | 0.025 | 0.003 |
| Si iv | 1402 | – | 0.013 | 0.003 |
| C iv | 1548 | 2.1195 | 0.062 | 0.003 |
| C iv | 1550 | – | 0.030 | 0.003 |
| C iv | 1548 | 2.1269 | 0.146 | 0.002 |
| C iv | 1550 | – | 0.108 | 0.002 |
| C iv | 1548 | 2.1349 | 0.081 | 0.003 |
| C iv | 1550 | – | 0.043 | 0.003 |
| C iv | 1548 | 2.1819 | 0.432 | 0.004 |
| C iv | 1550 | – | 0.301 | 0.004 |
| Si iv | 1393 | – | 0.112 | 0.007 |
| Si iv | 1402 | – | 0.059 | 0.006 |
| C iv | 1548 | 2.1954 | 1.712 | 0.004 |
| C iv | 1550 | – | 1.313 | 0.004 |
List of Mg ii and C iv systems detected towards image B of J1029.
| Ion | Rest | Redshift | Equivalent | Error in Wr |
|---|---|---|---|---|
| Wavelength (Å) | Width, Wr (Å) | (Å) | ||
| Mg ii | 2796 | 0.5124 | 0.109 | 0.006 |
| Mg ii | 2803 | – | 0.053 | 0.006 |
| Fe ii | 2600 | – | 0.044 | 0.004 |
| Mg ii | 2796 | 0.5654 | 0.088 | 0.009 |
| Mg ii | 2803 | – | 0.038 | 0.008 |
| Mg ii | 2796 | 0.6731 | 1.729 | 0.010 |
| Mg ii | 2803 | – | 1.585 | 0.010 |
| Mg i | 2852 | – | 0.612 | 0.010 |
| Fe ii | 2600 | – | 1.352 | 0.011 |
| Mg ii | 2796 | 0.9184 | 0.173 | 0.005 |
| Mg ii | 2803 | – | 0.103 | 0.006 |
| Fe ii | 2600 | – | 0.004 | 0.003 |
| Mg ii | 2796 | 1.0032 | 0.613 | 0.020 |
| Mg ii | 2803 | – | 0.441 | 0.020 |
| Mg i | 2852 | – | 0.044 | 0.006 |
| Fe ii | 2600 | – | 0.307 | 0.004 |
| Mg ii | 2796 | 1.7628 | 0.404 | 0.014 |
| Mg ii | 2803 | – | 0.412 | 0.012 |
| Mg i | 2852 | – | 0.055 | 0.010 |
| Mg ii | 2796 | 1.8939 | 0.246 | 0.014 |
| Mg ii | 2803 | – | 0.427 | 0.013 |
| Mg ii | 2796 | 1.9122 | 1.337 | 0.020 |
| Mg ii | 2803 | – | 0.926 | 0.020 |
| Mg i | 2852 | – | 0.051 | 0.013 |
| Fe ii | 2600 | – | 0.342 | 0.019 |
| Mg ii | 2796 | 1.9788 | 0.401 | 0.019 |
| Mg ii | 2803 | – | 0.299 | 0.018 |
| Mg i | 2852 | – | 0.035 | 0.013 |
| Fe ii | 2600 | – | 0.382 | 0.011 |
| C iv | 1548 | 1.6085 | 0.040 | 0.003 |
| C iv | 1550 | – | 0.028 | 0.003 |
| C iv | 1548 | 1.6150 | 0.115 | 0.005 |
| C iv | 1550 | – | 0.138 | 0.007 |
| C iv | 1548 | 1.6221 | 0.300 | 0.003 |
| C iv | 1550 | – | 0.158 | 0.004 |
| C iv | 1548 | 1.6253 | 0.024 | 0.003 |
| C iv | 1550 | – | 0.012 | 0.003 |
| C iv | 1548 | 1.6556 | 0.172 | 0.006 |
| C iv | 1550 | – | 0.093 | 0.006 |
| C iv | 1548 | 1.6924 | 0.154 | 0.007 |
| C iv | 1550 | – | 0.057 | 0.004 |
| C iv | 1548 | 1.7065 | 0.050 | 0.003 |
| C iv | 1550 | – | 0.025 | 0.003 |
| C iv | 1548 | 1.7211 | 0.039 | 0.004 |
| C iv | 1550 | – | 0.020 | 0.004 |
| C iv | 1548 | 1.7626 | 0.194 | 0.009 |
| C iv | 1550 | – | 0.112 | 0.009 |
| C iv | 1548 | 1.8910 | 0.599 | 0.010 |
| C iv | 1550 | – | 0.683 | 0.008 |
| Si iv | 1393 | – | 0.138 | 0.005 |
| Si iv | 1402 | – | 0.134 | 0.005 |
| C iv | 1548 | 1.8943 | 0.707 | 0.005 |
| C iv | 1550 | – | 0.689 | 0.007 |
| Si iv | 1393 | – | 0.468 | 0.009 |
| Si iv | 1402 | – | 0.425 | 0.009 |
| C iv | 1548 | 1.9017 | 0.559 | 0.007 |
| C iv | 1550 | – | 0.387 | 0.008 |
| Si iv | 1393 | – | 0.200 | 0.005 |
| Si iv | 1402 | – | 0.159 | 0.005 |
| C iv | 1548 | 1.9120 | 0.902 | 0.010 |
| C iv | 1550 | – | 0.719 | 0.011 |
| Si iv | 1393 | – | 0.688 | 0.006 |
| Si iv | 1402 | – | 0.346 | 0.006 |
| C iv | 1548 | 2.1083 | 0.200 | 0.005 |
| C iv | 1550 | – | 0.106 | 0.005 |
| Si iv | 1393 | – | 0.036 | 0.003 |
| Si iv | 1402 | – | 0.051 | 0.004 |
| C iv | 1548 | 2.1209 | 0.571 | 0.004 |
| C iv | 1550 | – | 0.504 | 0.004 |
| Mg ii | 2796 | – | 0.046 | 0.012 |
| Mg ii | 2803 | – | 0.025 | 0.011 |
| C iv | 1548 | 2.1285 | 0.240 | 0.004 |
| C iv | 1550 | – | 0.182 | 0.004 |
| Si iv | 1393 | – | 0.050 | 0.004 |
| Si iv | 1402 | – | 0.021 | 0.004 |
| C iv | 1548 | 2.1349 | 0.071 | 0.003 |
| C iv | 1550 | – | 0.031 | 0.003 |
| C iv | 1548 | 2.1820 | 0.386 | 0.004 |
| C iv | 1550 | – | 0.234 | 0.004 |
| Si iv | 1393 | – | 0.144 | 0.006 |
| Si iv | 1402 | – | 0.093 | 0.006 |
| C iv | 1548 | 2.1955 | 1.579 | 0.004 |
| C iv | 1550 | – | 1.236 | 0.004 |
List of Mg ii and C iv systems detected towards image C of J1029.
| Ion | Rest | Redshift | Equivalent | Error in Wr |
|---|---|---|---|---|
| Wavelength (Å) | Width, Wr (Å) | (Å) | ||
| Mg ii | 2796 | 0.9182 | 0.596 | 0.028 |
| Mg ii | 2803 | – | 0.267 | 0.022 |
| Mg ii | 2796 | 1.0032 | 0.566 | 0.025 |
| Mg ii | 2803 | – | 0.425 | 0.025 |
| Mg i | 2852 | – | 0.140 | 0.029 |
| Fe ii | 2600 | – | 0.196 | 0.023 |
| Mg ii | 2796 | 1.8939 | 0.227 | 0.016 |
| Mg ii | 2803 | – | 0.221 | 0.015 |
| Mg ii | 2796 | 1.9122 | 0.712 | 0.022 |
| Mg ii | 2803 | – | 0.521 | 0.023 |
| Fe ii | 2600 | – | 0.136 | 0.022 |
| Mg ii | 2796 | 1.9417 | 0.264 | 0.021 |
| Mg ii | 2803 | – | 0.085 | 0.016 |
| Mg ii | 2796 | 1.9788 | 0.344 | 0.020 |
| Mg ii | 2803 | – | 0.277 | 0.030 |
| Mg i | 2852 | – | 0.097 | 0.022 |
| Fe ii | 2600 | – | 0.196 | 0.015 |
| C iv | 1548 | 2.1077 | 0.278 | 0.020 |
| C iv | 1550 | – | 0.156 | 0.016 |
| C iv | 1548 | 2.1206 | 0.652 | 0.014 |
| C iv | 1550 | – | 0.688 | 0.017 |
| Mg ii | 2796 | – | 0.117 | 0.018 |
| Mg ii | 2803 | – | 0.082 | 0.015 |
| C iv | 1548 | 2.1957 | 1.576 | 0.007 |
| C iv | 1550 | – | 1.166 | 0.007 |
List of Mg ii and C iv systems detected towards image A of J2222.
| Ion | Rest | Redshift | Equivalent | Error in Wr |
|---|---|---|---|---|
| Wavelength (Å) | Width, Wr (Å) | (Å) | ||
| Mg ii | 2796 | 1.2017 | 1.191 | 0.030 |
| Mg ii | 2803 | – | 1.154 | 0.036 |
| Mg i | 2852 | – | 0.410 | 0.029 |
| Fe ii | 2600 | – | 0.861 | 0.033 |
| Mg ii | 2796 | 2.2981 | 1.016 | 0.034 |
| Mg ii | 2803 | – | 1.110 | 0.029 |
| Fe ii | 2600 | – | 0.391 | 0.023 |
| C iv | 1548 | – | 1.037 | 0.023 |
| C iv | 1550 | – | 1.081 | 0.020 |
| C iv | 1548 | 2.8022 | 1.155 | 0.014 |
| C iv | 1550 | – | 0.912 | 0.011 |
| Si iv | 1393 | – | 0.503 | 0.020 |
| Si iv | 1402 | – | 0.230 | 0.015 |
List of Mg ii and C iv systems detected towards image B of J2222.
| Ion | Rest | Redshift | Equivalent | Error in Wr |
|---|---|---|---|---|
| Wavelength (Å) | Width, Wr (Å) | (Å) | ||
| Mg ii | 2796 | 1.2017 | 1.739 | 0.030 |
| Mg ii | 2803 | – | 1.556 | 0.026 |
| Mg i | 2852 | – | 0.597 | 0.032 |
| Fe ii | 2600 | – | 1.115 | 0.036 |
| Mg ii | 2796 | 2.2985 | 0.917 | 0.032 |
| Mg ii | 2803 | – | 1.105 | 0.031 |
| Fe ii | 2600 | – | 0.394 | 0.024 |
| C iv | 1548 | – | 1.158 | 0.023 |
| C iv | 1550 | – | 1.608 | 0.023 |
| C iv | 1548 | 2.8022 | 1.102 | 0.012 |
| C iv | 1550 | – | 0.904 | 0.014 |
| Si iv | 1393 | – | 0.482 | 0.019 |
| Si iv | 1402 | – | 0.257 | 0.017 |
List of Mg ii and C iv systems detected towards image C of J2222.
| Ion | Rest | Redshift | Equivalent | Error in Wr |
|---|---|---|---|---|
| Wavelength (Å) | Width Wr (Å) | (Å) | ||
| Mg ii | 2796 | 1.2965 | 0.805 | 0.041 |
| Mg ii | 2803 | – | 0.622 | 0.043 |
| Mg i | 2852 | – | 0.291 | 0.044 |
| Fe ii | 2600 | – | 0.382 | 0.029 |
| Mg ii | 2796 | 2.2990 | 1.819 | 0.055 |
| Mg ii | 2803 | – | 1.856 | 0.050 |
| Fe ii | 2600 | – | 0.186 | 0.045 |
| C iv | 1548 | – | 1.655 | 0.038 |
| C iv | 1550 | – | 1.677 | 0.035 |
| C iv | 1548 | 2.8022 | 1.082 | 0.012 |
| C iv | 1550 | – | 0.858 | 0.014 |
| Si iv | 1393 | – | 0.507 | 0.031 |
| Si iv | 1402 | – | 0.191 | 0.025 |
