


In our paper Bijas et al. (2022), we showed two differential plots of the degree of polarization (ΔP) and polarization angle (ΔPA) as a function of distance towards NGC 1893 (fig. 7 in Bijas et al. 2022), which are not correct. This is because those differential plots could have been produced by taking the differences in the P and PA values between successive dust layers traced by the polarization measurements of two successive stars that lie along a line of sight. This could have been achieved by simply sorting the stars in their increasing order of distances. However, we have realized that in the ΔP and ΔPA versus distance plots, the P and PA values were not sorted in their increasing order of distances before taking their differences. This resulted in erroneous distributions of ΔP and ΔPA in fig. 7 of Bijas et al. (2022).
We have reproduced the correct differential plots by sorting out the distances in increasing order which are shown in Fig. 1. The probability density and frequency distribution information are shown with gray/black background and histograms. However, we could not categorize two groups of stars via the Gaussian Mixture Model (GMM) using correctly sorted ΔP, ΔPA, and d values. Nevertheless, from both the new differential plots presented in Fig. 1, a clear transition in the density can still be seen at ∼2 kpc. Therefore, the conclusions drawn from these plots remain the same, i.e. a clear transition occurs at ∼2 kpc distance separating the proposed two dust populations – foreground dust and Perseus dust. Finally, these new plots do not affect our conclusions mentioned in the original paper Bijas et al. (2022).
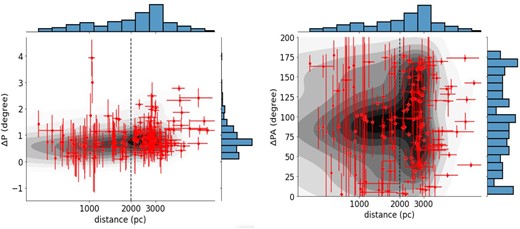
The differential density plots: distance versus ΔP (Left) and ΔPA (Right). The darker background corresponds to a higher probability density, whereas the lighter density corresponds to a lower one. The vertical dotted line denotes 2 kpc where the transition is observed. Two-dimensional histograms in each panel are also shown.
References
Author notes
Ramanujan Fellow
