


ABSTRACT
Massive star winds are structured both stochastically (‘clumps’) and often coherently (Co-rotation Interaction Regions, or CIRs). Evidence for CIRs threading the winds of Wolf–Rayet (WR) stars arises from multiple diagnostics including linear polarimetry. Some observations indicate changes in polarization position angle across optical recombination emission lines from a WR star wind but limited to blueshifted Doppler velocities. We explore a model involving a spherical wind with a single conical CIR stemming from a rotating star as qualitative proof-of-concept. To obtain a realistic distribution of limb polarization and limb darkening across the pseudo-photosphere formed in the optically thick wind of a WR star, we used Monte Carlo radiative transfer (MCRT). Results are shown for a parameter study. For line properties similar to WR 6 (EZ CMa; HD 50896), combining the MCRT results, a simple model for the CIR, and the Sobolev approximation for the line formation, we were able to reproduce variations in both polarization amplitude and position angle commensurate with observations. Characterizing CIRs in WR winds has added importance for providing stellar rotation periods since the vsin i values are unobtainable because the pseudo-photosphere forms in the wind itself.
1 INTRODUCTION
Precise determinations of massive star mass-loss rates remain elusive, due to time-dependent, non-spherical, non-laminar behaviour inferred for stellar wind flows (e.g. Puls, Vink & Najarro 2008; Hillier 2020). Uncertainties in the mass-loss rate contribute to ambiguities in our understanding of stellar evolution, since stellar mass-loss quantities are key for understanding angular momentum losses, the evolution of luminosity with age, and stellar remnant outcomes (Smith 2014; Ramachandran 2023).
The wind structure of single, non-magnetic massive stars manifests itself in two main forms: stochastic and coherent variability. The stochastic variability is frequently called ‘clumping’ and describes density variations in the flow that are random (e.g. Lépine & Moffat 1999; Hamann, Feldmeier & Oskinova 2008), whereby the wind may be spherically symmetric in time average, but is formally aspherical at any given moment. This clumping is often distinguished as microclumping when clumps are optically thin or macroclumping or porosity when clumps are optically thick (e.g. Oskinova, Hamann & Feldmeier 2007). Ultimately, clumps bias emissive diagnostics used to infer mass-loss rates (e.g. Hillier 1991; Fullerton, Massa & Prinja 2006; Šurlan et al. 2013). Numerous studies have focused on better understanding the physics, properties, and statistics of clumps to infer corrections to obtain more accurate mass-loss rates, |$\dot{M}$| (e.g. Sundqvist, Puls & Owocki 2014; Sundqvist & Puls 2018). Such studies have seen many advances on the topic both observationally and theoretically (Ramiaramanantsoa et al. 2019; Moens et al. 2022; Flores, Hillier & Dessart 2023, Brands et al. in preparation).
The coherent variability is often attributed to Co-rotating Interaction Regions (CIRs; Mullan 1984) and have been associated with the ubiquitous discrete absorption components (DACs) observed in the ultraviolet (UV) P Cygni line absorption components of strong resonance lines of O stars (e.g. Howarth & Prinja 1989; Kaper et al. 1996). The CIRs are believed to be associated with star-spots that produce local differentials in mass flux and in the wind flow speed profile (i.e. ‘velocity law’) at the wind base (e.g. Cranmer & Owocki 1996; Dessart 2004; David-Uraz et al. 2017). Shocks form with hypersonic wind speeds, leading generally to spiral features – the CIRs – that thread the flow (Massa & Prinja 2015). As with clumping, CIRs produce time-dependent behaviour and bias emissive diagnostics. Unlike clumping, these effects are phase dependent and cyclic, (Brown et al. 2004), with slow evolution as the star-spots evolve. Since the identification of CIRs, there have been numerous studies focused on their origins and observable consequences, with several recent advances in terms of modelling effects for multiwavelength diagnostics (Carlos-Leblanc et al. 2019; Ignace, St-Louis & Prinja 2020).
Clumping is universal to all hot-star winds, while CIRs are universal to O-star winds. Evidence for CIRs in the dense winds of the massive Wolf–Rayet (WR) stars has been amassing for years (Chené & St-Louis 2011; Chené et al. 2011; Aldoretta et al. 2016; St-Louis, Tremblay & Ignace 2018; Toala et al. 2022). The winds are so dense that the inner hydrostatic layers are unobservable. In particular, direct information from spectral lines about rotational speeds such as v sin i values are simply unobtainable. Yet, elucidating the properties of rotation for WR stars is crucial for understanding supernovae, gamma-ray bursts, and black hole remnants (Yoon & Langer 2005; Smartt 2009; Georgy et al. 2012; Vink & Harries 2017). Confirming the presence of a CIR in any given WR star, and measuring its cyclic behaviour provides valuable information about the stellar rotation period, since the whole CIR feature revolves at constant angular speed.
A powerful tool for probing the geometry of unresolved stellar sources is polarimetry (e.g. Hoffman, Bjorkman & Whitney 2012). Specifically, intrinsic linear polarization can only arise if the source deviates from spherical. For hot massive stars, electron scattering is a key polarigenic opacity, both in the atmospheres and the winds. However, polarization observations are complicated by a wavelength-dependent contribution from the interstellar medium, often modelled with the ‘Serkowski Law’ (Serkowski, Mathewson & Ford 1975). For a star with an intrinsic continuum polarization, it is well known that the polarization is depressed across emission lines when the line photons are little scattered by the copious free electrons (McLean et al. 1979). This effect of depressing the polarization is known as the ‘line effect’ and can aid with distinguishing between the intrinsic stellar polarization and the interstellar contribution (Schulte-Ladbeck et al. 1991). The intrinsic polarization position angle (PA) of the stellar continuum is generally different from that of the interstellar polarization. In particular, the PA from the interstellar contribution is fixed at all wavelengths. Consequently, if the PA is observed to change (or ‘rotate’) across the line, the effect certainly is intrinsic to the star.
As an example, in Fig. 1 we present an adaptation1 of fig. 2 from Schulte-Ladbeck et al. (1991) for WR 6 showing the He ii 4686 recombination line shown in the upper panel and for polarization across the line in the lower panel. As concluded by the authors, a loop is detected in the q − u plane that appears primarily on the blueshifted side of the line, in other words, the PA rotation is limited to blueshifted velocities for a given epoch. By contrast polarization for the redshifted points in the line are largely at fixed PA. Similar effects are observed in more recent data obtained with ESPaDOnS (Fabiani et al. in preparation).
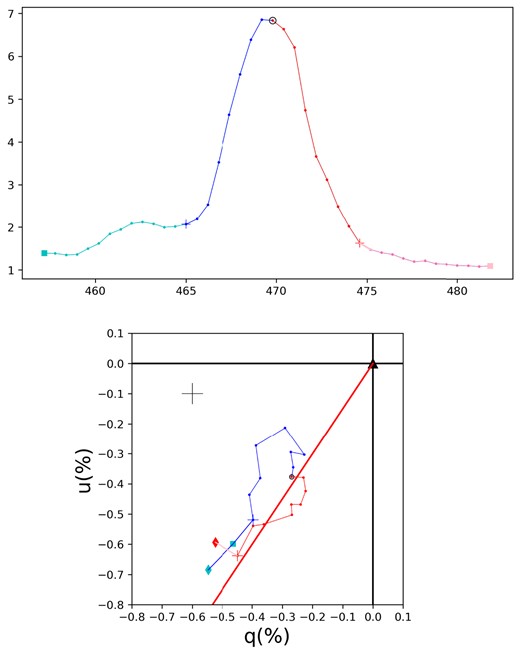
Based on the observational data of WR 6 for He ii 4686 from Schulte-Ladbeck et al. (1990), the upper panel shows the emission line profile while the lower panel shows polarization across the line. Top: The circle near line peak is the line centre. Colour indicates blue and redshifted sides. Bottom: A plot of q − u variations across the line, binned to obtain a typical error as indicated towards upper left. The three diamonds (1 red and 2 blue) are for continuum polarizations. The two large crosses identify the largest blue and redshifted velocities attributed to the line. The straight red line is drawn to start from the origin and roughly follow the redshifted velocity points. Note that the prominent loop is at blueshifted velocities, whereas polarimetric variations across the red side follow mainly a straight line (see text).
For an expanding symmetric wind, it is only the flow in front of the star that contributes to the absorption profile, and that absorption only appears at blueshifted velocities. This has motivated us to present a simplified wind model with a conical CIR that rotates with the star. Its phase-dependent projection against the stellar pseudo-photosphere, along with its density contrast compared to the rest of the wind, produces differential absorption of the limb polarization of the pseudo-photosphere. We develop this model and conduct a parameter study as proof-of-concept for producing PA rotation at blueshifted velocities along with polarimetric variation at redshifted velocities for constant PA.
This paper is structured as follows. Our model assumptions are introduced in Section 2, including the assumptions of the wind and the CIR plus a review of the Sobolev approximation for the radiative transfer of emission lines as applied to the case at hand. This is followed by a parameter study presented in Section 3. Line profile variability along with polarization variability – both degree of polarization and polarization position angle – are simulated as functions of viewing inclination and properties of the CIR. A summary is given in Section 5. Finally, the details of the Monte Carlo radiative transfer (MCRT) calculations to ascertain realistic limb polarization and limb darkening distributions for pseudo-photospheres of thick scattering winds are presented in Appendix A.
2 LINE PROFILE MODELLING
This paper is inspired by suggestions that there is a PA rotation across the line in linear polarization at blueshifted velocities of an optical recombination emission line, but a lack of related behaviour at redshifted velocities. When polarimetric variability spans the full range of Doppler shifts for circumstellar bulk flows, one typically attributes such effects to asymmetric structures in the scattering volume (e.g. Brown & McLean 1977; Brown, McLean & Emslie 1978; Brown, Ignace & Cassinelli 2000). By contrast, for an expanding outflow, the most natural culprit for PA rotation limited to blueshifted velocities in the line but not redshifted ones would be absorption effects. While acknowledging that WR winds are complicated in terms of having CIRs (perhaps more than one), a stochastic component in terms of clumps, the formation of wind shocks to account for X-ray emission, and optically thick radiatve transfer in continuum opacity (i.e. electron scattering and free–free/bound–free), here we develop a limited model in terms of a single CIR that corotates with the star to produce polarimetric variability at blueshifted velocities but not redshifted ones. This is achieved through time-dependent, but cyclical, differential absorption of the limb polarized pseudo-photosphere by a CIR structure that is overdense compared with the rest of the wind.
2.1 Coordinate system definition
We introduce a system of spherical coordinates (r, χ, ψ) from the observer’s perspective centred on the star, where χ = 0° is in the direction of the observer and defines the z-axis. The star is taken to have spherical coordinates (r, θ, ϕ), with θ as the colatitude defined from the spin axis of the star z*. The viewing inclination i0 of the star is expressed in terms of unit vectors as |$\hat{z}\cdot \hat{z}_\ast = \cos \mathrm{ i}_0$|.
To explore the effects of a CIR in producing loops in the Q–U plane across only blueshifted velocities for an expanding wind, we consider stellar wind and CIR models that are simplified to demonstrate a proof-of-concept result and to conduct a parameter study. We assume the stellar wind is spherically symmetric outside the CIR, and that it expands according to a linear velocity law, with
where Rphot is the radius of the pseudo-photosphere formed in the wind itself, taken to be where optical depth unity is achieved along the observer’s line of sight (LOS) to the star. For typical WR winds, we expect Rphot ∼ 2 R*, for R* the hydrostatic radius of the star. At this location, the wind speed at the photosphere, vphot, will be a few hundreds of km s−1.
For the CIR we assume a strictly conical structure with a density deviation from the spherical wind by a factor of 1 + η (Ignace, St-Louis & Proulx-Giraldeau 2015), where η is a dimensionless quantity with η ≥ −1. When η is negative, the CIR density is lower than the density of the wind; η = 0 is equivalent to no CIR; and positive η is for a CIR that is overdense compared to the wind. The density of the CIR is thus given by
where the spherical wind density is
For the wind density, the linear velocity law from equation (1) was used, and a normalized inverse radius introduced as
The expansion velocity within the CIR is taken as the same as external to the CIR. Consequently, our model takes the wind expansion to be spherically symmetric everywhere, but the density distribution is asymmetric via the geometry of the CIR through the factor η.
2.2 The Sobolev approximation for recombination emission lines
To simulate line profiles for heuristic purposes, the Sobolev approximation is adopted (Sobolev 1960). The line profile shape is calculated by evaluating optical depths on isovelocity surfaces. These surfaces represent the locus of points for which the Doppler shift in the direction of the observer is constant. The LOS velocity shift is given by
This equation indicates that surfaces with constant vz correspond to planes oriented with constant z, thus normal to |$\hat{z}$|. We introduce a normalized velocity shift as
In normalized units, the isovelocity surfaces intersect the photosphere for −1 ≤ wz ≤ +1. Note that unlike typical wind velocity laws, a wind with homologous expansion formally has no terminal speed.
For the radiative transfer, we introduce the Sobolev line optical depth with
where κL is the frequency-integrated opacity with units of cm g−1 Hz, ρ is the density, λL is the rest wavelength of the line of interest, and dvz/dz is the LOS velocity gradient. Seeking to model a recombination line that forms in the wind, τL scales with the square of density. However, NLTE effects and a radius-dependent temperature can introduce additional radius dependencies. Consequently, we use a scaling relation of
where g(r) can be used as a fitting parameter for the line profile shape as needed.
For a linear velocity law, the LOS velocity gradient simplifies to (e.g. Mihalas 1978)
As a result, the optical depth becomes
where η = 0 when not in the CIR, and η ≠ 0 when inside the CIR. Also, τ0 is a line optical scale used as a free parameter of the model.
We model the effect of a CIR for the line transfer entirely in terms of density contrast η. However, hydrodynamic models (e.g. Cranmer & Owocki 1996) indicate that the transition in density between a CIR and the wind is not discontinuous. Moreover, the velocity field interior to the CIR does not follow that of the wind and can be non-monotonic with large velocity gradients. These gradients can be important in modelling variable UV P Cygni lines. Despite these shortcomings in our approach, we are modelling recombination emission lines from WR winds that generally display no net P Cygni absorption (unlike scattering resonance lines; Hamann, Koesterke & Wessolowski 1995), plus our intent is mainly proof-of-concept. Our model explores the asymmetric and time-dependent changes in the Sobolev optical depth for producing Q–U trends across recombination lines. We seek to demonstrate the effect and conduct a parameter study in order to inform future, more detailed model calculations.
2.3 Emission line profile shape
Calculation of the line profile shape is determined by the intensity reaching the observer. We integrate over intensity to formulate the line luminosity as a function of velocity shift. For a distant observer, we evaluate intensities on a grid of rays parallel to the observer z-axis. We introduce a cylindrical radius ϖ as the impact parameter of a ray and normalized to Rphot. The radiative transfer for the emergent monochromatic intensity becomes
where the subscript ν denoting frequency dependence has been omitted, IC is the stellar continuum intensity for those rays that intersect the photosphere, SL is the line source function, and τL is the Sobolev line optical depth. Rays only intercept the photosphere when ϖ ≤ 1. For rays with ϖ > 1 do not intercept the photosphere, and the first term can be ignored. Additionally, occultation of material behind the star is not included in the flux calcuations for rays intercepting the photosphere.
For a spherical wind, the emergent intensity is a function only of ϖ (by symmetry) and of wz, by virtue of the velocity shift and corresponding isovelocity surface under consideration. Here, however, the intensity also depends on ψ because of the CIR. This means, for example, that an intensity or isophotal map will not be centro-symmetric about the observer LOS.
In the next section, our method for calculating the linear polarization across the line in terms of Stokes parameters will be introduced. Here, we note that the emergent intensity in the preceding equation is for Stokes I. In this Stokes parameter, the luminosity of line emission is
where again the first term is for the absorption of the photosphere for rays that intercept it, and the second term is for the emission produced in the wind itself. Note that the integrations are carried out over the isovelocity surfaces.
In the core-halo approach, the stellar luminosity L* is expressed as
Our prescription for |$I_\mathrm{ C}(\varpi)\equiv I_\ast \, F(\varpi)$|, which includes limb darkening, is described in the Appendix A, where I* is a fiducial intensity scale and F is the intensity distribution across the pseudo-photosphere formed in the thick scattering wind.
In the spirit of proof-of-concept, we make a further simplification by assuming SL = IC, essentially an assumption of LTE for an isothermal wind at the temperature of the star. While not quantitatively accurate for WR winds, this eliminates one further free parameter in our study while still producing a pure emission line as observed. The assumption entails no net P Cygni absorption for blueshifted velocities. For example, equation (11) shows that I = IC when SL = IC. This occurs because the emission from the wind exactly offsets the absorption by the column density associated with the isovelocity surface.
As an example, Fig. 2 displays four recombination emission line profiles for a purely spherical wind, so η = 0 everywhere, and we take g(ξ) = 1. The four line profiles are for line optical depth parameters τ0 = 0.3, 1.0, 3.0, and 10.0 from weakest to strongest. Note even though SL = IC, the emission line is not quite symmetric because occultation by the photosphere blocks some line emission from the hemisphere of the wind with redshifted velocities.

Emission-line profiles for a spherical wind with no CIR structure (i.e. η = 0). The wind velocity is linear with v ∝ r, and the density is ρ ∝ r−3. The four profiles are for the four values of line optical depth parameter τ0 as indicated, plotted as continuum normalized flux against normalized velocity shift. The vertical green line is a guide for the location of line centre.
2.4 Variable line polarization
Our goal is to calculate variable linear polarization across blueshifted velocities of the line profile. While Stokes parameter I describes the total intensity, Stokes Q and U describe the linearly polarized intensity, and V describes the intensity of circular polarization. Here we take V = 0. To obtain a net intrinsic polarization for an unresolved source, the source cannot be centro-symmetric in its intensity distribution. Our thesis is that symmetry is broken by the presence of a CIR. Moreover, that the polarization shows a position angle rotation on a single spectrum over only blueshifted velocities suggests an absorptive effect. Specifically, axial symmetry is broken through increased absorption of continuum limb polarization by the intervening CIR, plus the CIR adds diluting unpolarized radiation through recombination.
The photosphere is expected to show linear polarization generally at every point on its surface, such as limb polarization. However, if spherically symmetric, the net polarization will be zero. That symmetry is broken because of differential absorption by the CIR. The CIR stretches through the wind, threading across isovelocity surfaces. But those intersections can overlap, in projection from the observer’s perspective, with the photosphere generally at different sectors with rotational phase and viewing inclination. The result is a polarization that varies with time and across blueshifted velocities in the line.
We adopt a centro-symmetric distribution of polarization with impact parameter across the photosphere as an intensity of the form
where G encodes how the amplitude of polarization varies from the centre of the photosphere to the limb, and F is for the corresponding limb darkening profile. Then the Stokes Q and U intensities become
To determine limb polarization and limb darkening appropriate for a photosphere formed in an optically thick wind, we considered spherically symmetric MCRT calculations, which are summarized in the Appendix A. For star and wind parameters similar to WR 6, Gmax = G(ϖ = 1) = 0.23, or a maximum polarization of 23 per cent. Results presented in the Appendix A are used in computing observables described next.
Calculation of the Stokes luminosities becomes
The net polarization arises entirely from attentuation by destructive absorption of the continuum polarization. Note that additional polarization from scattered light in the asymmetric wind is expected (c.f., Ignace et al. 2015), but its influence would not be limited to blueshifted velocities only. We subsume such an effect in the free parameters for the continuum polarization (see next section) so we may focus on polarimetric behaviour limited to only blueshifted velocities in the line.
3 PARAMETER STUDY
For our parameter study, we adopt the following assumptions, several of which have been noted already:
The CIR is conical with half-opening angle β0.
The CIR stems from the equator.
When a point lies within the CIR, the density is enhanced by the factor 1 + η with η > 1.
The velocity field inside the CIR is identical to that of the otherwise spherical wind.
Additionally, as a matter of convention, the angle ψ is defined such that Q > 0 for polarization parallel to the rotation axis and Q < 0 for polarization perpendicular to that axis.
The free parameters of the model consist of the following:
The viewing inclination i0 which is zero for a pole-on view of the stellar rotation axis and 90° for an equator-on view.
The line optical depth scale τL.
The half opening angle β0 of the CIR cone.
The density contrast of the CIR relative to the otherwise spherical wind, η.
As an additional simplication, in equation (8), we assume g = 1 for all the model results shown here, in which case τL ∝ ρ2. The star rotates with period T* and angular speed ω = 2π/T*, such that the azimuth for the centre of the CIR at the equator is |$\phi _0(t) = \omega \, t$|. Finally, our models only allow for one CIR to highlight the effect of interest.
The deficiencies of the model are clear. The CIR need not be conical but could be spiral (e.g. Cranmer & Owocki 1996). The CIR need not be at the equator (c.f., Ignace et al. 2015). There could be multiple CIRs (e.g. the BRIght Target Explorer (BRITE) study of ζ Pup with two CIRs, Ramiaramanantsoa et al. 2018). The density distribution in the CIR need not mimic that of the spherical wind, plus the velocity field in and around the CIR can be non-monotonic (David-Uraz et al. 2017). Our objective here is proof-of-concept not fits to observations, which would require a far more tailored analysis.
With these caveats in mind, we do wish to include some practical issues pertaining to measurements. We allow for interstellar polarization and intrinsic continuum polarization in the following way. The interstellar polarization is chromatic, but its position angle is constant. Its wavelength dependence is slow and can be taken as constant across any particular wind-broadened line. We assign variables qI and uI for the relative polarizations of the Stokes parameters. For example, for a spherical wind with no intrinsic polarization, polarized fluxes of |$f_\mathrm{ Q} = q_\mathrm{ I} \, f_\ast$| and |$f_U = u_I\, f_\ast$| would be measured at Earth with polarization position angle tan (2ψI) = uI/qI.
For the intrinsic continuum polarization, we refer to values of qC and uC that would be measured outside the line. We acknowledge that with a CIR, some degree of polarization in the continuum is expected, and that polarimetric variability would be cyclic with rotational phase. We do not model the continuum polarization self-consistently but allow for it as we anticipate a ‘line effect’ that depresses the continuum polarization within the line (Schulte-Ladbeck et al. 1990). This is a well known effect and occurs when emission line flux is not scattered but acts only to dilute the polarization. It is an artefact of the definition of the polarization as a ratio of polarized flux to total flux. In the continuum the relative polarization is qC and uC. But within the line, if line photons are not scattered, the relative polarizations are depressed by the factor LC/(LC + LL), where LC is the continuum luminosity outside the line and within the line LL = LI − LC, for LI from equation (12).
The final polarizations become
where qL and uL represent the relative Stokes polarizations as given by
Note that qL and uL arise from absorption, so affect only the blueshifted velocities. By contrast the line effect influences both red and blue shifts, and it goes away outside the line. Also, factors qC and uC can be functions of time, such as when the continuum polarization arises from scattered light by the CIR (c.f., Ignace et al. 2015; St-Louis et al. 2018). Model results are illustrated in Figs 3–6. For the multipanel Figs 3–8, model parameter selections are detailed in Table 1.
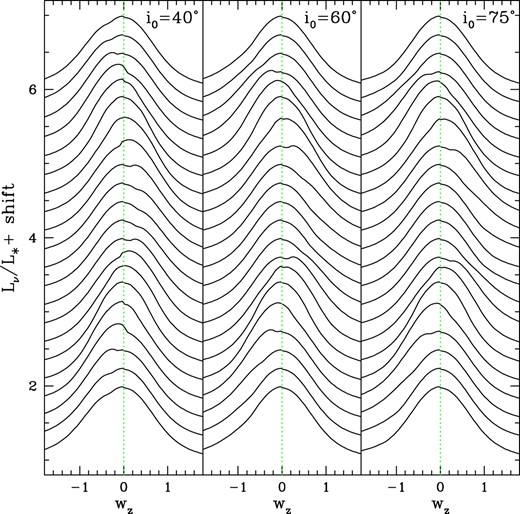
Illustration of viewing inclination effects on the emission line profile. The model wind has τ0 = 3 with a conical CIR of half opening angle β0 = 25° and η = 1. The panels are for the three viewing inclinations i0 as indicated. The vertical green line is a guide for line centre. There are 21 profiles for phase intervals of 0.05 in rotation, each line being shifted slightly for viewing.
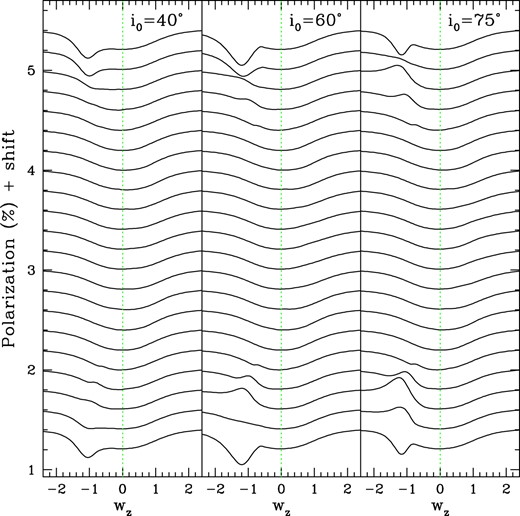
Similar to Fig. 3, now for the polarization across the emission line. Here, the continuum polarization is taken to have Stokes parameters of |$q_\mathrm{ C}=-0.6~{{\ \rm per\ cent}}$| and |$u_\mathrm{ C}=-0.6~{{\ \rm per\ cent}}$|, similar to the blue continuum point in Fig. 1. There is a depressed level of polarization across the central part of the polarized line profile owing to the line effect. There are also additional features in the blue wing when the CIR is in front of the star. These effects are present for the first quarter and last quarter of the curves, but not the middle half of them when the CIR rotates behind the star.
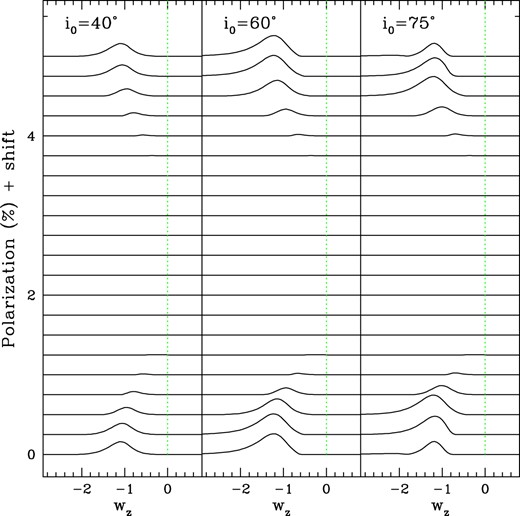
The same models as Figs 3 and 4, now assuming no interstellar or intrinsic continuum polarizations (i.e. qI = uI = qC = uC = 0). The removal of continuum polarization eliminates the polarimetric dilution of the emission line while isolating the effect by the CIR. The vertical green line is a visual guide for line centre (note that velocity shift is not shown symmetric about the line since the polarization is zero at redshifted velocities).
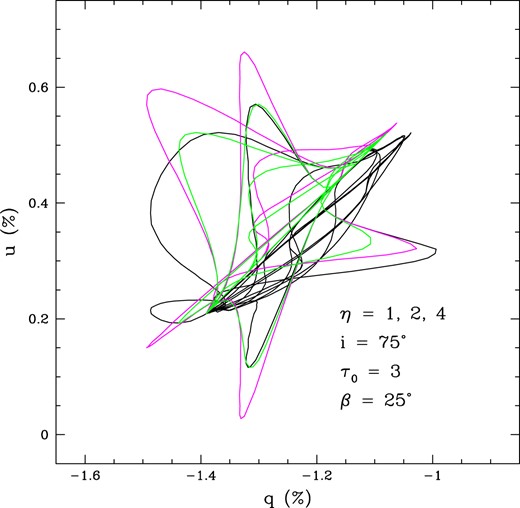
A q − u figure with model parameters as shown and emphasizing how the value of η alters the pattern of polarimetric variability. The colours are η = 1 (green), 2 (magenta), and 4 (black). Note that |$q_\mathrm{ C}=u_\mathrm{ C}=-0.6~{{\ \rm per\ cent}}$|, |$q_\mathrm{ I}=-0.8~{{\ \rm per\ cent}}$|, and |$u_\mathrm{ I}=+0.8~{{\ \rm per\ cent}}$|. Each colour represents 21 rotational phases, from 0.0 to 1.0 (with 0.0 and 1.0 being degenerate); however, only about half of those phases produce loops corresponding to when the CIR is in front of the star.
Illustrative cases for q − u variations for different sets of model parameters (see Table 1). A given curve is the polarization across the line profile from blue wing through line centre across the red wing. Left panels have no intrinsic polarization in the source continuum and show a spoke-like pattern. Upper left has no interstellar polarization, whereas lower left does. Right panels do have continuum polarization but no interstellar polarization. The linear portions are for the red wing (changing polarization owing to the line effect, but no position angle rotation), whereas the loop discursions are all from the blue wing.
Same models as shown in Fig. 7, now plotting specifically the polarization position angle ψ against normalized velocity shift. With no continuum polarization, upper left shows only horizontal lines. Different curves are for different rotational phases. The position angle signifies the portion of the sky masked by the overdense conical CIR structure against the star. The one horizontal line extending to redshifts is the unvarying polarization position angle reflective of the continuum and/or interstellar medium parameters.
Model parameters.
| Figure | β0 | η | i0 | τ0 | qC | uC | qI | uI |
|---|---|---|---|---|---|---|---|---|
| (°) | (°) | (per cent) | (per cent) | (per cent) | (per cent) | |||
| 3-left | 25 | 1 | 40 | 3 | −0.6 | −0.6 | −0.8 | + 0.8 |
| 3-mid | 25 | 1 | 60 | 3 | −0.6 | −0.6 | −0.8 | + 0.8 |
| 3-right | 25 | 1 | 75 | 3 | −0.6 | −0.6 | −0.8 | + 0.8 |
| 4-left | 25 | 1 | 40 | 3 | −0.6 | −0.6 | −0.8 | + 0.8 |
| 4-mid | 25 | 1 | 60 | 3 | −0.6 | −0.6 | −0.8 | + 0.8 |
| 4-right | 25 | 1 | 75 | 3 | −0.6 | −0.6 | −0.8 | + 0.8 |
| 5-left | 25 | 1 | 40 | 3 | 0.0 | 0.0 | 0.0 | 0.0 |
| 5-mid | 25 | 1 | 60 | 3 | 0.0 | 0.0 | 0.0 | 0.0 |
| 5-right | 25 | 1 | 75 | 3 | 0.0 | 0.0 | 0.0 | 0.0 |
| 7-top left | 25 | 1 | 60 | 3 | 0.0 | 0.0 | 0.0 | 0.0 |
| 7-bot left | 25 | 1 | 60 | 3 | 0.0 | 0.0 | + 1.0 | + 2.0 |
| 7-top right | 25 | 1 | 60 | 3 | −0.6 | −0.6 | 0.0 | 0.0 |
| 7-bot right | 25 | 1 | 60 | 3 | + 0.4 | −0.2 | 0.0 | 0.0 |
| 8-top left | 25 | 1 | 60 | 3 | 0.0 | 0.0 | 0.0 | 0.0 |
| 8-bot left | 25 | 1 | 60 | 3 | 0.0 | 0.0 | + 1.0 | + 2.0 |
| 8-top right | 25 | 1 | 60 | 3 | −0.6 | −0.6 | 0.0 | 0.0 |
| 8-bot right | 25 | 1 | 60 | 3 | + 0.4 | −0.2 | 0.0 | 0.0 |
In Figs 3 and 4, the effects of the CIR on the line profile shape and polarization are shown for three different viewing inclination angles. Emission profile variations are shown in Fig. 3 for 21 equally spaced rotational phases, from bottom (phase 0) to top (phase 1, which is the same as phase 0). The profiles are continuum normalized and plotted against normalized velocity shift wz. Each profile is vertically shifted by a small amount for ease of viewing. The selection of viewing inclinations divides the solid angle of the sky, from the point of view of the star, into four equal solid portions. Consequently for a random observer, the odds of viewing the CIR poleward of 40°, between 40° and 60°, between 30° and 75°, and equatorward of 75° are all equal. (Likewise for the opposite hemisphere.)
The polarization across the profiles are shown in the same fashion as in Fig. 4. Continuum polarization values for qC and uC are chosen that are similar to the blue continuum point observed for WR 6 as shown in Fig. 1. Additionally, non-zero values of interstellar polarization values were assigned as qI and uI as well. The presence of continuum polarization intrinsic to the star results in the classic ‘line effect’, whereby polarization is depressed inversely to the line emission. In addition, the conical CIR imposes variable polarization only at blueshifts (wz < 0) and when forefront of the star, corresponding to the lower five and upper five line profiles.
The same CIR model is shown in Fig. 5, now with no polarization arising from either the source continuum nor imposed by the interstellar medium. Here, the effects of the CIR are dramatically evident. Note that the panels emphasize blueshifts, showing little of the red wings which are just flat lines of zero polarization. The vertical green line is for line centre.
In this figure, as expected, there is no line effect when there is no continuum polarization. The bumps in the polarization arise entirely from the CIR producing enhanced absorption of the limb polarization of the stellar pseudo-photosphere. The location of the bump drifts in velocity shift as the CIR structure rotates about the star. The amplitude changes as well. These effects arise because of how the conical CIR intersects regions of isovelocity surfaces that lie in front of the star. Changing the inclination alters the strength of the bump. When the CIR rotates to the back side of the star, no bumps are present.
To illustrate the effect of density contrast in the CIR as compared to the otherwise spherical wind, Fig. 6 shows 4 models in the q − u plane. Model parameters are indicated in the plot space, with η values of 1 (green), 2 (magenta), 3 (blue), and 4 (black). Each complete loop is for a different phase, with of course only about half the phases producing loops (i.e. when the CIR is forefront of the star). The patterns are all qualitatively similar, mainly with reduced amplitude of variation with lower η.
Fig. 6 is a ‘mashup’ of many phases. The next two figures highlight a few phases for greater clarity, and also indicate that the model can produce both clockwise (CW) and counterclockwise (CCW) senses of PA rotation. The sense of PA rotation is with reference to velocity shifts, meaning as the polarization and PA varies mostly smoothly from line centre to continuum, what is the handedness of that variation.
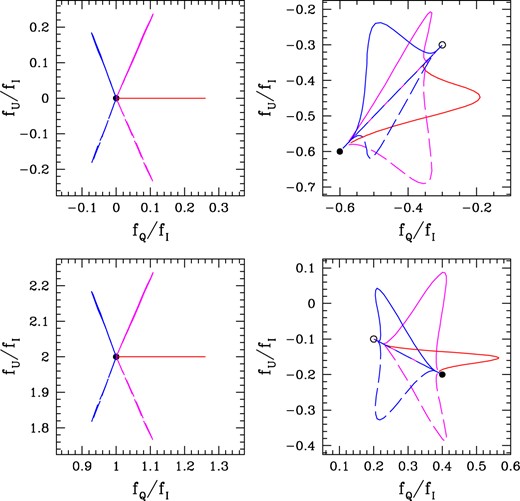
Figs 7 and 8 display a 4-panel set of models for different combinations of continuum and interstellar polarization values and only select rotational phases of 0.00 (red), 0.05 (magenta), 0.10 (blue) in solid and 0.90 (blue), 0.95 (magenta), and 1.00 (red) in dashed. A reminder that at phase 0.00 and 1.00, the CIR is directly forefront of the star (but at some viewing inclination). Phase 0.25 is when the CIR has rotated to the plane of sky, right of the star in projection by our convention; then phase 0.75 is when the CIR has rotated fully behind the star to again be in the plane of the sky, now left side of the star.
The same models are displayed in Figs 7 and 8, where the former shows line profiles displayed in the q − u plane, and the latter shows polarization position angle, ψ, variations with velocity shift in the lines. Model parameters are provided in Table 1. For Fig. 7, the two left panels have zero continuum polarization; upper has no interstellar while lower does have interstellar. The two panels at right both have continuum polarizations (different values of qC and uC), but neither has interstellar polarization. When there is no continuum polarization, the q − u patterns are ‘spokes’ (left); where there is continuum polarization, loop patterns are apparent for the blue wing, but linear variations appear for the red wing.
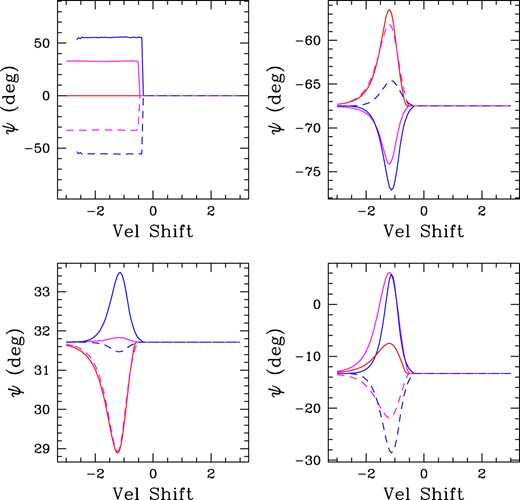
For Fig. 8, the patterns seen in Fig. 7 map into ψ versus wz as fixed PAs on the red wing, but generally variable PAs on the blue wing. One exception is the upper left panel. In the absence of continuum polarization, each rotation phase is a constant PA on the blue wing, but that PA differs from the always fixed PA for the red wing. Note the small rotation in PA for the lower left panel. Here there is no continuum polarization, but there is interstellar polarization. Since the line polarization itself varies with velocity shift, and since the PA is defined as tan 2ψ = utot/qtot, a small PA results. Whether the effect is large or small depends on how the interstellar polarization compares with that from the line.
4 SUMMARY
The most massive stars experience substantial mass-loss rates over their stellar lifetimes, while both on the main sequence and during post-main sequence stages (such as LBV and WR phases). Accurate mass-loss rates are needed to constrain stellar atmosphere and evolution models that predict ionizing radiation, properties of progenitors of supernovae, rotational histories, and the properties of remnants. However, structure in the wind outflows create uncertainties in many observational wind diagnostics.
This structure takes two primary forms: stochastic such as clumping and organized such as CIRs. The latter are coherent features that thread the wind and produce periodic or quasi-periodic effects tied to the rotation of the star. While CIRs are inferred from the absorption troughs of P Cygni UV resonance lines for OB stars, their presence has been less studied for WR winds at UV wavelengths (see Prinja & Smith 1992, for one example). However, evidence for their presence has been building for the WR class. Since the hydrostatic layers are unobservable owing to the optically thick winds, CIRs are critically important for providing rotation periods of WR stars, for which there seems few other means for measuring the periods.
While CIRs can produce a variety of observable effects, the one emphasized in this paper is the prospect of variable polarization across emission lines that occurs at blueshifted velocities but not redshifted ones. We developed a simplistic model to explore this diagnostic consisting of a conical CIR in an otherwise spherical wind, and a radially expanding flow following a linear velocity law with v ∝ r.
While such a model does not yield quantitatively accurate results, our simulations provide qualitative insights relevant to observations. (1) For a pseudo-photosphere formed in the wind with a distribution of limb polarization, a CIR can indeed produce time-variable polarization restricted to blueshifted velocities when the CIR is forefront of the star. (2) The CIR produces no such effects when it rotates to the backside of the star. (3) Different loop patterns in the q − u plane result as a function of the level of continuum polarization outside the emission line.
These general features should be fairly robust for more realistic wind and CIR models. It is certainly possible that more realistic velocity fields inside and outside the CIR, combined with a rotational component and with possible spiral morphology of the CIR will lead to a richer spectrum of variable behaviour. In particular, some variable polarization could appear at redshifted velocities, but likely closer to line centre.
Archival data of linear spectropolarimetry of the He ii 4686 line from WR 6 obtained with HPOL in the 1990s hint at the effects explored here. Data of higher precision and spectral resolution from ESPaDOnS display several of the effects have been modelled and will appear in a future paper (Fabiani et al, in preparation).
ACKNOWLEDGEMENTS
The authors express appreciation to Ken Gayley for insightful and encouraging remarks that have improved this manuscript. RI and CE gratefully acknowledge that this material is based upon work supported by the National Science Foundation under grant number AST-2009412. The work of ANC was supported by NOIRLab, which is managed by the Association of Universities for Research in Astronomy (AURA) under a cooperative agreement with the National Science Foundation. NSL and AFJM acknowledge financial support from the National Sciences and Engineering Council (NSERC) of Canada.
DATA AVAILABILITY
No new data were generated or analysed in support of this research.
Footnotes
Archival data obtained from the Mikulski Archive for Space Telescopes (MAST) at archive.stsci.edu/hpol.
References
APPENDIX A: LIMB DARKENING AND LIMB POLARIZATION FOR A SPHERICAL AND OPTICALLY THICK WIND
We employed the MCRT routines of Wood et al. (1996) to simulate the scattered light distribution of a spherically symmetric and electron-scattering wind. With linear expansion v(r) ∼ r, the wind density is ρ ∼ r−3. The LOS optical depth to the wind base from the observer in the direction of the centre of the star is
where we have used ξ = R*/r.
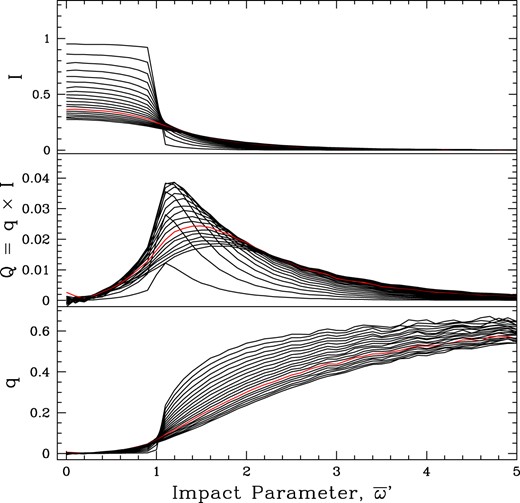
We ran a suite of models for total optical depths of τ = 0.1 to 3.9 in steps of 0.2 as shown in Fig. A1. Note that τ0 = 2τ. These panels show the emergent total Stokes I intensity, Stokes Q intensity, and relative polarization as q = Q/I with LOS at impact parameter ϖ′. Note that ϖ′ is normalized to R* (hence ϖ′ = 1 is the stellar limb). By contrast, ϖ (without a prime) of earlier sections was normalized to Rphot. While the net flux of polarization cancels identically owing to symmetry, the intensity emerging from any ray through the wind is generally linearly polarized. It is the asymmetric absorption of this background polarization on the photosphere by the CIR that leads to effects described in this paper.
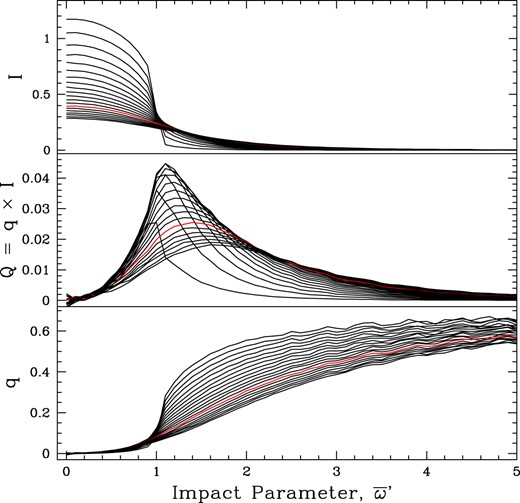
The results of MCRT radiative transfer models for a spherically symmetric wind with inverse cube density and pure electron scattering. Panels are emergent Stokes-I (top), Stokes-Q (middle), and relative polarization q (bottom), plotted against observer impact parameter ϖ′ relative to the stellar radius (i.e. ϖ′ = 1 corresponds to R*). Each curve is for a different optical depth from 0.1 to 3.9 in steps of 0.2. The red curve is for τ = 2.7 corresponding to WR 6. These models allow for limb polarization and limb darkening of the hydrostatic atmosphere.
Note that the I and Q intensities are relative to the case of no wind (i.e. τ = 0), no limb darkening, nor limb polarization. A bare star that is uniformly bright is taken to have stellar intensity I* = 1. In Fig. A1, the hydrostatic star has a standard limb polarization and limb darkening profile of a plane-parallel atmosphere solution for pure scattering (e.g. Chandrasekhar 1960). By contrast Fig. A2 shows the set of runs now for a star with neither limb polarization nor limb darkening. This is made clear by the fact that at low wind optical depth, the intensity profile from ϖ = 0 to 1 is flat with I = I* = 1.
The same as Fig. A1 but for a star with no limb polarization and no limb darkening (i.e. the intensity is taken as uniform at the wind base).
As the optical depth is increased, starlight is redistributed over a larger range of impact parameters as conservative and grey electron scattering leads to multiple scattering and diffusion of light over an increasingly large volume about the star. The result is an ill-defined effective pseudo-photosphere. Here ‘ill-defined’ refers to the idea of a breakdown in the standard core-halo approach, where the photosphere can be identified with a hydrostatic atmosphere, or ‘core’, and the circumstellar environment is the ‘halo’. In impact parameter there is no longer a clean transition from rays that intercept a thick atmosphere to those that pass through a thin wind. However, it is clear that once the wind becomes optically thick to scattering, the emergent I and Q distributions no longer depend on the details of the intensity distribution at the hydrostatic layers of the wind base, namely whether or not it has limb darkening or limb polarization.
Based on St-Louis et al. (2018), the optical depth for the wind of WR 6 is about τ = 2.7, which appears as the red curve in Figs A1 and A2. Fig. A3 shows this model singled out over a more restricted range of impact parameters. Fig. A3 also shows a fit to the intensity I and to the relative polarization q. The fit applies to ϖ′ ≤ 1.6 R* corresponding to the peak in the Stokes intensity Q. In our proof-of-concept approach, we retain the core-halo approach for convenience, and we use the following fit formulae to model the limb polarization and limb darkening of the effective pseudo-photosphere:
where in the last equation, the implied fit is a quintic order polynomial. Again, ϖ = 1.6ϖ′, since ϖ′ is relative to R*, whereas Rphot = 1.6 R* was adopted as the radial extent of the pseudo-photosphere for WR 6 as our example.
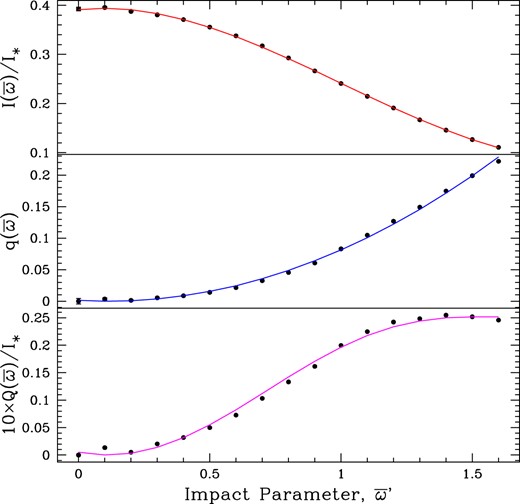
Using the red curve for τ = 2.7 from Fig. A1, fits are made to the MCRT results (shown as points) up to the impact parameter where Stokes-Q peaks, at ϖ′ ≈ 1.6, for Stokes-I (top; red), and q (middle; blue). Then the fit for Q is implied as product of the fits with q × I (bottom; magenta). The fit formulae are given in equations (A2–A3).
The preceding expressions are used for the modelling of the variable emission line profile variability in I, Q, and U fluxes described in this study treating the pseudo-photosphere as if it where a spherical atmosphere. In terms of the model output, the peak intensity for the case of τ = 2.7 is I(ϖ′ = 0) = 0.39 I*. The intensity at the limb of the pseudo-photosphere is I(ϖ′ = 1.6) = 0.11 I*. The limb darkening is well-fit by a cubic polynomial in ϖ with a limb that is |$0.11/0.39=28~{{\ \rm per\ cent}}$| as bright as the central intensity. The standard limb darkening result of an Eddington grey plane-parallel atmosphere is |$2/5 = 40~{{\ \rm per\ cent}}$| for the emergent intensity parallel to the atmosphere relative to normal to the atmosphere. As expected, sphericity effects lead to stronger limb darkening (Neilson & Lester 2011; Neilson 2012). Using the fit expression, the specific stellar luminosity associated with the pseudo-photosphere is
where the factor of 0.58 derives from the fit formula, and the factor of 0.23 derives from recasting the expression in terms of Rphot = 1.6 R*.
Note also that the limb polarization is q(ϖ′ = 1.6) = 0.23 or 23 per cent, much higher than the classic 11 per cent of the plane-parallel result by Sobolev (1960). Again, higher limb polarization is the result of sphericity effects combined with a power-law wind density (Cassinelli & Hummer 1971). The variation of q with ϖ is well-fit by a quadratic polynomial. These fits were adopted for the pseudo-photosphere brightness variations in Stokes I and Q for the line profile modeling in earlier sections.
Note, that a more realistic treatment of the problem implies there would be some variation of the polarization at redshifts as well as at blueshifts. Indeed, observations of such an effect would help constrain refinements of both the model geometry of the CIR as well as the distribution of scattered light throughout the optically thick wind, a topic for a future study.
