


ABSTRACT
The Ly α forest (LAF) at z > 5 probes the thermal and reionization history of the intergalactic medium (IGM) and the nature of dark matter, but its interpretation requires comparison to cosmological hydrodynamical simulations. At high-z, convergence of these simulations is more exacting since transmission is dominated by underdense voids that are challenging to resolve. With evidence mounting for a late end to reionization, small structures down to the sub-kpc level may survive to later times than conventionally thought due to the reduced time for pressure smoothing to impact the gas, further tightening simulation resolution requirements. We perform a suite of simulations using the Eulerian cosmological hydrodynamics code Nyx, spanning domain sizes of 1.25 − 10 h−1 Mpc and 5 − 80 h−1 kpc cells, and explore the interaction of these variables with the timing of reionization on the properties of the matter distribution and the simulated LAF at z = 5.5. In observable Ly α power, convergence within 10 per cent is achieved for k < 0.1 s km–1, but larger k shows deviation of up to 20 per cent. While a later reionization retains more small structure in the density field, because of the greater thermal broadening there is little difference in the convergence of LAF power between early (z = 9) and later (z = 6) reionizations. We conclude that at z ∼ 5.5, resolutions of 10 kpc are necessary for convergence of LAF power at k < 0.1 s km–1, while higher-k modes require higher resolution, and that the timing of reionization does not significantly impact convergence given realistic photoheating.
1 INTRODUCTION
The configuration of matter in the z > 5 universe is a probe of many questions of cosmological importance. The initial distribution is set by the primordial power spectrum, describing the density perturbations in space with the overdense regions providing the seeds for later structure formation. Dark matter accounts for the majority of the mass, and so its evolution dominates that of the power spectrum, meaning by extension that the distribution is dependent on the physical properties of dark matter.
While cold dark matter (CDM) is by far the preferred dark matter model due to its success in describing a multitude of observables (see e.g. Bullock & Boylan-Kolchin 2017), its predictions are not always perfectly aligned with observations. Issues such as the missing satellites (Klypin et al. 1999; Moore et al. 1999), cusp-core (Flores & Primack 1994; Moore 1994), and too-big-to-fail (Boylan-Kolchin, Bullock & Kaplinghat 2011) problems motivate the exploration of alternative models, such as thermal relic warm dark matter (WDM). Such models, involving lighter particles with masses possibly on the order of a few keV and higher streaming velocities than CDM, would naturally result in a reduction in power on small physical scales. The ability to measure the amplitude of fluctuations on small scales could therefore inform our understanding of the nature of dark matter.
The baryonic matter distribution is initially dominated by that of dark matter, but it is also significantly impacted by major astrophysical events, such as the Epoch of hydrogen Reionization (EoR). The EoR involved the photoionization of the intergalactic medium (IGM) by a buildup of the ultraviolet background (UVB), likely dominated by small galaxies (though see also Naidu et al. 2020, in support of contributions from brighter ones). Reionization injected an uncertain quantity of heat into the gas, with numerical and theoretical studies estimating the peak temperature to be ∼ 20 000 K (Miralda-Escudé & Rees 1994; McQuinn 2012; D’Aloisio et al. 2019). This would have forced a thermodynamic response in the gas and induced an expansion or ‘puffing up’ of smaller structure (Katz et al. 2020; Puchwein et al. 2023).
The Ly α forest (LAF), measured from quasar spectra, is one available probe of the 1D distribution of matter. Ly α photons emitted by quasars are absorbed by hydrogen gas in the IGM along the line of sight, with the degree of absorption dictated by the gas overdensity, ionization state, temperature, and line-of-sight velocity. The LAF is already well-established as a useful probe of the dark matter distribution and matter power spectrum (Cen et al. 1994; Zhang, Anninos & Norman 1995; Hernquist et al. 1996; Miralda-Escudé et al. 1996; Theuns et al. 1998; Croft et al. 1999; Viel, Haehnelt & Springel 2004; McDonald et al. 2006; Palanque-Delabrouille et al. 2013; Walther et al. 2018). The signal is more difficult to extract at smaller physical scales due to instrumental resolution limitations, and at higher redshifts both because of the increasing mean density and the increasing neutrality of the gas, which results in substantially reduced transmission and signal-to-noise. Additionally, metal contamination becomes an issue in this regime, and must be masked out. Analyses of high resolution, high-S/N spectra have now led to measurements of the Ly α power up to log (k/(s km−1)) = −1.1 at z = 5.4 (Viel et al. 2013a), and log (k/(s km−1)) = −0.7 up to z = 5 (Boera et al. 2019).
The interpretation of observations of the LAF power spectrum is complicated by the many unknowns of its sourcing environment. For example, the shape and amplitude of the LAF power spectrum is highly dependent on the IGM temperature at mean density T0 and the UVB; however, T0 is not well constrained at z > 5 (e.g. Walther et al. 2019), and investigations of the global H i photoionization rate, for example via the quasar proximity effect (Calverley et al. 2011) or the mean opacity (Wyithe & Bolton 2011; Davies et al. 2018) are themselves contingent on assumption of the temperature. Additionally, the timing and duration of reionization is not certain. While earlier studies established an increase in the Ly α opacity occurring up to z = 6 (Fan et al. 2006), often taken to represent the end of the EoR, more recent works have revealed large expanses with little to no Ly α transmission remaining down to z ∼ 5.5 (Becker et al. 2015). Although a subset of such observations could indicate large scale fluctuations in the temperature or UVB (Chardin et al. 2015; D’Aloisio, McQuinn & Trac 2015; Davies & Furlanetto 2016; Chardin, Puchwein & Haehnelt 2017), another possibility is that there is still substantial neutral hydrogen present at z < 6, perhaps with an end to the EoR occurring as late as z = 5.2 (Kulkarni et al. 2019; Keating et al. 2020).
In combination, the involved physics require that proper interpretation of LAF observations is necessarily supported by numerical simulations, which can capture non-linear evolution and account for relevant model variations in gas temperature, UVB, and reionization history. Currently, there are many suites of cosmological hydrodynamic simulations being used to study the LAF, using a range of base codes, astrophysical models, and resolution1/box size combinations. For example, PRIYA (Bird et al. 2023) uses larger boxes of Lbox = 120 h−1 Mpc with both Δx = 40 and 80 h−1 kpc. The original Sherwood (Bolton et al. 2017) suite used ranges from 10 ≤ Lbox ≤ 160 h−1 Mpc and Δx = 20 to 312 h−1 kpc; follow-up suite, Sherwood-Relics (Puchwein et al. 2023), covers a range of box sizes and mean interparticle separations, from 5 ≤ Lbox ≤ 160 h−1 Mpc and Δx = 4 to 80 h−1 kpc. In order to model the Ly α mean flux to full convergence, these simulations must cover domain sizes of ∼40 h−1 Mpc (Tytler et al. 2009; Lukić et al. 2015), but given the need to make a trade-off between the box size and resolution, most studies in a sufficiently large box are conducted with a spatial resolution on the order of 20 h−1 kpc at best.
However, it is unclear whether 20 h−1 kpc is sufficient for proper modelling of the LAF, especially at higher redshifts where convergence is more difficult to achieve (see e.g. Bolton & Becker 2009; Lukić et al. 2015; Chabanier et al. 2023). Reionization and any pre-reionization heating will affect the gas distribution and by extension the LAF by modifying the pressure smoothing scale, λps, which arguably must be resolved. This scale is related to the instantaneous comoving Jeans scale, |$\lambda _J = \sqrt{\pi c_s^2/G \rho } \left(1+z \right)$|, where cs is the sound speed, G the gravitational constant, and ρ the mass density. However, in reality gas cannot react instantaneously to an increase in heat; indeed, the sound crossing time for gas near the mean density is approximately a Hubble time, leading to a sizeable delay in the physical response. Thus, the size at a given time is dependent on the full thermal history of the gas, which can be captured analytically through the filtering scale of Gnedin & Hui (1998). Observationally, a filtering or conceptually similar pressure smoothing scale could be inferred using the 1D Ly α flux power spectrum, but it is partially obscured by a degeneracy with the thermal broadening effects present in spectra (Peeples et al. 2010a, b; Garzilli, Theuns & Schaye 2015). Methods absent this degeneracy, such as measurements from close quasar pairs, found |$\lambda _\mathrm{ps} \approx 90.2_{-30.1}^{+33.4}$| physical kpc at z = 3.6 (Rorai, Hennawi & White 2013; Rorai et al. 2017). At redshifts approaching the end of reionization, this scale will certainly be much smaller. Small scales captured by high simulation resolutions are of special importance given that this is where alternative dark matter models will have the largest impact on power, and scales of log (k/(km−1 s))≳ −1 are more sensitive to the process of reionization (Nasir, Bolton & Becker 2016; Oñorbe et al. 2017b).
In this work, we explore the convergence of several statistics of structure and the LAF for a suite of cosmological hydrodynamical simulations. In particular, our interest is in determining the resolution and boxsize requirements for reliable interpretation of Ly α observations for large wavenumbers. We also examine how the timing of reionization impacts this convergence. We describe our simulations in Section 2 and results in Section 3. We place our findings within the wider context in Section 4, and provide a summary of the most relevant outcomes in Section 5. All reported lengths and length-derived quantities are comoving and include a factor of h−1 unless specifically noted.
2 SIMULATIONS
For our investigation we use Nyx, a publicly available and highly parallel hydrodynamic cosmological code (Almgren et al. 2013; Sexton et al. 2021), built on the adaptive mesh refinement library AMReX (Zhang et al. 2019). It uses a Godunov-based piecewise parabolic method (Colella & Woodward 1984) to treat the hydrodynamics, which has proved successful in other codes such as enzo (Bryan et al. 1995, 2014) or ramses (Teyssier 2002). A geometric multigrid approach is used to solve the Poisson equation for self-gravity of baryons and dark matter, and quantities tracked on the grid are sub-cycled at a rate appropriate for the refinement level. Nyx excludes any treatment of star formation or other galaxy-scale processes, which are generally unnecessary for a proper treatment of the LAF (see e.g. Viel, Schaye & Booth 2013b), making it an efficient choice for studies of the IGM. While Nyx includes the capability to incorporate certain feedback processes, such as contributions from AGN, they are not utilized in this study. Neutral and ionized hydrogen, neutral, once-, and twice-ionized helium, and free electrons are tracked, allowing for self-consistent modelling of atomic cooling and UV heating processes.
Another benefit of Nyx is its superior resolution of underdense gas compared to smoothed particle hydrodynamics (SPH) codes with identical mean interparticle spacings. Chabanier et al. (2023) explored convergence of Nyx against an SPH code CRK-HACC (Habib et al. 2016; Frontiere et al. 2023). They established that use of the intrinsic SPH kernel in CRK-HACC led to biases in flux statistics, in particular as the kernel led to overestimates of the density in underdense regions. They found that the raw Ly α power was more poorly converged in CRK-HACC as compared to Nyx, unless they applied a corrective measure to the density field using the Delaunay Tesselation Field Estimator (Schaap 2007; Rangel et al. 2016). By using Nyx, and with a fixed resolution grid, we have avoided the complicating factor of a correction to the SPH kernel and ensured more reasonable resolution in the underdense IGM.
To create the initial conditions, we begin by generating separate spatial and velocity transfer functions in baryons and dark matter using camb (Lewis, Challinor & Lasenby 2000). The functions are then used as inputs to cicass (O’Leary & McQuinn 2012), where we presume an initial mean streaming velocity 〈v〉 between baryons and dark matter of 30 km s–1 at z = 1000, approximately the timing of recombination, which decreases to ∼6 km s–1 by z = 200 (Hu & Sugiyama 1995; Ma & Bertschinger 1995; Tseliakhovich & Hirata 2010). The anticipated low temperature of the pre-reionization IGM, ∼ 10 K at z = 100, could lead to shock heating and entropy generation given that even a sub-1 km s–1 velocity offset could be supersonic. While many works neglect this velocity offset, given that a main goal of this investigation is to determine the effect of pressure smoothing on LAF convergence, we elect to include it. See Appendix B for a brief analysis of the impact of this choice.
Runtime options in Nyx allow for the implementation of either an inhomogeneous or flash (instantaneous) hydrogen reionization history, with a user-specified maximum quantity of heat ΔTre added at zre as in Oñorbe et al. (2019)
where Tf and Ti are the final and initial temperatures of a cell, respectively. For example, when an initially fully neutral cell xHI = 1 reionizes, the gas will be heated to a temperature of ΔTre. Regions that have already been heated to temperatures higher than ΔTre via shock heating retain these high temperatures. We opt for three flash reionization cases representing (1) an extremely early case at zre = 9, (2) a fiducial case at zre = 6, and (3) an extremely late case, which does not reionize but that does have a temperature floor of ΔTre applied in post-processing. Except where it is noted otherwise, we add 20 000 K (D’Aloisio et al. 2019). The details of the simulations analysed in the main body of this work are noted in Table 1. We assume a ΛCDM Planck cosmology (Planck Collaboration et al. 2016), with |$\left(\Omega _M, \Omega _\Lambda , \Omega _b, h, X_H\right)=$| (0.315, 0.685, 0.049, 0.675, 0.751).
The properties of the simulations used in the main body of this work. The focus of the analysis for a subset of simulations is noted in the leftmost column, and the varied properties within that subset are noted in subsequent columns. All simulations are run with fixed-grid resolution, rather than on an adaptive grid. Further, while the unreionized simulation does not undergo the EoR process in situ, there is heat applied in post-processing, permitting non-zero Ly α transmission.
| Analysis | Lbox | Δx | zre | ΔTre |
|---|---|---|---|---|
| focus | (h−1 Mpc) | (h−1 kpc) | (K) | |
| Resolution | 10 | 5, 10, | 6 | 20 000 |
| 20, 40, 80 | ||||
| Box size | 10, 5, | 5 | 6 | 20 000 |
| 2.5, 1.25 | ||||
| Reionization | 10 | 5, 10, | 6, 9, none | 5000*, 20 000 |
| history | 20, 40, 80 |
Note. * An additional ΔTre of 5000 K is only used on the unreionized simulation.
From these simulations we randomly select 10 000 lines of sight from the xy-plane of the simulation box to serve as the basis for the skewers; the overdensity, temperature, and velocity information are retrieved and used to calculate the opacity in Ly α. While Nyx self-consistently tracks the ionization state of hydrogen, we calculate this independently by initially applying a constant hydrogen photoionization rate, ΓHI = 10−12s−1, to the skewer, and recalculate xHI assuming contributions from both photo- and collisional ionization.2 Assuming ionization equilibrium in the IGM may result in differences in the ensuing Ly α power compared to the non-equilibrium case, particularly on scales log (k/(s km−1)) > −1 (Kušmić et al. 2022); however, these differences are largest when reionization is not yet complete and diminish post-reionization.
Ideally, the native spectral resolution of the skewers would be fine enough to well-sample the thermal broadening for the average temperature of the IGM; however, this is not the case for our lower resolution simulations. Thus, we use the method introduced in Lukić et al. (2015), which further discretizes the resolution elements of the native grid while still conserving the total optical depth. In brief, the optical depth of the jth spectral pixel as a function of velocity, τj, is calculated as the sum of the contributions of the real-space pixels (i.e. the cells)
where |$f_\mathrm{\mathscr {lu}}$| and λ0 are the Ly α transition oscillator strength and rest wavelength, c is the speed of light, and H(z) is the Hubble parameter at the relevant redshift. The terms e and me are an electron’s charge and mass. The total number of real-space cells is given by Ncells, and y = (vj − v∥, pec, i − v)/b describes the shift in line center from the velocity of the pixel in units of the Doppler parameter, b. The parallel component of the peculiar velocity is given by v∥, pec, and v is the Hubble velocity. In practice, this leads to differences in the flux field and power spectrum; however, for resolutions better than 80 h−1 kpc these are below 10 per cent. Further, this treatment assumes a Gaussian line profile, which could present an issue were we concerned with damped Ly α systems.
We then perform optical depth rescaling so that the mean flux 〈F〉 of the skewer set matches an appropriate value given the redshift, which necessitates use of a specific photoionization rate ΓHI. This can be accomplished by generating the spectra for some fiducial ΓHI, fid and then iteratively re-generating them after adjusting the fiducial value until the mean flux is achieved. Or, if photoionization is assumed to dominate over collisional ionization, one can simply find the factor A such that 〈F〉 = 〈exp(− τv/A)〉, where τv represents the optical depth values acquired using the fiducial photoionization rate. The final ΓHI is then A times ΓHI, fid.
In Fig. 1 we compare Ly α power at z = 5 for our three simplified reionization scenarios to measurements from Boera et al. (2019) in simulations with Lbox = 10 h−1 Mpc and spatial resolution Δx = 5 h−1 kpc, with the optical depth rescaled to match their inferred τeff = 1.69. We plot χ in the lower panel, with χ = (log Pdata − log Pmodel)/σdata. The models are all within about ±2χ of the data for log (k/(s km−1)) < −1.3, with the exception of the low log (k/(s km−1)) = −1.8 bin. For larger k, the zre = 6 and no reion. models are a better match to the observations.3
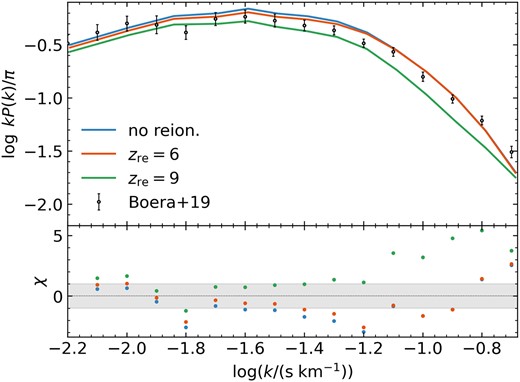
Ly α power at z = 5 for variable reionization histories, overplotted with z ∼ 5 observations from Boera et al. (2019) of the instrumental resolution-corrected power. The residuals in the lower panel are the χ value between our model predictions and their data points, with the shaded region indicating the 1σ spread. The optical depths have been rescaled to match their inferred mean flux value, 〈F〉 = exp (− τeff) = 0.1845.
3 RESULTS
In this section, we examine the effects of resolution, box size, and reionization history on various simulation metrics related to the configuration of matter and the LAF. In subsections 3.1 and 3.2, we focus on the effects of resolution and box size, respectively, used in Nyx in the case of a fiducial reionization history, zre = 6. In subsection 3.3 we explore how the specific implementation of reionization affects the requirements to achieve convergence in the pertinent metrics.
3.1 Resolution effects when zre = 6
We begin by visualizing the impact of resolution with a fiducial reionization history, specifically one in which reionization occurred late so that small IGM structures have not had much time to dissipate by z = 5.5. Compared to an earlier reionization history, this could in theory make the convergence requirements more stringent. Fig. 2 shows 90 km s–1 slices from a 10 h−1 Mpc box with spatial resolutions varying from 5 to 40 h−1 kpc, and Fig. 3 shows the physical quantities along a sample skewer from the same simulations. Modelling a higher spatial resolution allows for the formation of smaller structures in both the underlying dark matter and in the gas that gives rise to Ly α absorption. These structures are visible by eye in the slices as sharper features, and in the physical quantities along the skewer as narrower fluctuations in overdensity, temperature, velocity, and the emergent quantity of Ly α transmission, TLy α.
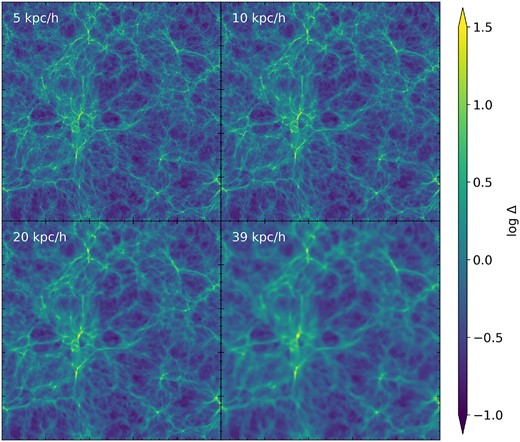
Slices with Δv =90 km s–1 of Nyx 10 h−1 Mpc boxes at z = 5.5 that are flash reionized at z = 6. Spatial resolutions range from 5 h−1 kpc at upper left to 40 h−1 kpc at lower right, with improved resolution resulting in more abundant small scale structure.
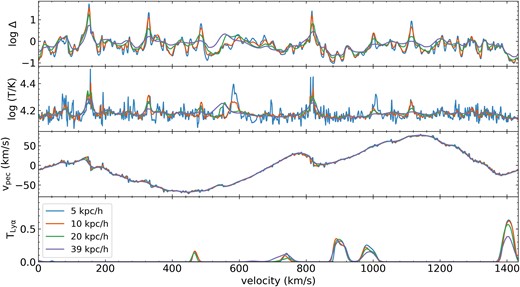
The overdensity, temperature, peculiar velocity, and Ly α transmission fields along a randomly selected skewer in the same simulations as Fig. 2, with varying resolution. Improving spatial resolution from 40 to 5 h−1 kpc results in more variation with a high-spatial frequency, especially visible in overdensity and temperature. These differences cause further variation in the resulting Ly α transmission, in the lowest panel. In particular, excursions to very low overdensities may lead to higher transmission spikes in the bottom panel.
To visualize the effect of resolution on the density field, we plot the 3D matter power spectra at z = 5.5 in gas and dark matter as a function of the wavenumber (panel a of Fig. 4). Both the gas and dark matter power increase as the spatial resolution is improved, that is, as Δx decreases. Additionally, improved resolution causes the power in gas to surpass that of dark matter in the same simulation at small scales, with the crossover point occurring at decreasing values of log k as Δx is decreased. For 80 h−1 kpc, the gas power is always lower than the dark matter power, but by Δx = 40 h−1 kpc there is a turnover occurring at log (k/(h Mpc−1)) = 1.6 above which gas power is higher. This abundance of small structure is not likely related to the LAF, however; it arises from high-density structures. This is in part due to the absence of galaxy formation models in Nyx, as high density regions which would be forming galaxies and producing stellar feedback are instead permitted to cool and collapse without interruption (see for example fig. 2 and associated discussion in Chabanier et al. 2023). These could be removed with an overdensity clip (see Kulkarni et al. 2015), but we do not apply this, and instead simply make an out-of-the-box comparison.
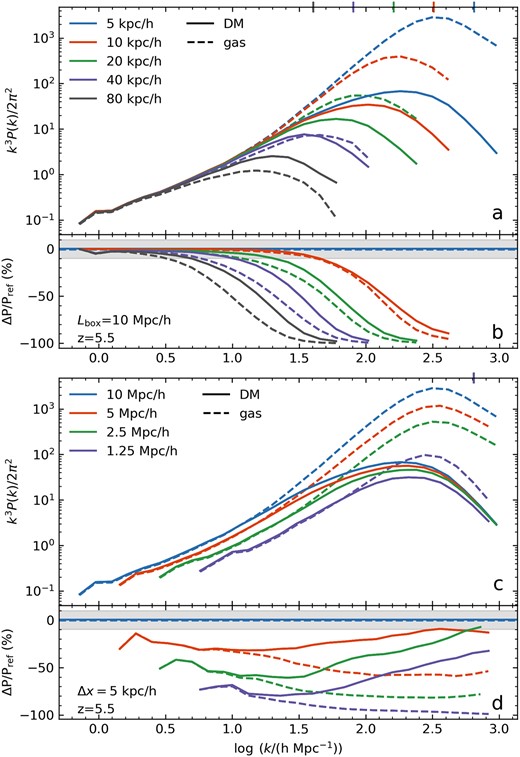
Top panel: the 3D matter density for baryons (dashed) and dark matter (solid) in a 10 h−1 Mpc box with zre = 6 and varying spatial resolution, at z = 5.5. On the panel sharing the x-axis, we show the residuals for each baryon and dark matter 3D power curve with respect to the corresponding curve from the highest resolution simulation, here ∼5 h−1 kpc. The Nyquist sampling frequency, dictated by the spatial resolution of the box, is indicated with the ticks on the upper x-axis. Bottom panel: the same as in upper panel, but for varying box sizes. Here, residuals are shown with respect to the largest box, Lbox = 10 h−1 Mpc.
The convergence trend is illustrated in panel b of Fig. 4, showing the residuals between each DM or baryon power curve with respect to the equivalent 5 h−1 kpc resolution simulation. The 10 h−1 kpc simulation converges within 10 per cent for log (k/(h Mpc−1)) < 1.6, corresponding to a comoving size of ∼0.23 h−1 Mpc, but the lowest resolution simulations are lacking a substantial amount of power. For example, at log (k/(h Mpc−1)) = 1.5, the gas in the 80 h−1 kpc resolution box has only a few per cent of the power in Δx = 5 h−1 kpc. The simulation with 20 h−1 kpc resolution, commonly used in IGM studies, is still about 30 per cent low in gas density power at this scale compared to 5 h−1 kpc.
In a universe with increased underlying small scale structure in the dark matter and gas, it is expected that some of this additional structure should be visible in the LAF power spectrum, as long as variability is enhanced in the appropriate overdensities, −1 ≲ log Δ ≲ 0 for z ∼ 5 (Chabanier et al. 2023). Accordingly, we plot the 1D LAF power spectra in Fig. 5, calculated from 10 000 Nyx skewers as discussed in Section 2. Here, the optical depths are rescaled to reproduce 〈F〉 = 0.05, appropriate for z = 5.5 (Bosman et al. ), and the 1D dimensionless power in Ly α is calculated from the flux contrast field δ = F/〈F〉 − 1.
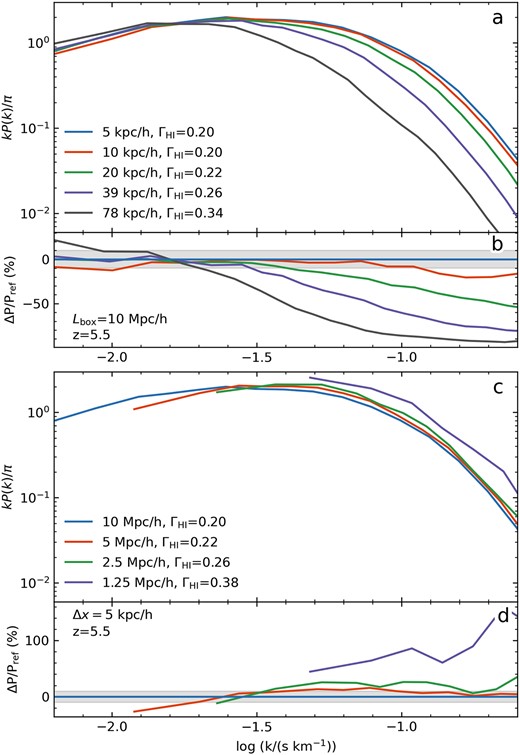
Top panel: the 1D LAF power spectra for skewers taken from the 10 h−1 Mpc box with zre = 6 and varying spatial resolution, at z = 5.5. The ΓHI values in the legend indicate the photoionization rate necessary to rescale the optical depths to the observed average at z = 5.5 of 〈F〉 = 0.05 (Eilers, Davies & Hennawi 2018; Bosman et al. ). Immediately below are the residuals of each power spectrum with respect to the highest resolution curve. Bottom panel: for box sizes 2.5 < Lbox < 10 h−1 Mpc with Δx = 5 h−1 kpc, at the largest scales the smaller boxes show lower rescaled power compared to the large box, likely resulting from both an undersampling of large modes and the lack of large-scale mode coupling. The smallest L = 1.25 h−1 Mpc box sits significantly above the other rescaled power curves. Note: the smallest kNyq for these models is log (k/(s km−1)) = −0.55, which is just off the right edge of the plot.
We find that the large scale power log (k/(s km−1)) < −1.7 is converged for Δx < 40 h−1 kpc, but that 80 h−1 kpc has excessive power. At smaller scales, as seen with the 3D matter density field, the power increases with improved spatial resolution. It is not quite converged by 10 h−1 kpc, with the residual between 10 and 5 h−1 kpc being ∼ 15 per cent for log (k/(s km−1)) > −1.0. We also note the ΓHI rates that are required to match the mean flux; these are noted in the legend in Fig. 5 in units of 10−12 s−1. We see that as the spatial resolution increases, the photoionization rate required to match the observed mean flux decreases; for example, from 80 to 20 h−1 kpc resolution ΓHI drops by a factor of 1.7. Thus, for a given photoionization rate, the high resolution simulations naturally produce more transmission compared to the low-resolution versions.
Using the values along the skewers, the normalized probability distribution functions in the temperature, peculiar velocity, overdensity, and flux (with optical depth rescaling) are shown in the left column of Fig. 6 for different Δx. The main result is that lower resolution simulations show an excess Fpix at intermediate values in temperature and overdensity with respect to the 5 h−1 kpc resolution model. As the resolution improves, these excesses diminish. For the overdensity the excess peaks near the mean density log Δ = 0, highlighting the tendency of a lower resolution simulation to sample more ‘average’ conditions due to larger cell sizes. However, in temperature this excess occurs at log (T/K)∼4.5, which does not encompass the average temperature in these boxes, so some differences may be due to variation in the physics permitted by the differing spatial resolutions. For example, compared even to 10 h−1 kpc, there is a tail of extreme high temperatures in the 5 h−1 kpc simulation that seems to be due to an increased ability to resolve shocks. Generally though, the higher resolution permits excursions to more extreme physical conditions.
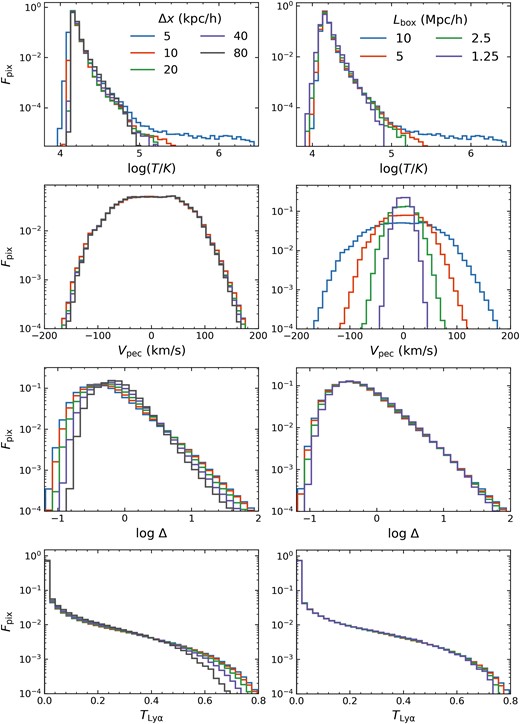
Left column: the fraction of pixels Fpix along 10 000 skewers as a function of the temperature, peculiar velocity, overdensity, and mean flux-adjusted transmission for varying spatial resolutions. Generally, the higher resolution simulations show wider ranges in their pixel physical properties. Right column: same as the left column, but for varying box sizes with a constant spatial resolution of 5 h−1 kpc. Larger boxes result in a larger number of excursions to more extreme values in temperature, velocity, overdensity, and flux, similar to the trend seen with increasing resolution. All results are taken at z = 5.5.
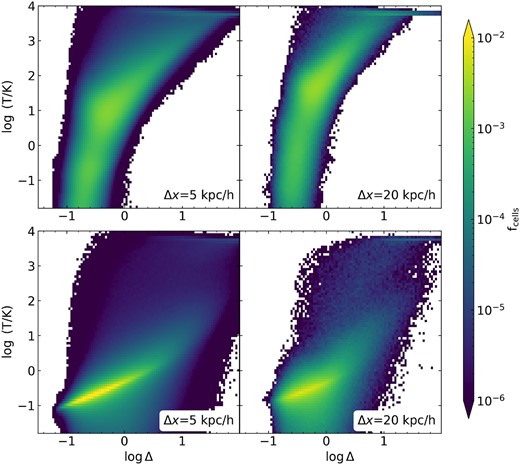
The broader physical spread permitted by the higher resolution simulation is visible also in phase diagrams in the top row of Fig. 7. The typical shape is the same since reionization occurred quite recently in this model; the temperature–density relation is nearly flat as the average temperature is approximately 15 000 K (though dependent on a cell’s neutral fraction). While the 10 h−1 kpc simulation contains cells reaching log (T/K)>6, the 40 h−1 kpc run can barely achieve temperatures of log (T/K)>5.0. This is a combination of the effects of physics due to the different resolutions, but also due to the total number of cells.
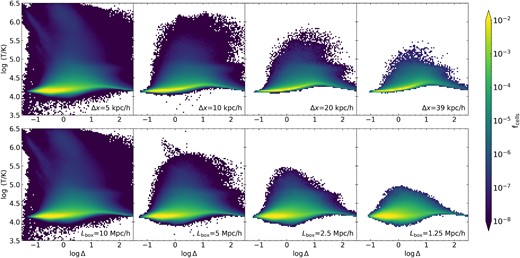
Top row: phase diagrams for 10 h−1 Mpc boxes with flash reionization at zre = 6, with the fraction of cells fcells indicated by colour. Better spatial resolutions result in a wider range of possible physical values for the temperature and density, in particular at higher temperatures, for a fixed range of fcells. However, these represent a small fraction of the total cells. Bottom row: same as in top row, but for varying box sizes with constant resolution of 5 h−1 kpc (the upper left and lower left panels are identical). Moving to smaller box sizes results in fewer excursions to extreme values, especially visible in temperature. Generally for variation in resolution and box size, a reduction in the number of cells used in the model causes a more restricted range of gas properties to be sampled.
The wider variance in physical properties in the high resolution simulation lends itself to the distribution of transmissions shown in the bottom panel of Fig. 6. With increasing resolution, a larger fraction of pixels have either zero flux or TLy α > 0.3. The higher number of high transmission pixels are created by the higher fraction of log Δ < 0 cells, and these also contribute to the lower photoionization rate required to match the mean flux. Conversely, the greater abundance of zero flux pixels arises from the higher number of overdense cells in the high resolution simulations, but their abundance does not significantly affect the mean flux because of their high optical depths. The greater variance about the mean flux also ultimately contributes to the greater power seen in the higher resolution simulations, since σ2 is proportional to the integral over the power spectrum.
3.2 Box size effects when zre = 6
The 3D power in matter with varying simulation box size is plotted in panel c of Fig. 4, for a constant Δx = 5 h−1 kpc. For each box size, the dark matter, and gas curves for each box size converge together for log (k/(h Mpc−1)) < 0.8, but for larger log k the gas generally deviates more, in all cases exceeding PDM. Similar to the trend with decreasing Δx, we see that a larger box size affects the relationship between the dark matter and gas, where the power in gas will exceed that in dark matter at increasingly small k for larger boxes. The power is not yet converged within 10 per cent by Lbox = 10 h−1 Mpc for any physical scale considered here, and still differs by ∼25 per cent between Lbox = 5 and 10 h−1 Mpc.
Examining the Ly α power convergence for these same models in the lower panels of Fig. 5, we find that the smaller the box the greater the normalization of the power curve, such that e.g. the 1.25 h−1 Mpc box has 80 per cent more power than the 10 h−1 Mpc box at log (k/(s km−1)) = −1.0. By Lbox = 5 h−1 Mpc, the power is converged within 10 per cent for log (k/(s km −1)) ≤ −1.7, with some random variation around the 0 per cent residual line. It is possible then that studies of small scale structure may be permissible in small boxes where the larger scale power is not yet converged, although the rate of convergence is not necessarily clear by Lbox = 10 h−1 Mpc. The ΓHI values, noted in the legend of Fig. 5, required to match 〈F〉 decrease with increasing box size, by a factor of 1.5 from Lbox = 1.25 to 10 h−1 Mpc. In the right column of Fig. 6, the overdensity distributions show a similar trend to that seen in the PDFs’ variation with resolution, where a larger box (like for a higher resolution) shows that a wider range of overdensities are simulated. This trend also proves true for high temperatures, but not for low ones, with smaller boxes showing an excess in Fpix with log (T/K) < 4.2 with respect to the 10 h−1 Mpc box.
3.3 Effects of differing reionization histories on simulation convergence
We now turn to examine the changes induced by varying the reionization history. In total, we consider two flash implementations occurring at zre = 9 and 6 representing an early and late (fiducial) reionization, and no reion. indicating a box which is not reionized but that has ΔTre = 20 000 K added in post-processing prior to calculation of the Ly α transmission for the skewers. To provide some visual intuition for the effects, Fig. 8 displays slices in overdensity from three 10 h−1 Mpc boxes with 5 h−1 kpc resolution that have varying reionization implementations. The more recent the reionization event, the less time permitted for the IGM to thermodynamically respond to the reionization heating event. Thus, our selected histories represent cases with ever smaller pressure smoothing lengths, and thus more stringent convergence requirements.
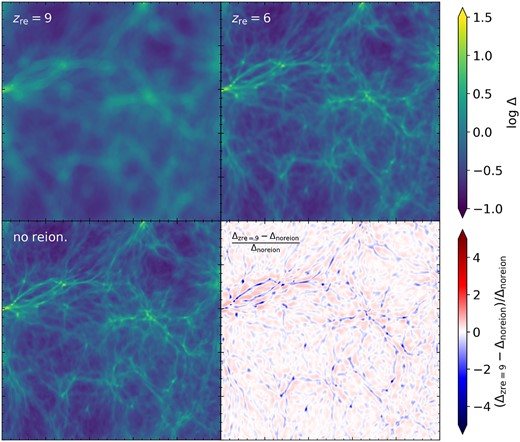
Zoomed-in 2.5 h−1 Mpc overdensity slices with Δv = 90 km s–1, taken from 10 h−1 Mpc boxes with spatial resolution of ∼5 h−1 kpc and varying reionization histories. Two are flash reionized, at z = 9 and =6, and one is not reionized but has ΔTre = 20 000 K added at z = 5.5 in post-processing to mimic a very late reionization. The zre = 9 box has lower temperatures and higher transmission than the later reionization histories. The lower right panel shows the ratio of the zre = 9 box with respect to the no reion. simulation.
Examining the difference in the overdensity fields between the zre = 9 and no reion. cases (lower right panel of Fig. 8), we see that there are significant losses of material from the central regions of filaments with an earlier flash, and gains on their exteriors which are spatially more extended but smaller in magnitude. The increasing pressure smoothing scale is clearly visible in the slice panels of Fig. 8 as a ‘blurring’ effect that increases as the redshift of reionization increases. In the skewer panels in Fig. 9 this same effect is visible as a smoothing of the variation in the overdensity, temperature, and peculiar velocity progressing from later to earlier flash reionization. The broadening effect is also visible in the Ly α transmission, with the zre = 9 showing wider transmission spikes that are also reduced in amplitude.
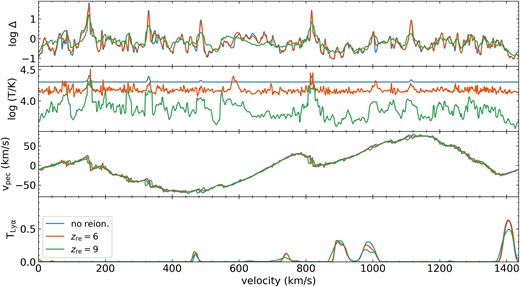
Skewers selected from 10 h−1 Mpc boxes with 5 h−1 kpc resolution with our three simple reionization histories. All models have the same amount of heat added at reionization, Tre = 20 000 K, and so for the no reion. model especially this leads to a nearly isothermal skewer at the injection temperature. Comparing the extremes, no reion. and zre = 9, many narrow variations in density present in the former are extended in the latter, for example in the log Δ field from 800 to 1000 km s–1. In the optical depth-rescaled TLy α skewer in the bottom panel, this translates into higher, narrower peaks in transmission in the later reionizations.
The Ly α power spectra and residuals for varying resolutions in the two flash reionization histories are shown in the left panel of Fig. 10; for each reionization and resolution combination, the residuals in the lower panel are shown with respect to the Δx = 5 h−1 kpc case for each reionization model. First, the PLy α for both flash reionization scenarios increases with resolution for log (k/(s km−1)) > −1.5 with PLy α(Δx = 40 h−1 kpc) lying more than 60 per cent below the Δx = 5 h−1 kpc curve for log (k/s km−1) > −1.0. The models all converge within 10 per cent for log (k/(s km−1)) < −1.6. Despite the differences seen in the 3D power in Fig. 12, the rate of convergence is comparable for these two histories, and the residuals for each with respect to the highest resolution simulation do not differ from one another by more than about 5 per cent. The residuals are consistently smallest for zre = 9, showing a slightly faster convergence.
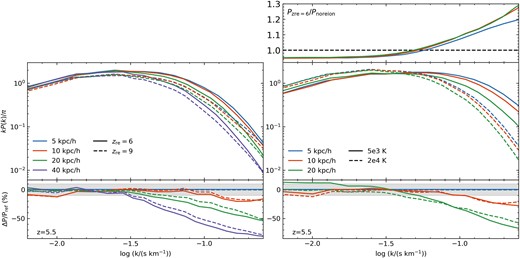
Ly α power spectra in 10 h−1 Mpc boxes with varying reionization histories and changes with resolution. The left panel shows the two flash reionizations (with the zre = 6 curves being identical to those in Fig. 5), while the right panel shows the curves for the no reion. simulation with two different amounts of heat injected in post-processing. Residuals in the bottom panels are taken with respect to the 5 h−1 kpc models, and the 5 h−1 kpc curves are shown with a slight offset from zero for visibility. The shaded grey region indicates the ± 10 per cent region. The top panel on the right shows the ratio of power in zre = 6 to the no reion. with ΔTre = 20 000 K case for the same resolutions and colour-coding as in the other right panels.
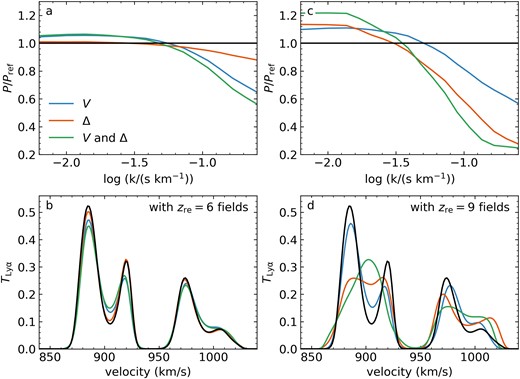
Top row: Ly α power spectra residuals for the unreionized skewers when replacing fields with values taken from a flashed simulation. The V, Δ, and V and Δ labels indicate power spectra generated for an unreionized (but heated in post-processing) simulation with the overdensity, velocity, and both overdensity and velocity fields, respectively, replaced by those from the two flash simulations. Replacement fields are taken from the zre = 6 (left panel) and zre = 9 (right panel) simulations, and the replaced fields are indicated by colour. Bottom panels: TLy α on a segment of an example skewer with the modified fields in coloured lines, and the reference unreionized skewer shown in black. Note that these panels are zoomed-in for improved visibility, and do not reach TLy α = 1.
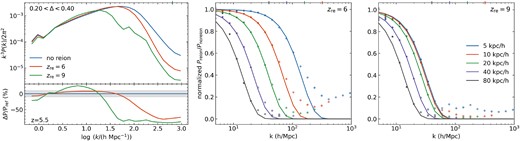
Left panel: the 3D power in baryons for 10 h−1 Mpc, 5 h−1 kpc resolution simulations with the three reionization histories, with an overdensity clip 0.2 < Δ < 0.4 applied to highlight variation at relevant overdensities for the LAF. Using the raw density fields, the power is ∼5 per cent higher for the zre = 6 simulation than for the earlier flash, with a larger difference at high k. Right two panels: the ratio of 3D gas power in reionized simulations with varying resolution to that of a high-resolution, unreionized one. All boxes are 10 h−1 Mpc boxes, and the reference unreionized simulation has Δx = 5 h−1 kpc. The coloured points indicate the measured ratios from the simulations and the midpoint of each k bin. Assuming that Preion/Pnoreion goes as equation (3), we fit to the solid points for N and kps to produce the models, shown as the solid lines. Empty points are not included in the calculation, to avoid oscillatory trends in power at high k (Gnedin & Hui 1998; Puchwein et al. 2023), and also to avoid overfitting on highly sampled k bins.
As seen in the skewers in Fig. 9, there are substantial differences in the temperatures of the zre = 6 and 9 models; on average, the later flash is more than twice as hot, which naturally will lead to greater thermal broadening. To explore the impact of temperature, we plot PLy α for the no reion. simulation with both 5000 K and the fiducial 20 000 K of heat painted on in the right panel of Fig. 10. For 20 h−1 kpc resolution and log (k/(s km−1) > −1.0, the 20 000 K skewers lie more than 25 per cent below the 5000 K ones, though by 10 h−1 kpc this diminishes by about half. However, as with the two flash scenarios, the residual differences between the two heating models with respect to the 5 h−1 kpc simulations do not differ all that much from each other, only by ∼10 per cent for 20 h−1 kpc and 5 per cent for 10 h−1 kpc, showing a similar rate of convergence.
Given that the no reion. case visibly contains the most small scale fluctuations in overdensity in Figs 8 and 9, it is worth remarking that Fig. 10 shows higher small scale Ly α power in the zre = 6 case than in no reion. with ΔTre = 20 000 K, lying markedly higher (see inset panel). One would intuitively expect to see the effects of a larger pressure smoothing scale in the zre = 6 reionization scenario manifest as diminishing power at larger log k compared to the unreionized box.
To demonstrate explicitly that it is primarily the temperature causing this reversal in the expected trend, we explore the impact of varying the other relevant physical parameters. First, we take the skewer set from the no reion. simulation (with the reduced heat injection of 5000 K) and recalculate PLy α; this is the reference case, intended to be affected minimally by thermal broadening. Further, we take these same skewers and replace the peculiar velocity, overdensity, and both of these values on all skewers with those from the two flash reionization scenarios, and calculate the power spectra (PV, PΔ, PV, Δ).4
In Fig. 11, we show the ratios of the raw and modified power spectra, along with the variation of an example skewer segment in response to the replacements. With respect to our ∼ 5000 K, no reion. reference skewer, each replacement considered here results in a reduction in small scale power at log k⪆ − 1.4 and gains at larger scales. When replacing with quantities from the zre = 6 skewers (left column), the power (panel a) decreases progressively with |$P_\Delta$|, PV, and PV, Δ. Alternatively, replacing the overdensity field with that from the earlier flash simulation causes a larger drop in power than replacing the velocity field (panel c), though of course replacing both fields still results in a greater loss of power. We can see the reason for the reversal in the impact of replacing Δ and V in the example skewers in Fig. 9: In the top panel the overdensities in zre = 6 are clearly very similar to those in no reion., with the only visible deviations in TLy α visible occurring at the non-zero local minima and maxima along the curve. In zre = 9, however, the overdensity field is altered, leading to broadened transmission features, obviously a byproduct of the expanded spatial distribution of H i in that reionization scenario. From these results, it is apparent that the peculiar velocities and overdensities of the earlier reionization models both alone and in combination cause a loss in small scale power. Therefore, the increase in small scale power of the zre = 6 simulation with respect to no reion. with ΔTre = 20000 K seen in Fig. 10 arises solely from the confounding effect of temperature.
3.4 Measuring the pressure smoothing scale
Having visually established the effect of a late reionization pressure smoothing and the impact on Ly α power, it is of interest to quantitatively define the pressure smoothing scales in our two flash reionization scenarios. We plot the 3D power for the 10 h−1 Mpc, Δx = 5 h−1 kpc boxes in the left panel of Fig. 12 for the three reionization scenarios.5 In order to select the underdense gas that gives rise to the LAF, we apply an overdensity clip 0.2 < Δ < 0.4, equal to the range used for analysis of the pressure smoothing scale in Puchwein et al. (2023). We show these overdensity-restricted P3D for the three reionization histories, with residuals calculated with respect to the no reion. case. With this adjustment applied, the curves begin to differ substantially, with an earlier reionization showing greater power at log (k/(h Mpc−1)) ≈ 0.8 and reduced power at both smaller and larger wavenumbers, though the dropoff is much greater for larger k (Kulkarni et al. 2015; Oñorbe et al. 2019).
To quantify this dropoff, we replicate the method described in Puchwein et al. (2023), comparing the dimensionless 3D power in baryons in each reionized 10 h−1 Mpc simulation to the corresponding no reion. box. Effectively this is similar to comparing the power in baryons to the dark matter (see e.g. equation 3 in Lukić et al. 2015), although it is not completely identical as the reference no reion. boxes still contain shock heating from structure formation at z < 10 that will affect the distribution of baryons.
The power in the reionized simulation is assumed to follow an exponential cutoff of form
where |$P_\mathrm{re}^{\Delta x}$| and |$P_\mathrm{nore}^{5 \mathrm{kpc/h}}$| are the power spectra for the reionized and unreionized simulations, respectively, with the unreionized reference simulation always being Δx = 5 h−1 kpc. The value N is a normalization constant and kps is the wavenumber corresponding to the pressure smoothing length λps, below which P3D drops precipitously. To perform the fit, we maximize a multivariate Gaussian likelihood where, for the mean power P(k) in each k bin, the uncertainty is given by the standard error of the mean, or the standard deviation in power divided by the number of contributing k modes. We assume that there is no correlation between the different k modes.
The right two panels of Fig. 12 show the ratio |$P_\mathrm{re}^{\Delta x}/P_\mathrm{nore}^{5 \mathrm{kpc/h}}$|, normalized by 1/N, as points, while the model fits are shown as the solid lines. Evaluated by eye, the model does an acceptable job of describing the cutoffs, although the Δx = 80 h−1 kpc case is not steep enough to fit the measured power.6 The curves for varying resolutions in the early reionization case (rightmost panel) show convergence by Δx = 10 h−1 kpc, while the later zre = 6 history in the center panel does not converge even by 5 h−1 kpc. This visual assessment is supported by the fit results for λps (see Table 2). For zre = 9 the rate of change with Δx slows by 10 h−1 kpc, with λps asymptoting to ∼133 h−1 kpc. For zre = 6, even for the change from 10 to 5 h−1 kpc, the fit pressure smoothing scale still drops from 65 to 30 h−1 kpc. This highlights the inability of the low resolution simulations to produce adequate |$P_\mathrm{re}^{\Delta x}$| for larger wavenumbers.
Results of fit to equation (3), with λps = 2π/kps. In columns 4 and 7 we also explicitly give 1/kps to adhere to the convention used for the filtering scale, which excludes the factor of 2π.
| zre = 6 | zre = 9 | |||||
|---|---|---|---|---|---|---|
| Δx | N | λps | 1/kps | N | λps | 1/kps |
| (h−1 kpc) | (h−1 kpc) | (h−1 kpc) | ||||
| 39.0 | 1.77 | 198.2 | 31.6 | 1.82 | 226.7 | 36.1 |
| 19.5 | 1.55 | 115.0 | 18.3 | 1.74 | 163.8 | 26.1 |
| 9.8 | 1.31 | 65.3 | 10.4 | 1.68 | 139.1 | 22.1 |
| 4.9 | 1.13 | 30.5 | 4.9 | 1.66 | 133.6 | 21.3 |
An alternative estimate of the expected smoothing scale could be given by the filtering scale described in Gnedin & Hui (1998), which accounts for the thermal history of the gas, including its current temperature. In a simplified form for high redshifts (Puchwein et al. 2023), this is calculated as
with the sound speed a function of the scale factor a. For our highest resolution simulations, the anticipated filtering scales (calculated using equation (4), with λf = 1/kf) are 11 and 39 h−1 kpc for the late and early reionization scenarios, or ∼2 times the quantities measured via the fits from equation (3) (see columns 4 and 7 in Table 2).
While the low resolution simulations do not accurately reproduce the power |$P_\mathrm{re}^{\Delta x}$|, we find that they can still be used to measure an accurate value for the pressure smoothing scale calculated from the high-resolution simulations. To accomplish this, the Pnore term in equation (3) simply needs to be taken from the same resolution simulation as Pre. The fitted λps increases slightly with worsening resolution, but only up to ∼ 36 h−1 kpc by 80 h−1 kpc for zre = 6. Thus, the pressure smoothing scale measured in this fashion can be determined even when the simulation resolution itself is worse than λps.
3.5 Mean flux convergence
A consistent step in this analysis has been the practice of mean flux matching, rescaling the optical depth in each set of skewers so that the Ly α flux values amount to a reasonable average. But the mean flux itself can serve as a metric of convergence when the photoionization rate is a given; we investigate this as a function of the spatial resolution, box size, and reionization history in Fig. 13. We use a constant photoionization rate of ΓHI = 0.2 × 10⁻¹² s−1, which is required for the 10 h−1 Mpc, 5 h−1 kpc simulation to match 〈F〉 = 0.05 used in the remainder of this work. Using this value, we find that for a constant box size and reionization history, the mean flux will be higher at a higher resolution, and will approximately converge for Δx = 10 h−1 kpc. For a given spatial resolution, a larger box size results in a higher mean flux; for example, at the highest resolution for zre = 6 the mean flux in a Lbox = 2.5 h−1 Mpc is about 70 per cent that of a 5 h−1 Mpc box. This confirms previous results from (e.g. Lukić et al. 2015). Finally, a later reionization also results in a higher mean flux for a given box size and given resolution, likely a side effect of the higher average temperature, which increases the range of overdensities that contribute to high transmission cells.
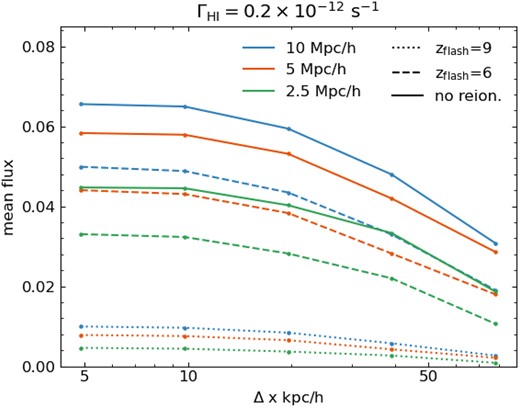
Mean flux in Ly α transmission power spectra at z = 5.5 for a constant UVB, as a function of the spatial resolution. For the given ΓHI (required to match the mean flux in our largest, highest resolution simulation) and reionization history, a larger simulation box results in a higher mean flux given the same spatial resolution; a later reionization gives the same qualitative result.
For constant ΓHI, higher resolution simulations and larger box sizes lead to a higher mean flux. This arises from these simulations increased ability to model low overdensities, as seen in Fig. 6. Thus, the overall convergence of Ly α properties is related to a simulation’s ability to produce an adequate number of low density, highly transmissive cells.
4 DISCUSSION
In the preceding sections, we have demonstrated that converged modelling of small scale gas structures and the LAF at z = 5.5 requires spatial resolutions on the order of 10 h−1 kpc or better, and that these requirements do not vary too strongly with reionization history. We would emphasize that our result does not show the convergence requirements in Nyx, as Chabanier et al. (2023) has already shown it to have sub-10 per cent convergence by Δx = 20 h−1 kpc at z = 5. Our results rather show that resolutions of Δx < 20 h−1 kpc are necessary for z > 5, but further that they are model-dependent, and impacted by choices such as the initial conditions, flash implementation, and heat injection. Therefore, while our focus has been on Nyx, whether higher resolution is required should be a concern for all LAF simulations, dependent on the considered redshift and any model assumptions.
4.1 Comparison with previous studies
Previous investigations have shown that the mean flux values obtained in Ly α power spectra are affected by the resolution and volume of the simulations (Tytler et al. 2009; Lukić et al. 2015; Chabanier et al. 2023). We confirm that smaller boxes result in smaller mean fluxes when subject to the same UVB and these do not converge by box sizes of Lbox ∼ 10 h−1 Mpc. Alternatively, 〈F〉 generally increases for decreasing spatial resolutions until converging, all else being equal. We find that the impact of low resolution, in terms of phase space sampling, is quite similar to that of a small box, perhaps suggesting that some difficulties associated with small boxes can be alleviated with sufficient resolution. Tytler et al. (2009) finds that certain z = 2 Ly α metrics that are not converged in small boxes can be ‘corrected’ to match those found in larger boxes by injecting additional heat, which is naturally present in larger simulations.
We do note some small deviations in the observed rates of convergence compared to other studies. Boera et al. (2019) quantified convergence with resolution and box size when implementing a scaled version of the UVB from Haardt & Madau (2012) starting at z = 15, which itself leads to an early reionization and associated heating (Puchwein et al. 2015; Oñorbe, Hennawi & Lukić 2017a). As in our result, they found that an increase in spatial resolution resulted in greater power for log (k/(s km−1) > −1.6 at z = 4.2, 4.6, and 5.0 snapshots. The residual increased with redshift, exceeding 25 per cent for log (k/(s km−1) > −1.0 for an average spatial resolution of 40 h−1 kpc compared to a 13 h−1 kpc reference simulation, which is quantitatively similar to our results at z = 5.5 with zre = 6. Their results with varying box size differ more from ours, as while both studies show that larger boxes result in less small scale power, they find a residual that increases with k for log (k/(s km−1) > −1.0 between Lbox = 10 and 40 h−1 Mpc boxes, whereas our results show much smaller variation for smaller boxes.
The investigation in Chabanier et al. (2023) similarly uses Nyx, with Lbox = 10 h−1 Mpc, and finds varying rates of convergence. In particular, for PLy α of log (k/(s km−1)) ≈ −1 they find only a 7 per cent difference between 20 and 10 h−1 kpc resolutions, whereas we find ∼20 per cent in our zre = 6 model, and a similar quantity in our earlier flash. However, it is expected that the differences will be greater, as the LAF is known to be less converged closer to reionization (Bolton & Becker 2009; Lukić et al. 2015; Chabanier et al. 2023), and our comparison is at z = 5.5 versus theirs at z = 5, thus maintaining consistency with that expectation.
Wu et al. (2019) explored the impact of thermal fluctuations on the LAF in arepo-rt simulations, including variable inhomogeneous and flash reionization histories. As we describe in subsection 3.3, and as is expected from convention, they find that there is some cancellation of the effects of reduced pressure smoothing by thermal broadening that occurs for reionizations with different timings. They also find that thermal fluctuations associated with an inhomogeneous reionization process introduce a reduction in power at log (k/(s km−1)) > −1.0 of 10 per cent. Thus, our use of a flash reionization may amplify power at small scales and enhance differences between resolutions.
The effect of patchy reionization on pressure smoothing is examined in Puchwein et al. (2023), where the inhomogeneous topology is found to result in losses in small scale power in reionized regions. In that work, which originates the method of measuring pressure smoothing used in Section 3.4, power spectra within the simulation are calculated for subvolumes, and the smoothing scale is determined as a function of the time since the subvolume reionized, Δtre. For a point of comparison, our zre = 9 model reionizes ∼ 500 Myr prior to the snapshot containing our skewers, and produces 2π/kps = 134 h−1 kpc, quite similar to their result (≈129 h−1 kpc, extracted from their fig. 13). The zre = 6 model reionizes too recently to compare with their direct results from patchy reionization, as the smallest Δtre is 200 Myr with a fit 2π/kps ≈54 h−1 kpc. Linearly interpolating between results from our two flash scenarios, we similarly arrive at 2π/kps = 55 h−1 kpc. Their free expansion model, in which the comoving smoothing length varies linearly with time, approximately matches the ≈30 h−1 kpc scale we arrive at for our zre = 6, 5 h−1 kpc resolution simulation at Δtre = 110 Myr. Though not shown here, by rerunning the two flash scenarios with different ΔTre, we find that the heat added at reionization changes the measured kps, with a smaller ΔTre producing a smaller smoothing scale for the same Δtre.
4.2 Caveats
In accordance with the ΛCDM model this investigation has assumed that dark matter is cold, but the introduction of thermal relic warm or fuzzy dark matter models could certainly reduce the resolution requirements for accurate IGM modelling, with the degree of reduction affected by the particle’s characteristic streaming scale. Studies of Milky Way substructure place constraints on mWDM to be ⪆2 keV (Polisensky & Ricotti 2011; Newton et al. 2021; Dekker et al. 2022), while gravitational lensing studies and higher redshift results raise limits to higher masses, which produce even less of an impact on the small scale power (Viel et al. 2013a; Gilman et al. 2020). Viel et al. (2013a), using LAF observations, constrains models to those which deviate from CDM by less than 10 per cent at k = 10 h Mpc−1 (log (k/(s km−1)) = −0.83 at z = 5.5). Therefore, while WDM models are still viable, their masses appear to be high enough that they do not substantially diminish the small scale power with respect to the CDM prediction, and the need for a thorough understanding of the small scale convergence remains.
X-ray heating in some form is guaranteed as X-rays are generated by binary stellar remnants, particularly high mass X-ray binaries (Gilfanov, Grimm & Sunyaev 2004; Fabbiano 2006; Mineo, Gilfanov & Sunyaev 2012). Their long mean free paths would result in heat deposition directly into the IGM, assuming they could effectively escape the dense gas in their sourcing galaxies (Madau, Meiksin & Rees 1997; Das et al. 2017). While this is not strongly constrained, recent 21 cm analyses may imply a non-negligible degree of X-ray heating, placing the 95 per cent constraints on the gas kinetic temperature of 13 < T < 4768 K at z = 7.9 (Abdurashidova et al. 2022; Abdurashidova et al. 2023). If this heating occurs early enough in time, leaving enough time for the IGM to thermodynamically respond, then this would reduce the resolution necessary to accurately model the small scale power.
For simplicity, we have used a flash-type reionization, a limited number of reionization timings, and a constant amount of heat injection. In reality, hydrogen reionization is certainly an inhomogeneous and protracted process, occurring earlier in overdense regions with higher quantities of ionizing photons. While it will realistically start quite early, when the first generations of galaxies formed and began producing ionizing photons, it could not have progressed significantly until the ionizing photon budget was sufficiently large to outpace recombination. On the whole, this would result in substantial spatial variation in the effective smoothing scale, and by extension the overdensity, temperature, and velocity fields. Given that we recover the smoothing scales found in the patchy simulation subvolumes in Puchwein et al. (2023), however, it seems reasonable that accounting for inhomogeneity would result in a PLy α that would be some composite of the cases examined here. For example, Oñorbe et al. (2019) found that flash models produce LAF power spectra similar to inhomogeneous models wherein the reionization midpoint matches zre.
5 CONCLUSIONS
We have studied the convergence of the 3D and Ly α power spectra in Nyx cosmological simulations, focusing in particular on the effects of resolution, box size, and reionization history. With regards to resolution, we find that for a model that flash reionizes at zre = 6, the 3D power converges to within 10 per cent for log (k/(h Mpc−1)) < 1.6 by Δx = 10 h−1 kpc, and that convergence in the dark matter power is better than for gas. PLy α is converged up to log (k/(s km−1)) = −1.0 for Δx = 10 h−1 kpc, but for larger wavenumbers is too low by 10 − 20 per cent with respect to our highest resolution simulation of 5 h−1 kpc. An investigation of the PDFs and temperature–density phase-space diagrams reveals that a higher resolution naturally leads to a wider dynamic range in probed values of temperature, peculiar velocities, and overdensities, so the wings of these distributions are quite populated for Δx = 5 h−1 kpc, and not for example 80 h−1 kpc. Higher resolutions lead to a higher mean flux for a given photoionization rate, and the mean flux convergence for a 10 h−1 Mpc box occurs at Δx ∼ 10 h−1 kpc. The broad strokes of these results are in agreement with those of previous studies.
Turning to the box size, the 3D power is not converged by a Lbox = 10 h−1 Mpc with Δx = 5 h−1 kpc, with the overall power in both gas and dark matter still increasing with Lbox, and the power in gas is less converged than that in dark matter. The Ly α power on scales approaching the mode of the box lies too low for boxes smaller than 10 h−1 Mpc with respect to that with Lbox = 10 h−1 Mpc, although power for log (k/(s km−1)) > −1.5 scales is converged within approximately 10 per cent by 5 h−1 Mpc. Power in a very small 1.25 h−1 Mpc box lies significantly too high matching results from previous studies. The mean flux convergence is significantly affected by the box size, with 〈F〉 for a given ΓHI increasing with box size. Larger boxes, sample a wider range of physical properties than smaller boxes. This naturally leads to greater variation around the mean flux, and an increase in power on small scales.
We have also varied the fiducial assumption of reionization occurring at z = 6, and accounted for very early and very late models. Implementing an early (z = 9) reionization causes a reduction in variance on small scales, and conversely an unreionized model permits survival of this variance to later times. This is due primarily to the stronger small scale fluctuations in overdensity, with gains in the inner regions of filaments and losses in their more extended outskirts; however, the visible degree of this effect in PLy α is also dependent on the temperatures and velocities encountered by the skewers. For example, even gas in an un-reionized IGM will have less large k Ly α power than a reionized one if the heat injection is large enough. The mean flux is affected by the reionization history, with the same resolution and box size having a substantially higher mean flux with a later reionization timing while holding the H i photoionization constant. This is due to the higher temperature permitting greater Ly α transmission in denser gas, similar in impact to varying the photoionization rate.
The physical scale at which the P3D(0.2 < Δ < 0.4) cuts off in low resolution simulations responds strongly to the reionization timing. For zre = 6, we measure λps = 30 h−1 kpc where for zre = 9 it is 133 h−1 kpc . For the later flash simulation this scale is not evidently converged down to our highest resolution of Δx = 5 h−1 kpc, with the measured value drastically changing with increasing resolution, while for an early reionization it converges by Δx = 10 h−1 kpc. However, we also find that low resolution simulations can still reproduce the correct ratio of reionized to unreionized power, and λps is recoverable using simulations with resolution down to 40 or even 80 h−1 kpc. The measured pressure smoothing scales almost perfectly match those inferred in (Puchwein et al. 2023), and adhere to the expectations of their simple expansion model framework. We do find that a smaller heat injection (<20 000 K) at reionization causes a reduced pressure smoothing scale to be recovered using these methods.
In summary, we find that for a simulation using 20 h−1 kpc resolution, the LAF power spectrum at z = 5.5 is not converged within 10 per cent for log (k/(s km−1)) > −1.4, lying 30 per cent lower than a 5 h−1 kpc model at log (k/(s km−1)) = −1.0. Resolutions on the order of 10 h−1 kpc are necessary for a per cent level convergence up to log (k/(s km−1)) < −1.1, but for higher k this may still be insufficient. Further, while this requirement is slightly more stringent for later reionizations, it does not differ significantly, likely as a result of the increased thermal broadening that occurs when reionization is more recent. The focus of simulations of the high-z LAF should therefore be on achieving properties that adequately model the underdensities significantly impacting the Ly α mean flux and the variance in the flux contrast field. We suggest resolutions of 10 h−1 kpc or smaller and boxes larger than 10 h−1 Mpc are necessary to accomplish this.
ACKNOWLEDGEMENTS
CD acknowledges helpful conversations with the ENIGMA group at UC Santa Barbara and Leiden University. This research used resources of the National Energy Research Scientific Computing Center, which is supported by the Office of Science of the U.S. Department of Energy under Contract Number DE-AC02-05CH11231. ZL acknowledges the support from the Exascale Computing Project (grant no. 17-SC-20-SC), a collaborative effort of the U.S. Department of Energy Office of Science and the National Nuclear Security Administration. JO acknowledges support from grants BEAGAL18/00057 and CNS2022-135878 from the Spanish Ministerio de Ciencia y Tecnología.
6 DATA AVAILABILITY
The data will be shared on reasonable request to the corresponding author.
Footnotes
We use ‘resolution’ and ‘spatial resolution’ to refer to the mean interparticle spacing of a simulation, which differs practically between fixed grid Eulerian and SPH-based codes.
Compare to the actual H i photoheating rate in the model UVB of 3.15 × 10⁻¹³ s−1 at z = 5.5.
We note that our assumption of a uniform UVB would not be appropriate for performing a data comparison at z = 5.5, as reproduction of observed scatter in the Ly α opacity requires a fluctuating field for z > 5.4 (Bosman et al. 2022).
It should be noted that this is not physically realistic, as the replacement does not preserve the appropriate post-reionization temperature–density relation, or any other physical relationship between these quantities. It is only an illustrative example to isolate the contribution of each physical parameter to the power spectrum residual.
While not shown here, we find that for the raw 3D power the curves are practically identical; evidently the majority of the power at all physical scales is unaffected by the reionization model used in Nyx.
We find that we need to adjust the k bins permitted in the fit to avoid overfitting on the high values, which are weighted heavily due to the number of k modes contained therein.
References
APPENDIX A: ERROR ADVECTION IN Nyx
Due to numerical effects, it is possible for codes relying on the piecewise parabolic method to generate large errors in the internal energy e when the total energy E is dominated by a kinetic component |$\rho \vec{v}^2/2$|, for example in shocked regions with high-Mach numbers. These errors in the total energy are then advected to neighbouring cells, causing an accumulation of uncertainty in the temperature distribution, although the dynamics of the gas are unaffected. In practice this results in spurious heating and an unphysical vertical bifurcation in the temperature–overdensity plane prior to reionization (Fig. A1). Codes such as enzo apply a corrective method described in Bryan et al. (1995), which compares the value of the internal energy to the total in the adjacent cells
where the threshold η is exceeded, the internal energy is redefined as the value expected from the equation of state; when not, the independently calculated value is left as it is. Fig. A1 shows the ρ − T distribution for an unreionized 2.5 h−1 Mpc box at z = 5.5 for two spatial resolutions with no correction for the internal energy (top row) and with η = 0.1 (bottom row). The uncorrected distribution shows the erroneous bifurcation, and the corrected simulation results in a more reasonable distribution, with the fix having shifted the gas nearer to the adiabatic relation.
Top row: temperature–density phase space for an unreionized 2.5 h−1 Mpc Nyx simulation at z = 5.5 with the default treatment for internal energy, for two resolutions. For an unmodified treatment, the cell distribution is unnaturally bifurcated and does not adhere to the expected adiabatic slope. However, the distortion may begin to improve with increasing resolution. Bottom row: a modified treatment where the transfer of energy is modulated in regions with extreme temperature gradients, with η = 0.1 (see equation A1). Even for the lower resolution considered here of 20 h−1 kpc, the distribution looks approximately correct.
The Ly α power for these simulations (plus some additional resolutions) are shown in Fig. A2, where we find that the differences are, perhaps surprisingly, quite minor. While for 40 h−1 kpc they differ up to 8 per cent at log (k/(s km−1)) = −0.6, for higher resolutions they differ by ≤5 per cent. The simulations including η = 0.1 consistently increase the power for log (k/(s km−1)) > −1.1, and the increase grows with wavenumber, so the reduction in excess heating is preserving additional high-k structure. However, it is unclear if the changes are exaggerated as the implementation of equation (A1) can also cause an oversuppression of shock heating if η is too high.
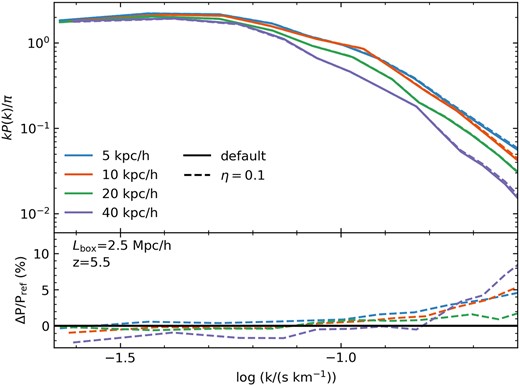
The 1D power in Ly α for the simulations in Fig. A1, with additional resolution Δx = 10 and 40 h−1 kpc, with the unmodified internal energy treatment (solid) alongside the model with η = 0.1 (dashed). The residuals for each resolution are plotted in the bottom panel with respect to the default model. The residuals are all within 10 per cent for this range of wavenumbers.
Overall, these changes are relatively minor compared to the differences introduced by the other variables we have examined here. It may be that, once the heat is injected, all that matters for the scales considered here is whether the appropriate overdensity regime is sufficiently sampled.
APPENDIX B: IMPACT OF DARK MATTER-BARYON STREAMING VELOCITIES
When generating our initial conditions, we have elected to use the code cicass (O’Leary & McQuinn 2012) in the event that the non-zero dark matter-baryon streaming velocity leads to early shock heating, which could result in subsequent removal of small scale structure and an increase in the pressure smoothing. Fig. B1 shows the effect of streaming velocity in the initial conditions on baryonic power at z = 5.5 for an unreionized box. As expected, the non-zero streaming velocity in the 〈v〉 = 30 km s–1 leads to a reduction in small scale power as seen in O’Leary & McQuinn (2012). This could be due to a combination of the physical motion of the particles, or a consequence of increased shock heating at early times.
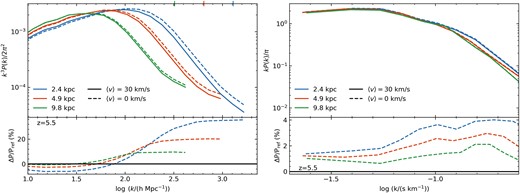
Dimensionless power within 0.2 < Δ < 0.4 in the 3D baryonic matter distribution for an unreionized 2.5 h−1 Mpc box with varying spatial resolutions. We compare the power in the box using our fiducial initial condition setup, with an initial average baryon-dark matter streaming velocity of 30 km s–1, to a setup with v = 0 km s–1. The simulations with v = 0 km s–1 have increased power on scales log (k/(h Mpc−1)) ∼ 1.8 with respect to v = 30 km s–1. The residual between simulations with identical resolutions and different 〈v〉 (bottom panel) increases with decreasing spatial resolution, and is larger at large k. The corresponding Ly α power (right plot) reveals that the differences are quite small at the relevant scales, only 2–4 per cent higher for the zero streaming velocity. However, the residual does increase with increasing spatial resolution.
With ΔTre = 20 000 K, the Ly α power for these two 〈v〉 cases do not show much of a difference. with the higher resolution simulations showing higher power only by a maximum of about 4 per cent. It may be that for a lower heat injection, the discrepancy would be larger. However, given that this is a reasonable temperature to use (Miralda-Escudé & Rees 1994; McQuinn 2012; D’Aloisio et al. 2019), it seems that the contribution to the −1.0 < log (k/(s km−1)) < −0.6 Ly α power from a non-zero streaming velocity is negligible compared to resolution effects.
