


ABSTRACT
We examine the dual [both black hole (BH) active] and offset (one BH active and in distinct galaxies) active galactic nucleus (AGN) population (comprising ∼ 2000 pairs at |$0.5\, \text{kpc}\lesssim \Delta r\lt 30\, \text{kpc}$|) at z = 2 ∼ 3 in the ASTRID simulation covering (360 cMpc)3. The dual (offset) AGN make up 3.0(0.5) per cent of all AGN at z = 2. The dual fraction is roughly constant while the offset fraction increases by a factor of 10 from z = 4 ∼ 2. Compared with the full AGN population, duals are characterized by low MBH/M* ratios, high specific star formation rates (sSFR) of |$\sim 1\, \text{Gyr}^{-1}$|, and high Eddington ratios (∼0.05, double that of single AGN). Dual AGNs are formed in major galaxy mergers (typically involving |$M_\text{halo}\lt 10^{13}\, M_\odot$|), with simular-mass BHs. At small separations (when host galaxies are in the late phase of the merger), duals become 2 ∼ 8 times brighter (albeit more obscured) than at larger separations. 80 per cent of the bright, close duals would merge within |$\sim 500\, \text{Myr}$|. Notably, the initially less-massive BHs in duals frequently become the brighter AGN during galaxy mergers. In offset AGN, the active BH is typically ≳ 10 times more massive than its non-active counterpart and than most BHs in duals. Offsets are predominantly formed in minor galaxy mergers with the active BH residing in the centre of massive haloes (|$M_\text{ halo}\sim 10^{13-14}\, \mathrm{M}_\odot$|). In these deep potentials, gas stripping is common and the secondary quickly deactivates. The stripping also leads to inefficient orbital decay amongst offsets, which stall at |$\Delta r\sim 5\, \text{kpc}$| for a few hundred Myrs.
1 INTRODUCTION
Supermassive black holes (SMBHs) are believed to reside in the centre of most massive galaxies (e.g. Kormendy & Ho 2013). As a consequence of the hierarchical structure formation (e.g. Blumenthal et al. 1984), pairs of SMBHs were found in the merger remnant after mergers between two galaxies. These SMBH pairs slowly spiral towards the centre of mass of the newly merged system and remain at a separation of |$0.1\sim 100\, {\rm kpc}$| for a few hundred Myrs (e.g. Begelman, Blandford & Rees 1980; Milosavljević & Merritt 2001), during which dynamical friction is the major mechanism for driving the orbital decay, and enables the formation of a bound binary.
During the galaxy mergers, active galactic nuclei (AGNs) can be triggered by the gas driven towards the centre of the merger remnant and on to the SMBHs (e.g. Di Matteo, Springel & Hernquist 2005; Hopkins et al. 2008), making these SMBH pairs observable as either dual AGN (when both of the SMBHs are active, e.g. Gerke et al. 2007; Comerford et al. 2009), or offset AGN (when only one of the SMBHs is active, e.g. Steinborn et al. 2016). Because of the tight connections between the galaxy assemblies and SMBH pairs, the detection and characterization of dual and offset AGN are fundamental for understanding the formation and accretion history of SMBHs across cosmic ages.
There have been significant observational efforts to search for these SMBH pairs using various techniques (see e.g. De Rosa et al. 2019, for a comprehensive review of recent observational works). Candidates of dual AGN can be found by searching for double-peaked narrow AGN emission lines in optical spectroscopy (e.g. Comerford et al. 2009; Barrows et al. 2013), with follow-up confirmation through other bands (e.g. McGurk et al. 2011; Shen et al. 2011; Fu et al. 2012). Hard X-ray observations are widely used to detect multiple AGN in a galaxy especially at high redshifts (e.g. Bianchi et al. 2008; Piconcelli et al. 2010; Koss et al. 2018; Lanzuisi et al. 2018), being less affected by contamination from stellar processes and absorption (e.g. Fragos et al. 2013; Lehmer et al. 2016). Among the observed samples, some controversial conclusions arise likely due to the different selection functions from different observational techniques. For example, a number of studies find a higher fraction of dual AGN in galaxies with a closer separation, suggesting that galaxy interactions play a role in triggering of dual AGN (e.g. Ellison et al. 2011; Silverman et al. 2011; Koss et al. 2012; Liu, Shen & Strauss 2012; Satyapal et al. 2014; Kocevski et al. 2015; Koss et al. 2018). On the other hand, there are also studies showing no enhanced AGN activity in mergers compared to a matched control sample of inactive galaxies (e.g. Cisternas et al. 2011; Mechtley et al. 2016).
Despite the massive effort in catching AGN in their dual phase, there have been very limited number of z ≳ 2, close separation (Δr ∼ kpc) pairs, due to the limitation in spatial resolution to distinguish between the close pairs. However, very recently, several groups have been pushing the limit of detecting these high-redshift close pairs using novel observational techniques. For example, Chen et al. (2022c) uses varstrometry with Gaia DR2 (also see e.g. Shen et al. 2019; Hwang et al. 2020; Shen et al. 2021) to identify several z ≳ 2 dual/offset AGN candidates. Silverman et al. (2020) uses the double quasar samples from the Hyper Suprime-Cam (HSC) Subaru Strategic Program and identified 421 dual AGN candidates out to a redshift of 4.5. By looking for distinguished stellar bulges in a sample of AGN host galaxies, Stemo et al. (2021) put up a catalogue of 204 offset and dual AGN candidates down to a separation of |$\lt 4\, {\rm kpc}$|, among which a few are z ≳ 2 AGN. In recent works, Shen et al. (2022) characterizes the statistical properties of galactic-scale quasar pairs using a statistically large sample of 60 double quasars. Mannucci et al. (2022) uses the novel Gaia Multi-Peak method to select over 200 multiple AGN candidates between z = 0.3 ∼ 4 down to ∼kpc separations.
In light of these recent observations of high-redshift AGN pairs, a sample of simulated counterparts is needed to understand the observed sample and its astrophysical implications. In the realm of idealized galaxy-merger simulation, Van Wassenhove et al. (2012), Blecha, Loeb & Narayan (2013), and Capelo et al. (2017) studied AGN activation at various pair separations as well as the impact of the galaxy merger parameters such as the host galaxy mass ratio and morphology. Recent developments in cosmological hydrodynamical simulations also allow studies of dual and offset AGN and galaxy mergers in a cosmological context (e.g. Steinborn et al. 2016; Volonteri et al. 2016; Tremmel et al. 2017; Rosas-Guevara et al. 2019; Ricarte et al. 2021; Volonteri et al. 2022), where the number and the properties of dual AGN relative to all AGNs can be calculated at different redshifts.
Among the cosmological simulations mentioned above, very few were able to produce a statistically large sample of kpc-separation AGN pairs at z ≳ 2, due to several reasons. First, because the dual and offset AGN only make up a few per cent of the total AGN population (e.g. Fu et al. 2011; Liu et al. 2011), and because bright AGNs are already rare at high redshifts, a large |$(\gtrsim 100\, {\rm Mpc/h})^3$| cosmological volume is required to produce those pairs. Moreover, ∼kpc spatial resolution is needed in order to resolve pairs separated by a few kpc. Finally, even for simulations satisfying the above resolution requirements, in most cosmological simulations BHs are pinned to the gravitational potential minimum to avoid artificial kicks of the BH. Consequently, during a galaxy merger, the two central MBHs merge too quickly to be captured at the ∼kpc separation. The BH dynamics modelling after the host galaxy merger is even more important for studying offset pairs (e.g. Barth et al. 2008; Comerford et al. 2012; Allen et al. 2015; Comerford et al. 2015; Müller-Sánchez et al. 2015), which are thought to originate mostly from galaxy merger events.
The Astrid simulation is among the few cosmological simulations that meet the above requirements for studying high-redshift AGN pairs (Bird et al. 2022; Ni et al. 2022; Chen et al. 2022a). First, with a volume of |$(250\, {\rm Mpc}/h)^3$|, Astrid contains >104 massive AGN already at z = 2 ∼ 3, among which |$\gtrsim 3~{{\ \rm per\ cent}}$| are in pairs. More importantly, the high spatial resolution of |$\sim 1.5\, {\rm ckpc}\, h^{-1}$| relative to the volume can resolve AGN pairs at close separations a few hundred Myrs after the host galaxy mergers. Finally, the dynamical-friction modeling in Astrid allows for one of the first studies of the evolution of |$\Delta r \lesssim 1\, {\rm kpc}$| AGN pairs and their activation in the context of cosmological simulations (previously only done in idealized galaxy merger simulations).
This paper is organized as follows. In Section 2, we introduce the Astrid simulation, in particular the massive black hole (MBH) modelling, and describe our selection criterion for the dual and offset AGN from the simulation; in Section 3, we focus on a sample of dual and offset AGN at z = 2, and investigate their properties such as the separation, mass/luminosity distributions, host galaxy mass, AGN activation levels and obscuration, with comparisons with high-redshift observations where possible; then, in Section 4, we characterize the evolution of AGN pairs at z = 3 during and after the host galaxy merger, with an emphasis on the effect of pericentric passages and the difference between the evolution of dual and offset AGN.
2 SIMULATION
The Astrid simulation is a large-scale cosmological hydrodynamic simulation in a |$250\, {\rm Mpc}\, h^{-1}$| box with 2 × 55003 particles. Astrid contains a statistical sample of haloes which can be compared to future survey data from JWST, while resolving galactic haloes down to |$10^9 \, {\rm M}_{\odot }$| (corresponding to 200 dark matter particles). The initial conditions are set at z = 99 and the current final redshift is z = 2. The cosmological parameters used are from Planck Collaboration VI (2020), with Ω0 = 0.3089, |$\Omega _\Lambda =0.6911$|, Ωb = 0.0486, σ8 = 0.82, h = 0.6774, As = 2.142 × 10⁻⁹, ns = 0.9667. The mass resolution of Astrid is MDM = 6.74 × 10⁶h−1M⊙ and Mgas = 1.27 × 10⁶h−1M⊙ in the initial conditions, and our star particles have a median mass of |$10^{5.5}\, \mathrm{M}_\odot$|. The gravitational softening length is |$\epsilon _{\rm g} = 1.5 \, \rm {ckpc}\, h^{-1}$| for both DM and gas particles.
2.1 Black hole modelling
Here, we briefly describe the black hole (BH) modeling used in Astrid most relevant for the dual and offset AGN. For a thorough description of the subgrid models and BH statistics, please refer to Bird et al. (2022), Ni et al. (2022), and Chen et al. (2022a).
Astrid contains models for inhomogeneous hydrogen and helium reionization, baryon relative velocities and massive neutrinos, as well as ‘full-physics’ galaxy formation models including star formation, BH accretion and the associated supernova and AGN feedback. The star formation model is unchanged from Feng et al. (2016), which followed the implementation of Springel & Hernquist (2003). The BH model includes mergers driven by dynamic friction rather than repositioning. Our treatment of BHs largely follows the BlueTides simulation in terms of the BH accretion and feedback, which is based on the earlier work by Di Matteo et al. (2005) and Springel, Di Matteo & Hernquist (2005). The gas accretion rate on to the BH is estimated via the Bondi–Hoyle–Lyttleton–Lyttleton-like prescription applied to the smoothed properties of the 112 gas particles within the SPH kernel of the BH. We allow for short periods of super-Eddington accretion in the simulation, but limit the accretion rate to two times the Eddington accretion rate.
The BH radiates with a bolometric luminosity Lbol proportional to the accretion rate |$\dot{M}_{\rm BH}$|, with a mass-to-light conversion efficiency η = 0.1 in an accretion disc according to Shakura & Sunyaev (1973). We include both thermal (or quasar-mode) feedback and kinetic AGN feedback. In quasar mode feedback, 5 per cent of the radiated energy is thermally coupled to the gas residing within twice the radius of the SPH smoothing kernel of the BH particle. A BH switches to the kinetic mode only when the accretion rate drops below the Eddington ratio χthr, max = 0.05 and the BH mass is |$M_{\rm BH} \gtrsim 10^{8.5} \, \mathrm{M}_\odot$|. The kinetic feedback follows Weinberger et al. (2017), with slightly different parameters. Kinetic feedback energy is deposited as |$\Delta \dot{E}_{\text{kin}} = \epsilon _{\mathrm{f, kin}} \dot{M}_{\mathrm{BH}} c^{2}$|, where ϵf, kin scales with the BH local gas density and has a maximum value of ϵf, kin, max = 0.05. The energy is accumulated over time and released in a bursty way once the accumulated kinetic feedback energy exceeds the threshold |$E_{\mathrm{inj}, \, \mathrm{min}}=f_{\mathrm{re}} \frac{1}{2} \sigma _{\mathrm{DM}}^{2} m_{\mathrm{enc}}$|. |$\sigma _{\mathrm{DM}}^{2}$| is the one-dimensional dark matter velocity dispersion around the BH, menc is the gas mass in the feedback sphere and fre = 5. The released kinetic energy kicks each gas particle in the feedback kernel in a random direction with a prescribed momentum weighted by the SPH kernel. Kinetic feedback is enabled in Astrid at z < 2.4.
To seed MBHs in the simulation, we periodically run a FOF group finder on the fly with a linking length of 0.2 times the mean particle separation, to identify haloes with a total mass and stellar mass satisfying the seeding criteria { Mhalo, FOF > Mhalo, thr; M*, FOF > M*, thr}. We apply a mass threshold value of Mhalo, thr = 5 × 10⁹h−1M⊙ and M*, thr = 2 × 10⁶h−1M⊙.
Instead of applying a uniform seed mass for all BHs, we probe a mass range of the BH seed mass Mseed drawn probabilistically from a power-law distribution:
where |$\mathcal {N}$| is the normalization factor. The minimum seed mass is Mseed, min = 3 × 10⁴h−1M⊙ and the maximum seed mass is Mseed, max = 3 × 10⁵h−1M⊙, with a power-law index n = −1. For each halo that satisfies the seeding criteria but does not already contain at least one BH particle, we convert the densest gas particle into a BH particle.
Instead of repositioning the BH towards the potential minimum, in Chen et al. (2021) we implemented and tested a model for sub-grid dynamical friction (similar to Tremmel et al. 2015, 2017), using a BH dynamical mass of |$M_{\rm dyn} = 2\times M_{\rm DM} = 1.3\times 10^7\, \mathrm{M}_\odot$|. This means that we boost the mass of the BHs to |$M_{\rm dyn} = 2\times M_{\rm DM} = 1.3\times 10^7\, \mathrm{M}_\odot$| only when calculating the acceleration if the original mass of the BH is less than this threshold, in order to avoid the unphysical scattering off of dark matter particles. With this dynamical mass, the orbital decay time-scale of seed-mass BHs is likely underestimated, but for the current work, since we focus on the massive BHs, the dynamical mass does not deviate greatly from the true mass and thus should not affect the sinking time-scale. We set the merging distance to be |$2\epsilon _{\rm g}=3\, {\rm ckpc}\, h^{-1}$|, because the BH dynamics below this distance is not well resolved. We conserve the total momentum of the MBHs during the merger (i.e. MBH, 1v1 + MBH, 2v2 = MBH, remvrem). Moreover, as we do not have repositioning of the BHs to the nearby potential minimum, the BHs have well-defined velocities at each time-step (this is true whether or not we add the dynamical friction). This allows us to apply further merging criteria based on the velocities and accelerations of the BH pair, and thus avoid early mergers of gravitationally unbound pairs.
We follow Bellovary et al. (2011) and Tremmel et al. (2017), and use the criterion
to check whether two BHs are gravitationally bound. Here, Δa, Δv, and Δr denote the relative acceleration, velocity, and position of the BH pair, respectively. Note that this expression is not strictly the total energy of the BH pair, but an approximation of the kinetic energy and the work needed to get the BHs to merge. Because in the simulations the BH is constantly interacting with surrounding particles, on the right-hand side we use the overall gravitational acceleration instead of the acceleration purely from the two-body interaction. We note, however, that the mergers in the simulation following the criterion above do not correspond to the real coalescence of the two MBHs: the typical separations between the MBH pairs are still ∼1 kpc, and the MBH should experience further orbital decay by dynamical friction, loss-cone scattering and drags due to the circumbinary disc before the final coalescence.
2.2 AGN pair selection
Among all MBHs in the simulation at a fixed redshift, we define an MBH pair as two MBHs with a separation of |$\Delta r\lt 30\, {\rm kpc}$| (proper). The upper limit in separation chosen here follows from previous simulation works such as Steinborn et al. (2016). For this work, we only focus on the massive end of our population by restricting to MBH pairs with both MBHs above |$10^7\, \mathrm{M}_\odot$| for two main reasons: first, with the current dynamical-friction model in Astrid, there remain large uncertainties in the dynamics of lower mass MBHs due to the introduction of the dynamical mass; secondly, the low-mass/faint-end luminosity function from most hydrodynamical simulations are high compared with observations, so that including the |$M_{\rm BH}\lt 10^7\, \mathrm{M}_\odot$| MBHs may lead to an overestimation of dual AGN passing certain luminosity thresholds.
Among the large MBHs, we then define AGN as MBHs with bolometric luminosity |$L_{\rm bol}\gt 10^{43}\, \mathrm{erg/s}$|. Dual AGNs are MBH pairs in which both of the MBHs are bright enough to be AGN. There is also a significant population of MBH pairs with only one MBH powering an AGN, while the other remains faint (|$L_{\rm bol} \lt 10^{43}\, \mathrm{erg/s}$|). We define such MBH pairs as ‘one-AGN pairs’, indicating that these are still MBH pairs resulting from mergers between massive galaxies, but only one MBH is powering an AGN. If a one-AGN pair is in the early stage of a galaxy merger, their host galaxies still retain distinguishable bulges, and the inactive MBH may be inferred by the presence of a second bulge close to the AGN host. Following the definition in previous works such as Comerford et al. (2015), De Rosa et al. (2019), and Stemo et al. (2021), we will refer to the one-AGN pairs hosted by two galaxies as ‘offset AGN’. In contrast, some one-AGN pairs are found after their host galaxies have merged. Observationally, such pairs may be very hard to distinguish from a single AGN. We note that sometimes in the literature, ‘offset AGN’ also refers to single AGNs which are found at a large distance from the galaxy centre (e.g. Blecha et al. 2016), or AGN with kinematic offset from their host galaxies that can be observed through offsets in the spectral lines (Comerford & Greene 2014). Note that for the inactive MBHs in the offset pairs, we also require them to have masses |$\gt 10^7\, \mathrm{M}_\odot$|. This is to separate the MBHs that only become inactive during the galaxy merger from a much larger population of low-mass companions around the bright AGN. To avoid confusion with definitions from various works in the literature, in Fig. 1 we show a schematic diagram of each type of objects defined in this work.
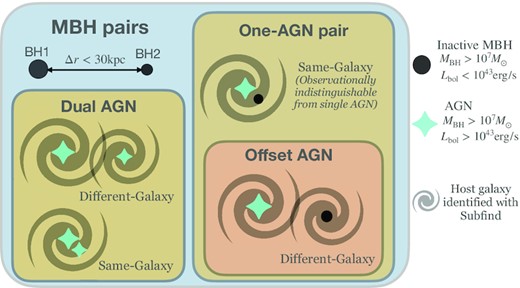
Illustration of different categories of MBH pairs defined in this work. Note that offset AGNs are the subset of one-AGN pairs in which the two MBHs are found in distinct galaxies. See Section 2.2 for the detailed definitions.
After applying the above criterion, there are 2008 (439) MBH pairs with |$M_{\rm BH}\gt 10^7\, \mathrm{M}_\odot$| at z = 2 (z = 3), among which 1087 (329) are dual AGN, 842 (110) are one-AGN pairs, and 79 (10) are no-AGN pairs. For this work, we do not explicitly search for MBH multiplets, so our catalogue is subject to double-counting in the case of multiplets. More specifically, |$\sim 10~{{\ \rm per\ cent}}$| of the AGN in the dual catalogue are involved in triplets, and |$\lt 1~{{\ \rm per\ cent}}$| is involved in quadruplets. This means that there could be up to 20 per cent decrease in our pair counts if those multiplets were to be removed from the pair catalogue. However, here we did not remove these pairs entirely from our catalogue, because these are still tracers of galaxy mergers, and they have shared features with the ‘pure’ dual AGN. For these AGN mutiplets, when we show the mass/luminosity functions or the halo/galaxy mass for individual AGN in the pairs (e.g. in Fig. 6), we avoid counting one AGN multiple times by counting the most massive one as the primary (only once) and the rest as secondaries. For statistics involving the pairs as a single object (e.g. Fig. 4), we will use all three pairs in a triplet. For the two MBHs in the pair, we will refer to the more massive one at the time of observation as the primary MBH (or BH1), and the less massive one as the secondary MBH (or BH2). By the ‘time of observation’, we refer to the fixed redshifts (z = 2 or z = 3) at which we measure the properties of the BHs and host galaxies. We note that the mass ratio may change before or after this fixed redshift, but we do not switch our notation of the primary and secondary with the change in redshift. Note that we assign the primaries and secondaries by the MBH masses instead of the luminosities. We will refer to the more luminous MBH as the brighter AGN, and the less luminous MBH as the fainter AGN.
We identify the host galaxies of the MBHs with Subfind (Springel et al. 2001), where MBHs are treated as baryons in the Subfind when assigned to host galaxies, and are therefore gravitationally bound to the corresponding subhalo. We note that during the close encounters of galaxies, Subfind may not be able to separate the merging systems well. This is especially the case for offset AGN hosts since the gas and stellar disruption is very strong. For this reason, in our analysis we show the properties of one-AGN pairs as well as offset AGN, as some of secondaries among close one-AGN pairs may retain their stellar bulges that our simulation or Subfind is not able to resolve/identify. The observed offset AGN should be bracketed by our one-AGN pairs and offset AGN populations. Finally, when tracing the MBH and galaxy properties back in redshift, we always follow the more massive progenitor if the MBH of interest has gone through prior mergers.
In Fig. 2, we show the dual AGN and one-AGN pairs in a |$250\, {\rm cMpc}\, h^{-1}\times 150\, {\rm cMpc}\, h^{-1} \times 20\, {\rm cMpc}\, h^{-1}$| slice of the Astrid simulation. The background image shows the gas distribution of the simulation, colour coded by the gas temperature where warmer regions correspond to higher temperatures. At the position of each pair, we zoom into the IGM and galaxies surrounding the AGN pairs. The green dots mark all AGN with |$M_{\rm BH}\gt 10^7\, \mathrm{M}_\odot$| and |$L_{\rm bol}\gt 10^{43}\, \mathrm{erg\,s^{-1}}$|. Note that we have shown all of the dual AGN and one-AGN pairs in this slice, and we can see that the pair distribution is a sparse representation of the underlying galaxy/AGN distribution.

Dual AGN and one-AGN pairs in a |$250\, {\rm cMpc}\, h^{-1}\times 150\, {\rm cMpc}\, h^{-1} \times 20\, {\rm cMpc}\, h^{-1}$| slice of the Astrid simulation. The background image shows the gas distribution of the simulation, colour-coded by the gas temperature where warmer regions correspond to higher temperatures. For each dual AGN in the slice, we locate it with white squares in the snapshot and zoom in on their surrounding IGM and host galaxies. About half of the duals are in separated galaxies with |$\Delta r \gt 10 {\rm kpc}\, h^{-1}$|, and the other half have already gone through galaxy mergers. Among all pairs shown, there are two one-AGN pairs, out of which one is an offset AGN (see the definitions in Fig. 1), and we have labelled them in cyan text.
3 PROPERTIES OF HIGH-Z AGN IN PAIRS
In this section, we investigate the properties of the duals and one-AGN pairs at a fixed redshift z = 2. Specifically, we will look at the separation of the pairs, their mass/luminosity function, Eddington ratio, and host galaxy properties compared with the underlying AGN population.
3.1 Dual fraction
The fraction of dual AGN relative to the underlying single AGN population could be a proxy for the number of massive galaxies undergoing galaxy mergers. Observational studies suggest that the fraction of dual AGN is small (e.g. Fu et al. 2011; Rosario et al. 2011). The dual AGN fraction in the local Universe has been estimated from the dual AGN sample of Koss et al. (2012) detected with X-ray spectroscopy to be about 2 per cent. Liu et al. (2011) used a sample from the Seventh Data Release of the SDSS survey at z = 0.1 based on diagnostic emission-line ratios and estimated a dual AGN fraction with |$\Delta r\lt 30\, {\rm kpc}$| to be 1.3 per cent. Constraint on the evolution of dual AGN fraction at higher redshifts is still an ongoing work: recently Silverman et al. (2020) found a dual quasar fraction of |$0.26 \pm 0.18~{{\ \rm per\ cent}}$| from z = 3 to z = 1.5, with no evidence for a redshift evolution (also see Shen et al. 2022, for the fraction of bright double quasars at z ∼ 2). Although our simulation contains a few double quasars by z = 2 with both quasars above |$L_{\rm bol} \gt 10^{46}\, {\rm erg/s}$|, the sample size is still too small for statistical comparison. Here, we still use a selection criterion consistent with previous simulation works and do not directly draw comparisons between our dual fraction and those computed from observations. We refer the readers to Shen et al. (2022) and Chen et al. (2022b) for more information of the bright double quasar pairs in Astrid and a direct comparison with recent observations.
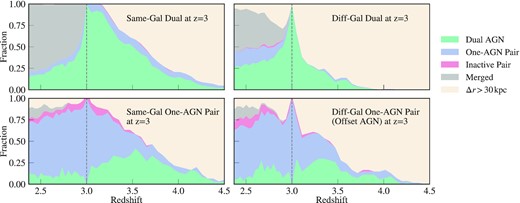
In Fig. 3, we show the redshift dependence of the dual AGN, one-AGN pair, and offset AGN fraction in the Astrid simulation. To compute the fraction, we take the number of dual AGN/one-AGN pairs/offset AGN selected based on the criterion in Section 2.2 as the numerator, and take all AGN with |$M_{\rm BH}\gt 10^7\, \mathrm{M}_\odot$|, and |$L_{\rm bol}\gt 10^{43}\, \mathrm{erg\,s^{-1}}$| as the denominator. From z = 4 to z = 3, the dual fraction shows no redshift dependence and remains |$\sim 2.3~{{\ \rm per\ cent}}$|. After z = 3, we see a slight rise in the fraction of duals to |$\sim 3~{{\ \rm per\ cent}}$|. Above z = 4, there is a drop in the dual fraction to |$\sim 1~{{\ \rm per\ cent}}$|. The fraction of one-AGN pair increases significantly from z = 4 to z = 2, likely due to the increasing number of minor galaxy mergers which is the major sight for the one-AGN pairs (see e.g. Section 3.4, also Tremmel et al. 2018a; Ricarte et al. 2021). Offset AGN makes up |$\sim 30~{{\ \rm per\ cent}}$| of the one-AGN pairs from z = 2−4.

Fraction of dual AGN (solid pink), one-AGN pairs (dashed pink) and offset AGN (pink cross, we only show data points at redshifts where we have the subhalo information of the AGN) among the underlying massive AGN population. We also show the dual fraction with a selection criterion of |$5\, {\rm kpc}\lt \Delta r\lt 30\, {\rm kpc}$| (purple). For comparison, we plot the dual fractions in recent simulation works of comparable box sizes including EAGLE (beige square), HorizonAGN (brown diamond), and Magneticum (grey triangle).
Also in Fig. 3, we compare our result to the dual fraction estimates from previous numerical works at high redshifts (e.g. Steinborn et al. 2016; Rosas-Guevara et al. 2019; Volonteri et al. 2022). Among the three simulations we compare with, HorizonAGN (Volonteri et al. 2022) uses the same distance/mass/luminosity criterion for the duals, and they also adopt dynamical-friction modelling of the MBH dynamics, and indeed our prediction of the dual fraction aligns closely with their predictions.
In contrast, the predictions from Steinborn et al. (2016) (using the Magneticum simulation) and Rosas-Guevara et al. (2019) (using the EAGLE simulation) show a lower fraction of the dual population, and they see a decrease in the dual fraction with redshift. The lower fraction in Steinborn et al. (2016) and Rosas-Guevara et al. (2019) is likely due to their exclusion of close pairs and lower spatial resolution of the MBH merger. To show the resolution dependence of the dual fraction, we also plot the fraction calculated only using duals separated by |$\Delta r\gt 5\, {\rm kpc}$|. With this selection criterion, the dual fraction systematically drops by |$\sim 50~{{\ \rm per\ cent}}$| at all redshifts, but compared with Steinborn et al. (2016) and Rosas-Guevara et al. (2019), our dual fraction remains higher at lower redshifts. This can be a result of the velocity-based merging criterion we have adopted, which was absent from most previous simulations: it has been shown that applying the velocity-based merging criterion can uniquely lead to long-lived pairs of MBHs at galaxy-scale separations (e.g. Tremmel et al. 2018a,b; Chen et al. 2021), such that a larger fraction of high-redshift pairs remains observable as dual AGNs at z ∼ 2.
The different trend in redshift likely arises because the samples in Rosas-Guevara et al. (2019) are not subjected to the |$M_{\rm BH}\gt 10^7\, \mathrm{M}_\odot$| mass cut (see e.g. Volonteri et al. 2022, for the effect of applying various mass and luminosity cuts). Finally, we note that the underlying AGN population is also different in their masses and luminosities, due to the BH model used in each simulation (e.g. Habouzit et al. 2022).
3.2 Pair separations
In Fig. 4, we plot the distributions of the separations between the two MBHs in the dual AGN and one-AGN pairs at z = 3 and z = 2. Among duals and one-AGN pairs, we further categorize the pairs as same and different galaxy duals (one-AGN pairs) according to whether the two MBHs are in the same galaxy or not, where the host galaxies are identified with the subhalo catalogue generated by Subfind. Previously, Rosas-Guevara et al. (2019) and Volonteri et al. (2022) also distinguish between the dual AGN before and after the host galaxy merger, in order to establish the relation between dual AGN activation and the host galaxy merger. In our case, we made this distinction both for the same reason as these works, and because this classification selects out the small-separation pairs which are of particular interest to the most recent observations. Since our simulation adopts a sub-grid dynamical friction model with a stricter merging criterion than most previous works of similar resolutions, we are able to identify more pairs at closer separations, down to |$\Delta r\lt 1\, {\rm kpc}$|.
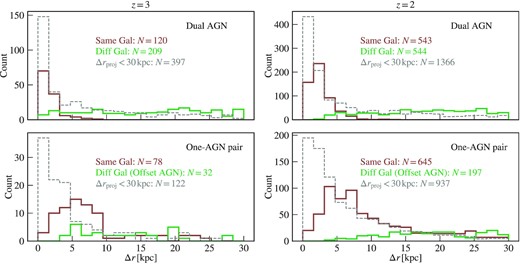
Distribution of the distance between the two MBHs in the dual AGN (top) and one-AGN pairs (bottom) at z = 3 (left) and z = 2 (right). Here, we separate each population by whether the two MBHs are embedded in the same galaxy (brown) or not (green). Between z = 3 and z = 2, the number of duals goes through a three-fold increase, whereas the number of one-AGN pairs becomes seven times larger. We also show the dual AGN and one-AGN pairs selected based on the 2D projected distance instead of the true distance, to mimic the selection from observations (grey dashed). For those pairs, the x-axis represents the projected distance.
On the top panels, we show the separation of dual AGN with |$\Delta r\lt 30\, {\rm kpc}$|. The same-galaxy dual AGN have separations below |$\Delta r=5\, {\rm kpc}$|, with a peak near |$\Delta r=2\, {\rm kpc}$| for both z = 2 and z = 3. Within our sample, the probability of seeing a |$\Delta r\lt 2\, {\rm kpc}$| dual AGN is five times the probability at larger separations. Finally, the distribution is flat at |$\Delta r\gt 5\, {\rm kpc}$|, showing no preferred separation for the different-galaxy duals during the galaxy merger. In previous works, Rosas-Guevara et al. (2019) find a peak of dual separations within |$[20\, {\rm kpc},25\, {\rm kpc}]$|, but they did not consider any pairs below |$5\, {\rm kpc}$|. Steinborn et al. (2016) and Volonteri et al. (2022) also uses various models for the sub-grid dynamical friction, and found a higher probability density of duals at Δr < 5 kpc.
On the bottom panels of Fig. 4, we show the separation distribution of the one-AGN pairs. Contrary to the dual AGN which accumulates near separation of |$1\, {\rm kpc}$|, there are almost no one-AGN pairs at such close separations: most are found at separations around |$5\, {\rm kpc}$|. As we will see in the later sections, this is mainly because the stripping of the secondary host galaxy is most severe when the two merging galaxies are separated by around |$5\, {\rm kpc}$|, causing the secondary MBH to lose its gas supply and become inactive. When the separation of the MBHs gets closer to |$\sim 1\, {\rm kpc}$|, however, the secondary MBH begins to accrete from the gas in the primary galaxy, thereby turning the one-AGN pair into a dual at the |$1\, {\rm kpc}$| separation.
We also see differences between the z = 2 and z = 3 populations. Only 30 per cent of the dual AGN at z = 3 reside in the same host galaxy and are within |$\Delta r \lt 5\, {\rm kpc}$| in separation, but this fraction becomes 50 per cent at z = 2. The evolution from z = 3 to z = 2 also saw a large increase in the fraction of one-AGN pairs: while the number of duals has increased by |$\sim 200~{{\ \rm per\ cent}}$|, the one-AGN pairs has grown by |$\sim 700~{{\ \rm per\ cent}}$|. The growth of the same galaxy, close duals as well as one-AGN pairs is a result of the dynamical friction model and merger criterion in Astrid which prevent dual AGNs from merging immediately after the host galaxy merger (also see the detailed discussion in Section 3.1). During the dynamical-friction dominated orbital decay, an increasing number of AGN go through gas stripping and become one-AGN pairs instead of duals.
Also in Fig. 4, we show the pairs selected with the 2D projected separation Δrproj, rather than the true separation, to mimic the selection function of observations. Here, we take Δrproj to be the projection of Δr on the x−y plane, and we also limit the projection depth to be |$|\Delta z|\lt 100\, {\rm kpc}$|. Using the projected separation increases dual AGN by |$\sim 30~{{\ \rm per\ cent}}$|, meaning that at separations of |$\Delta r\gt 30\, {\rm kpc}$|, there are still a significant number of pairs residing in separated galaxies. Furthermore, using projected separation also increases the probability of pairs at |$\Delta r_{\rm proj}\lt 5\, {\rm kpc}$|. For the one-AGN pairs, however, Δrproj-based selection only includes |$\lt 10~{{\ \rm per\ cent}}$| more pairs, which is a lot less compared with the increase in the dual AGN. With a mass cut of |$M_{\rm BH}\gt 10^7 \, \mathrm{M}_\odot$|, the secondary MBHs rarely fall below |$L_{\rm bol}\lt 10^{43}\, \mathrm{erg\,s^{-1}}$| without severe disruption of the gas during galaxy mergers (see e.g. Fig. 7). Hence, at |$\Delta r\gt 30\, {\rm kpc}$| and |$\Delta r_{\rm proj}\lt 30\, {\rm kpc}$| when the host galaxies have barely interacted, massive but inactive secondaries are hard to find. Another consequence of the lack of large-separation one-AGN pairs is that using the projected distance will bias the observed distance separation towards the lower end and thus raise the resolution requirements.
3.3 Off-centred pairs
As dual and offset AGNs are typically found during/after mergers between massive galaxies, the associated MBHs are likely displaced from the host galaxy centres due to dynamical interactions. The distance between the MBH and the host galaxy centres could correlate with the accretion efficiency of the MBHs, and also indicate the existence of a hidden secondary in case only one AGN is observed.
In Fig. 5, we show the distances between the MBHs in pairs and the centres of their host galaxies (identified by the minimum potential position). The more massive MBH in both duals and one-AGN pairs are usually found very close to the galaxy centres, with a typical separation of |$\sim 0.1\, {\rm kpc}$| (we note that due to our resolution limit, we consider |$\Delta d_{\rm AGN, gal} \lt 2\epsilon _g = 1\, {\rm kpc}$| to be ‘central’). The secondaries among duals are typically more perturbed, with about half of the population ‘off-centre’. None the less, most of them are still within |$5\, {\rm kpc}$| from the host galaxy centre, which keeps them accreting relatively efficiently compared to the secondaries among one-AGN pairs. These secondaries among duals could potentially be detected as merger-induced off-centre AGN if both the AGN and the host galaxy can be resolved.
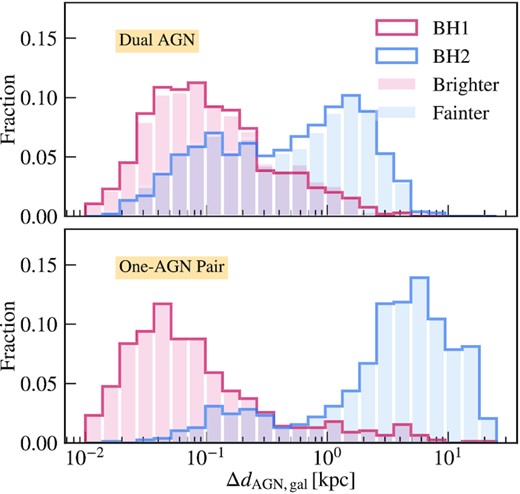
Distribution of the distances between the MBHs in duals (top panel)/one-AGN pairs (bottom panel) and their host galaxy centres (defined as the position of the particle at the potential minimum in each subhalo) at z = 2. While the primary AGN among duals and one-AGN pairs is usually within |$1\, {\rm kpc}$| from the galaxy centre, the majority of the secondaries are quite off-centre (|$\Delta r_{\rm AGN, gal} \gt 1\, {\rm kpc}$|). We distinguish the BHs in pairs both by their masses (solid lines) and their luminosities (shaded). For one-AGN pairs, the more massive BH is always brighter, while for duals some of the brighter AGN is the less massive one (see Fig. 6).
We also show the separation distribution for the brighter and fainter BH in the pair, since it is possible for the less massive MBH to be brighter and visible. However, this is in fact never the case for one-AGN pairs, and even though around 15 per cent of the duals have brighter secondaries (see Section 3.4 for details), the overall distribution of the distance to the host galaxy centre does not change significantly.
3.4 Mass and luminosity
Fig. 6 shows the mass and luminosity functions of the two MBHs involved in duals and one-AGN pairs at z = 2, in comparison with the underlying single MBH population and the MBH pairs without the mass/luminosity cuts. By comparing the thin dotted lines which include all MBH pairs with the solid brown line showing the single MBH distribution, we can see that almost all MBHs with |$M_{\rm BH}\gt 10^6\, \mathrm{M}_\odot$| or |$L_{\rm bol}\gt 10^{43}\, \mathrm{erg\,s^{-1}}$| have a companion BH, typically with a much smaller mass. After applying a luminosity threshold of |$L_{\rm bol}\gt 10^{43}\, \mathrm{erg\,s^{-1}}$| to both MBHs in the ‘dual’ AGN case (note that since this is not how we define our dual AGN and one-AGN pair for this work, we have added quotes when referring to ‘duals’ and ‘one-AGN pairs’ selected only by their luminosities but not their masses), we see a significant drop in the pair fraction shown by the dashed lines. This means that even though all massive MBHs have a close companion, only |$\sim 10~{{\ \rm per\ cent}}$| have a companion that is also luminous. For the ‘one-AGN pair,’ however, since we only apply the luminosity threshold to the more luminous MBH in the pair, the mass and luminosity distributions of the primary MBH are almost not affected at the high-mass end. For the less-luminous MBH in the ‘one-AGN pair,’ selecting only the luminous primary suppresses the mass and luminosity function of the secondary. Requiring the secondary to be underluminous also suppresses the high-mass end, as these pairs would fall into the ‘dual AGN’ category.

Top: Mass functions (left two columns) and luminosity functions (right two columns) of the dual AGN and one-AGN pairs, compared with the underlying MBH population and MBH pairs. The solid red (blue) shows the distribution of the more (less) massive MBH in the dual/one-AGN pairs. The mass and luminosity function of all MBHs are shown in solid grey (we start the bins at |$M_{\rm BH}=10^6\, \mathrm{M}_\odot$| and |$L_{\rm bol}=10^{42}\, \mathrm{erg\,s^{-1}}$| for a clearer view of the high-mass end). To illustrate the effect of our mass threshold at |$M_{\rm BH}\gt 10^7\, \mathrm{M}_\odot$|, we also show the ‘dual AGN’ and ‘one-AGN pairs’ without applying the mass threshold (dashed). Note that for such ‘duals,’ the luminosity threshold of |$L_{\rm bol,1,2}\gt 10^{43}\, \mathrm{erg\,s^{-1}}$| is still present, while for the ‘one-AGN pairs,’ the only constraint is |$L_{\rm bol,1}\gt 10^{43}\, \mathrm{erg\,s^{-1}}$|. Finally, we show the mass and luminosity functions of all MBH pairs with |$\Delta r \lt 30\, {\rm kpc}$| (dotted). Bottom: Mass and luminosity ratio between the less massive MBHs and the more massive MBHs in the duals and one-AGN pairs. One-AGN pairs have greater mass and luminosity contrasts compared with duals. Also note that for duals, the more massive MBHs do not necessarily correspond to the brighter AGN.
Finally, we show the mass and luminosity functions of our dual AGN and one-AGN pair catalogue in solid lines. When adding the |$M_{\rm BH}\gt 10^7\, {\mathrm{M}_\odot }$| threshold to both MBHs in the pair, the dual fraction dropped to |$\sim 3~{{\ \rm per\ cent}}$|. The change in the mass and luminosity functions are not greatly affected by the additional cut on the mass, since among MBHs with luminosities above |$10^{43}\, \mathrm{erg\,s^{-1}}$|, most already have |$M_{\rm BH}\gt 10^7\, \mathrm{M}_\odot$|. The effect on the one-AGN pairs is more significant. Requiring the less luminous MBH in the one-AGN pair to have |$M_{\rm BH}\gt 10^7\, \mathrm{M}_\odot$|, we are explicitly selecting out the rare population of massive but very underluminous secondaries. By making this selection, we can separate the naturally low-luminosity secondaries due to their low mass from the underluminous secondaries that only become faint due to the galaxy merger events.
The mass and luminosity ratios between the two MBHs in the dual AGN and one-AGN pairs are shown in the bottom panels of each figure. Here, we take the ratio of both the mass and the luminosity between the less massive and more massive MBHs (in particular, we do not take the luminosity ratio between the fainter and the brighter AGN). Dual AGN are mostly found in major mergers (|$\gt 80~{{\ \rm per\ cent}}$| duals have q > 0.1), while only |$\sim 20~{{\ \rm per\ cent}}$| one-AGN pairs have q > 0.1 and a significant fraction even has q ∼ 0.01. The luminosity contrast between the two MBHs in the one-AGN pairs is even greater: the primary AGNs are usually >100 times brighter than the secondaries among all one-AGN pairs. For dual AGN, this feature has already been found in observational works such as Koss et al. (2012), and has been seen in various simulations (e.g. Callegari et al. 2009; Steinborn et al. 2016; Capelo et al. 2017). Finally, we also note that in 20 per cent of dual AGN, the less massive MBHs are brighter, but for one-AGN pairs (including offset AGN), the brighter or active AGN is always the more massive one.
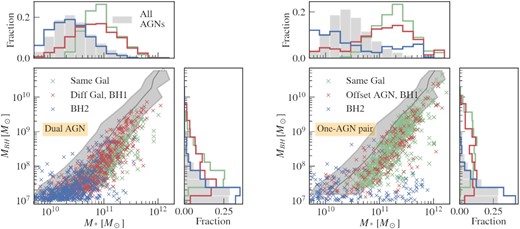
The top panel of Fig. 7 shows the distribution of the Eddington ratios of the pairs at z = 2 compared with all MBHs with |$M_{\rm BH}\gt 10^7\, \mathrm{M}_\odot$| (note that adding an extra |$L_{\rm bol}\gt 10^{43}\, \mathrm{erg\,s^{-1}}$| threshold to the underlying single AGN population does not change our conclusion here, so we do not show an extra line for that population). Compared to the overall AGN population at the same masses with a typical Eddington ratio of ∼0.025, the pairs have a higher level of activation, where the Eddington ratios peak above 0.05. On the bottom panel, we show the mass–luminosity relation for the dual and offset AGN, plotted on top of all MBHs. The primary MBHs follow the underlying MBH distribution but appear slightly overluminous compared to the mean relation of the non-pair population. The blue contour marks the secondary MBHs in the pair, and the ones falling below the dashed line are the secondaries of one-AGN pairs. Comparing these secondaries to the overall MBH population, we can see that the inactive MBHs of the one-AGN pairs are extremely underluminous. In fact, the secondaries among one-AGN pairs appear to be the majority of the |$L_{\rm bol}\lt 10^{43}\, \mathrm{erg\,s^{-1}}$| MBHs with |$M_{\rm BH}\gt 10^7\, \mathrm{M}_\odot$|. It is very rare for an |$M_{\rm BH}\gt 10^7\, {\mathrm{M}_\odot }$| MBH to have |$L_{\rm bol}\lt 10^{43}\, \mathrm{erg\,s^{-1}}$| if it is not involved in a galaxy merger. Finally, we note that another group of low-Eddington ratio MBHs are the heaviest MBHs with |$M_{\rm BH}\gtrsim 10^9\, \mathrm{M}_\odot$| (the blob on the lower right). This is due to the kinetic AGN feedback that actively suppresses the gas accretion among the most massive BHs.

Top: Eddington ratio of the dual AGN and offset AGN (with the more massive one shown in red, and the less massive one shown in blue), compared with the underlying massive MBHs with MBH > 107M⊙ (grey, adding the extra |$L_{\rm bol}\gt 10^{43}\, \mathrm{erg\,s^{-1}}$| constraint does not affect the peak of the distribution). Bottom: Masses and luminosities of BH1 (purple contour) and BH2 (blue contour), plotted on top of all MBHs with masses above |$10^7\, \mathrm{M}_\odot$| (grey cross). The horizontal dashed line marks the threshold for an AGN, and the points below it are the secondary MBHs in a one-AGN pair. Almost all the |$L_{\rm bol}\lt 10^{43}\, \mathrm{erg/s}$| MBHs with |$M_{\rm BH}\gt 10^7\, \mathrm{M}_\odot$| are involved in a one-AGN pair.
The enhancement in the AGN activation among pairs shown above is usually attributed to the gas-inflow during galaxy mergers. Previous simulation works have seen peaks in the pair activation at |$1\sim 10\, {\rm kpc}$| (Van Wassenhove et al. 2012) and |$0.1\sim 2\, {\rm kpc}$| (Blecha et al. 2013). Recent observations by Stemo et al. (2021) have seen a bump in AGN activation at a bulge separation of |$\sim 10\sim 15\, {\rm kpc}$|. Also in the nearby universe, enhanced AGN activation is seen in close pairs with less than tens of kpc separations (e.g. Ellison et al. 2011; Liu et al. 2012).
In Fig. 8, we show the relationship between the dual/offset AGN luminosity and the pair separations. Here, we log-binned the pairs by their separation, and for each bin, we plot the median luminosity enclosed by the interval including 80 per cent of MBHs in that bin. The red (blue) lines correspond to the brighter (fainter) MBH, and the solid (dashed) curves represent the dual/offset pairs. For the dual AGN, both the brighter and the fainter AGN exhibit an increase in luminosity at separations below |$\sim 4\, {\rm kpc}$|. The median luminosities then drop slightly at a separation around |$5\, {\rm kpc}$|, but then increase again at around |$10\, {\rm kpc}$|. Because of the rise in AGN luminosity at Δr < 5kpc, observations targeted at bright quasar pairs could see a larger fraction of close pairs than observations that also include fainter AGN pairs (see also the Appendix of Volonteri et al. 2022). In the observation work by Shen et al. (2022), for example, we can see that using a higher luminosity threshold for the dual selection from our simulation than our sample here results in a larger contrast between the number of small-separation duals and large-separation duals.

The relation between the pair separation and MBH luminosities. At large separations (|$\Delta r \gt 10\, {\rm kpc}$|), the luminosities are not sensitive to the separation. For closer pairs, the luminosity of the fainter MBH is inversely correlated with Δr.
For the offset AGN, the brighter MBH are overall more luminous than the duals, and the luminosity depends less on the pair separation. The fainter MBHs in the pair, however, show an increase in luminosity with smaller separations, and as a result, there are no offset secondaries at separations below |$5\, {\rm kpc}$|. Our Δr−Lbol relation suggests that when observations only limit to |$\Delta r\gt 5\, {\rm kpc}$| pairs, it may be hard to establish a relation between the AGN activation and the pair separation.
3.5 Host galaxies
Fig. 9 shows the MBH−M* relation for the dual AGN and one-AGN pairs and their host galaxies. For the pairs identified in the same galaxy, we plot the total mass of the MBH pair and the mass of their host, while for the different galaxy pairs, we show the mass of each MBH and host separately. The central panels show the scattered relation between MBH and M*, while the top and right panels show the 1D distributions of the galaxy and MBH masses, respectively. To compare the dual AGNs and one-AGN pairs with the single AGN population, we show the distribution of all MBHs with |$M_{\rm BH}\gt 10^7\, \mathrm{M}_\odot$| in grey. For the middle panels, the solid curve shows the median galaxy mass within each MBH bin, and the shaded region encloses the scatter of the middle 95 per cent of the galaxy masses in that MBH bin.
The MBH−M* relation of dual AGN (left-hand panels) and one-AGN pairs(right-hand panels). For different-galaxy pairs, we show the more massive MBH in each pair in red and the less massive one in blue. For same-galaxy pairs, we plot the sum of the MBH masses against their host galaxy mass in green. The grey line shows the median BH mass of all MBHs with |$M_{\rm BH}\gt 10^7\, {\mathrm{M}_\odot }$|. The side panels show the 1D distribution of the MBH masses and galaxy masses.
From the 1D distributions of the MBH and galaxy masses, we can see that the pairs favour the more massive MBHs and galaxies among the overall MBH population. For all MBHs selected with |$M_{\rm BH}\gt 10^7\, \mathrm{M}_\odot$|, the galaxy masses centre around 2 × 10¹⁰M⊙. For the dual AGN, the host galaxy masses peak near |$10^{11}\, \mathrm{M}_\odot$|, regardless of whether the two MBHs are in the same galaxy. This is in general agreement with the findings of Rosas-Guevara et al. (2019), although we see a greater difference between the dual AGN and single AGN host galaxy masses. From the MBH−M* relation of duals with that of all massive MBHs, we see that almost all pairs have galaxy masses above the median relation in the same MBH mass bin, meaning that MBHs in duals are undermassive relative to their host galaxies. A previous study by Steinborn et al. (2016) of the z = 2 pairs using the Magneticum simulation has found a similar trend, where their MBH in pairs are systematically undermassive with respect to the host galaxy masses. Volonteri et al. (2022) also examines the ratio between the MBH and galaxy masses for dual AGNs, and finds that before the host galaxy merger, stripping can lead to ‘overmassive’ MBHs relative to the host galaxy among duals, while after the galaxy merger the MBH can be ‘undermassive’ compared with the merger remnant. In our case, we find that both before and after the host galaxy mergers, the dual-hosting galaxies are generally ‘overmassive’ relative to the MBHs.
For one-AGN pairs, the contrast of the host galaxy masses with those of the single AGN population is even greater. Most one-AGN pairs reside in galaxies of |$M_*\sim 2\times 10^{11}\, \mathrm{M}_\odot$|. This is again a consequence of two factors: the MBHs with a massive but underluminous companion are among the most massive BHs, so they naturally reside in large galaxies; galaxy mergers also play a role, because even when compared with other AGN in the same MBH mass bin, the host galaxies of one-AGN pairs are still larger than the median. A significant fraction even falls into the top 2.5 per cent of the galaxy mass when compared with their similar-mass single-AGN counterparts.
We notice that there is a contrast between our comparisons of the single-AGN and AGN-pair population and the observational results shown in Stemo et al. (2021), who found that the MBH mass and galaxy mass distributions of the AGN pairs are not significantly different from the single AGN samples. One reason for the differences is that our underlying single-AGN samples have a lower MBH distribution compared with their selection function, especially at high redshifts. To mitigate the difference in the underlying AGN sample, in Fig. 10 we raise the luminosity threshold from |$10^{43}\, \mathrm{erg/s}$| to |$10^{45}\, \mathrm{erg/s}$|. We apply the same luminosity threshold to our dual AGN and one-AGN pair samples. The resulting galaxy-mass distribution of the single AGN is closer to the single AGN from Stemo et al. (2021), which peaks around |$10^{11}\, \mathrm{M}_\odot$|. After the stricter luminosity cut, we find that the galaxy mass distribution of the duals is similar to that of the single AGN, with the primary galaxy mass slightly higher. The one-AGN pairs, however, still tend to reside in the high-mass galaxies compared to the underlying single AGN population.

Comparisons between the galaxy mass (left) and specific star formation rate (right) of the dual AGN (top) and one-AGN pairs (bottom) AGN with those of all AGN with |$L_{\rm bol}\gt 10^{45}\, \mathrm{erg\,s^{-1}}$| (grey shadow). For the dual and one-AGN pairs, we have added the |$L_{\rm bol}\gt 10^{45}\, \mathrm{erg\,s^{-1}}$| luminosity threshold to the bright AGN in the pairs for a direct comparison with observations. For reference, we also show the distributions of all AGN under our canonical definition (|$M \gt 10^7\, \mathrm{M}_\odot$|, |$L_{\rm bol} \gt 10^{43}\, {\rm erg\,s^{-1}}$|) in dashed grey. The vertical arrows on the top mark the median of each distribution (the grey arrow corresponds to the |$L_{\rm bol}\gt 10^{45}\, \mathrm{erg\,s^{-1}}$| population).
In the right-hand panels of Fig. 10, we show the specific star formation rate (sSFR) for the pairs with |$L_{\rm bol,1}\gt 10^{45}\, \mathrm{erg\,s^{-1}}$|, compared with all AGN with |$L_{\rm bol}\gt 10^{45}\, \mathrm{erg\,s^{-1}}$|. The sSFR is calculated by summing the gas star formation rate within the half-mass radius of the host galaxy, and then dividing it by the total stellar mass within the half-mass radius. For the |$L_{\rm bol}\gt 10^{45}\, \mathrm{erg\,s^{-1}}$| AGN sample, the sSFR peaks around |$0.6\times 10^{-9}\, {\rm yr}^{-1}$|. The sSFR of the different-galaxy duals is similar to the AGN at similar luminosities and stellar masses, with the primary AGN’s sSFR slightly higher. The hosts of the same-galaxy duals have an overall higher sSFR, with a peak around |$10^{-9}\, yr^{-1}$|. Our statistics are consistent with previous studies using idealized galaxy merger simulations (e.g. Van Wassenhove et al. 2012), who saw peaks in the host galaxies’ SFR after a few pericentric passages, when the duals are separated by a few kpcs. In our case, such duals mostly fall into the same-galaxy dual category. For the one-AGN pairs, even though the galaxy mass is generally higher compared to the overall luminous AGN, the sSFR of the host galaxies does not differ from the underlying AGN sample.
Comparing our sSFR with the observations from Stemo et al. (2021) with similar galaxy masses, we see that our sSFR peaks at a higher value. Moreover, Stemo et al. (2021) do not see an enhancement in the SFR among the pairs compared to their underlying AGN sample, whereas we see a shift towards higher SFR in our duals. One reason is that the sSFR increase is most significant for the same-galaxy duals, typically with separations of |$\Delta r\lt 5\, {\rm kpc}$|. However, the sample selected based on distinct galaxy bulges from Stemo et al. (2021) consists only of the different-galaxy pairs, among which the increase in star formation has not taken place.
3.6 Host halo
Fig.11 shows the host FOF halo mass of the dual AGN, one-AGN pairs, and offset AGN at z = 2, together with the host halo mass of all MBHs with |$M\gt 10^7\, \mathrm{M}_\odot$|. The fraction of pairs in each halo mass bin is shown on the bottom panel. Dual AGN prefer haloes with masses ranging between |$10^{12.3}\, \mathrm{M}_\odot -10^{13}\, \mathrm{M}_\odot$|, and are very rarely found in haloes with |$M_{\rm halo}\gt 10^{13.5}\, \mathrm{M}_\odot$|. The one-AGN pairs and offset AGN typically reside in more massive haloes compared with the duals, with the majority of them found in haloes in the mass range of |$10^{13}\, \mathrm{M}_\odot {\!-\!}10^{14}\, \mathrm{M}_\odot$|. The fraction of one-AGN pairs increases significantly with the mass of the host halo: |$\lt 0.1~{{\ \rm per\ cent}}$| of the |$\sim 10^{12.2}\, \mathrm{M}_\odot$| haloes host a one-AGN pair, whereas |$\sim 40~{{\ \rm per\ cent}}$| of the most massive haloes with |$M_{\rm BH}\gt 10^{13.5}\, \mathrm{M}_\odot$| host a one-AGN pair. There is a similar trend in offset AGN, although the overall fraction is lower.
One explanation for why we find more one-AGN pairs than duals in the most massive haloes is that the deep potential of such massive haloes causes the most gas and stellar disruption of the secondary (also see e.g. Ricarte et al. 2021). Therefore, even though the secondary MBH in the one-AGN pair is initially more massive (as we will show in Section 4.3 and Fig. 20), it falls victim to the gravitational potential around the primary AGN and ends up lurking in the most massive haloes for an extended period.

Top: Host halo mass functions of the same-galaxy dual AGN (green) and one-AGN pairs (purple), plotted with the mass function of all haloes hosting at least one MBH with |$M_{\rm BH}\gt 10^7\, \mathrm{M}_\odot$| (grey, and we checked that adding the extra |$L_{\rm bol}\gt 10^{43}\, \mathrm{erg\,s^{-1}}$| requirement results in a similar line). For hosts of duals and one- AGN pairs, we only count unique haloes, but the fraction of haloes hosting two pairs is less than |$5~{{\ \rm per\ cent}}$|. Bottom: The ratio between the number of dual/one-AGN pair host haloes and |$M_{\rm BH}\gt 10^7\, \mathrm{M}_\odot$| MBH host haloes in each mass bin.
The fact that the most massive haloes preferentially host one-AGN pairs instead of duals also has observational implications: one way to search for dual AGN is by looking for companion AGN around a sample of single AGN. At high redshift, the luminosity threshold for detecting AGN is typically high, and thus the resulting observed AGN sample could be embedded in the most massive haloes. These most luminous AGN are more likely to be involved in one-AGN pairs rather than duals, such that its companion may not be detectable through EM observations albeit its high mass.
3.7 Obscuration of high-redshift pairs
Previous theoretical works have found that the offset in AGN triggering time and the dynamics of the merger are the main factors that explain the paucity of observed AGN pairs (e.g. Van Wassenhove et al. 2012; Blecha et al. 2013). Besides these factors, AGN obscuration could also hinder the discovery of dual AGN. As was discussed in the recent review paper by De Rosa et al. (2019), some AGN in many confirmed dual systems show no (or very weak) explicit AGN evidence in their optical/near-infrared spectra, indicating that these AGN pairs are heavily dust-enshrouded, and there is also strong evidence that they are also heavily obscured in the X-rays. It is also known that 20–40 per cent of AGN are hidden behind Compton-thick column densities (with NH > 1024 cm−2) and ∼75 per cent of the remaining population are obscured, with NH = 1022 ∼ 1024cm−2 (e.g. Ueda et al. 2014; Aird et al. 2015; Buchner et al. 2015) at the peak of AGN activity at redshift z = 0.5 − 3. Meanwhile, Capelo et al. (2017) examined the effect of obscuration in hard X-ray luminosities on resolvable scales (|$\gt 100\, {\rm pc}$|) in their idealized galaxy merger simulations, and found it to be negligible for z = 3 galaxies. In this section, we investigate the role of AGN obscuration in pair detection from our sample of dual AGN and one-AGN pairs.
To calculate the column density for each AGN, we follow the method in Ni, Di Matteo & Feng (2020), and estimate the contribution to the obscuration only due to the gas in the host galaxy. By doing so, we do not account for the AGN obscuration associated with the nuclear torus, on scales of ∼10 pc surrounding the accretion disc of the BH, which is beyond the resolution of cosmological simulations.
In Fig. 12, we show the gas column density of dual AGN and one-AGN pairs binned by the pair separation. For each AGN, we compute NH along 48 random sight lines, and for each Δr bin we show the median and the middle 68 per cent of all lines of sight within that bin. For the one-AGN pairs, we only show the column density of the primary AGN, as the inactive MBH is likely not observable through EM signatures. We find that for both dual AGN and one-AGN pairs, the column density increases with decreasing pair separations. This is particularly true for dual AGN at separations below |$\sim 2\, {\rm kpc}$|: at this separation, most duals have |$N_{\rm H}\gt 10^{22.6}\, {\rm cm}^{-2}$|. Our finding is in line with the recent observational studies by e.g. Ricci et al. (2017), who find that AGN obscuration reaches its maximum at the late galaxy merger stage, when the nuclei of the two merging galaxies are at a projected distance of |$\lt 10\, {\rm kpc}$|. Our results are also in broad agreement with the findings of Capelo et al. (2017), who used higher resolution isolated galaxy merger simulations to evaluate NH, and found that NH around duals are close to |$10^{23}\, {\rm cm}^{-2}$|. They also found such values of NH only have minor effects on the hard X-ray flux of the z = 3 duals but may reduce the flux by half at low redshifts.
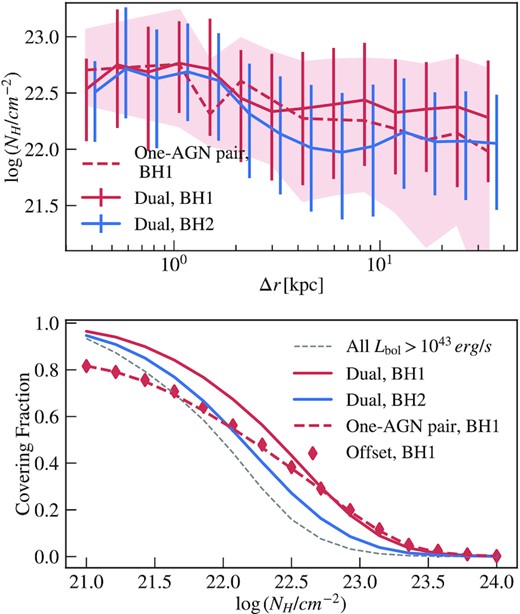
Top: The relation between gas column density NH and pair separations for the dual AGN (the more luminous AGN in red solid, the less luminous AGN in blue solid) and one-AGN pairs (we only show the active AGN in red dashed). For each AGN, we compute NH along 48 random sight lines. The curves show the median NH of all lines of sight in each Δr bin, with the shaded area/vertical lines covering the 16–84th percentile of the distribution. Bottom: The AGN covering fraction of dual AGN, one-AGN pairs and offset AGN assuming various NH thresholds. To compare with the underlying AGN sample (grey), we apply the same Lbol lower limit to the pairs. The covering fraction of pairs is higher than the underlying AGN population.
Between the two AGNs in a dual, the secondary has a larger increase in the obscuration with decreasing pair separation, as it enters into the gas reservoir of the primary AGN. Moreover, we also find that the NH of the secondary varies with the angle between the line of sight and the dual separation: the NH integrated from the line of sight passing near the primary AGN can be three times higher than the NH calculated from the opposite direction, or perpendicular to the dual separation. One implication is that pairs projected at a smaller separation can have a more obscured secondary, compared to pairs viewed at their true separation.
The bottom panel of Fig. 12 shows the AGN covering fraction at different NH thresholds. Here, we take the median overall line of sights for all the pairs to compute the covering fraction at each threshold. To do a fair comparison with the log(Lbol) > 43 AGN sample, we also apply a log(Lbol) > 43 lower limit to both AGN of the duals and the brighter AGN of the one-AGN pair. The AGN covering fraction for the duals is generally higher than that of the underlying AGN population, especially at higher NH thresholds. At log(NH) > 23, only |$\lt 3~{{\ \rm per\ cent}}$| of the sight lines among all AGN are covered, for dual AGN and one-AGN pairs the fraction ranges from 10 per cent to 20 per cent.
4 EVOLUTION OF DUAL AND OFFSET AGN
Up until now, we have focused on the properties of dual AGN, one-AGN pairs, and offset AGN at a fixed redshift of z = 2, in order to make comparisons with observational properties. In this section, we will take advantage of the simulation’s access to the evolution of the pairs across different redshifts and the evolutionary stage of the pairs. For this purpose, we will use the 329 dual AGN and 110 one-AGN pair samples at z = 3, because we would like to trace the evolution of those pairs both before and after the time of observation. When studying the pairs across a range of redshifts, we do not single out offset AGN from one-AGN pairs for two reasons: first, we will focus our analysis on how the secondary becomes inactive during the galaxy merger, and this applies to both offset AGN and the entire one-AGN pair population; secondly, practically we cannot identify offset AGN at all redshifts, because we do not have the subhalo information in all simulation snapshots.
4.1 Connections between pairs across different redshifts
Previous simulations have associated AGN triggering with galaxy mergers, showing that the MBH pairs are observable as duals only during a small fraction of time during the host galaxy merger. Hence, a fraction of the observable duals at z = 3 could have been one-AGN pairs or inactive pairs in the past. Furthermore, some dual AGN may suffer suppression in activation during galaxy mergers, due to the gas outflows and heating induced by the galaxy mergers, and thus become a one-AGN pair at closer separations (e.g. Steinborn et al. 2016). The future of the dual AGNs is also of great interest, as they are progenitors of the MBH merger event. Here we will look into the past and future of AGN in pairs, and draw connections between the pair population at different redshifts.
In Fig. 13, we show the classification of the dual AGN and one-AGN pairs at z = 3 through different times. The top panels show the evolution of the same- and different-galaxy duals, where the width of each coloured band shows the fraction of z = 3 duals falling into each category at different times. We have categorized the pairs into five categories: dual AGN and one-AGN pairs as defined throughout this paper, inactive pairs when the MBHs are separated by |$\lt 30\, {\rm kpc}$| but do not fall into the dual AGN and one-AGN pair categories due to the luminosity threshold (not the mass threshold), mergers when the two MBHs merge in the simulation, and Δr > 30kpc when the two MBHs do not form a pair. For the same-galaxy duals at z = 3, the pairs were formed as early as z = 4.5, and 50 per cent of those duals were observable as duals from z = 3.5 to z = 3. After z = 3, the same-galaxy duals go through rapid mergers because they are already very close at the time of observation, and also have similar masses compared to one-AGN pairs (so that the dynamical friction time is short). By z = 2.4, more than 80 per cent of these duals would merge in the simulation. Volonteri et al. (2022) also investigated the connection between dual AGN and the subsequent MBH mergers, and they reached a similar conclusion that |$\sim 80~{{\ \rm per\ cent}}$| of the same-galaxy duals at z = 3 would merge by z = 2.5. Moreover, most of the remaining 20 per cent same-galaxy duals that do not merge by z = 2.5 never merge in their simulation even after that. We note that mergers in the simulation do not guarantee an MBH coalescence, due to the subresolution dynamical friction time (e.g. Chandrasekhar 1943; Dosopoulou & Antonini 2017; Pfister et al. 2019) and the binary hardening time (e.g. Sesana 2010; Vasiliev, Antonini & Merritt 2015), as well as the possibility of a three-body scattering. For example, Volonteri et al. (2022) showed that after considering these delays, only 40 per cent instead of 80 per cent of their same-galaxy duals would merge by z = 0. None the less, the delay time calculation is largely model dependent, and in the regime where both MBHs are massive, the delay due to the above mechanisms is expected to be within ∼Gyr (see e.g. Chen et al. 2022a). Finally, about 5 per cent of the same-galaxy duals would fall into the one-AGN pair category at other redshifts. They may be observable as duals at z = 3 only because of the time variability of the AGN activation.
Top: The classification of same galaxy dual AGN (left) and different galaxy dual AGN (right) identified at z = 3, throughout z = 2.4 ∼ 4.5. The width of each band corresponds to the fraction of dual AGN falling into each category. We have categorized the pairs into duals (green), one-AGN pairs (purple), inactive pairs (pink), mergers (grey), and non-pairs (beige). Here, the dual AGN and one-AGN pair categories have been previously defined for our work. Inactive pairs are pairs with both MBHs under |$L_{\rm bol}\lt 10^{43}\, \mathrm{erg\,s^{-1}}$|. The merger category refers to simulation mergers, with the merging criterion defined in Section 2. Bottom: the classification of same galaxy one-AGN pairs (left) and offset AGN (right) identified at z = 3, across the same redshift range.
The different-galaxy duals at z = 3 have come to within |$30\, {\rm kpc}$| of each other more recently, with more than 50 per cent forming pairs after z = 3.2. The different-galaxy duals can be viewed as the progenitors of three distinct populations when we look at their evolution after z = 3. At z = 2.5, only |$\sim 25~{{\ \rm per\ cent}}$| of the different-galaxy duals remain to be dual AGN, and most would become small-separation, same-galaxy duals. Another 25 per cent of the different galaxy duals would evolve into one-AGN pairs, due to the gas disruption of the secondaries during the galaxy close encounters. Finally, an increasing fraction of the different-galaxy duals would first become same-galaxy duals, with |$\sim 50~{{\ \rm per\ cent}}$| having merged at z ∼ 2.5. Notably, 10 per cent of the different galaxy duals would be separated by more than |$30\, {\rm kpc}$| after z = 2.5, while |$\sim 25~{{\ \rm per\ cent}}$| are separated to >30kpc shortly after z = 3, before getting closer again. This is because at z = 3, we happened to have caught those duals at their pericentric passage, and they will get into larger separations for some time before settling into |$\Delta r\lt 30\, {\rm kpc}$| orbits.
Next, we show the history of one-AGN pairs at z = 3 on the bottom panels of Fig. 13. Among these pairs, at least 35 per cent were once dual AGN at z ∼ 3.5, and have only become one-AGN pairs between z = 3 and z = 3.5. In fact, if we trace the same-galaxy duals and one-AGN pairs back to z = 3.5, we see an equal fraction of them were once dual AGN, but these z = 3.5 duals then quickly parted ways and evolve into duals and one-AGN pairs at z = 3. We will investigate the reasons for the diverging paths of the duals and one-AGN pairs during this time in later sections.
When we follow these one-AGN pairs to lower redshifts, we can see that once the pair becomes a one-AGN pair, it will very likely remain so for a very long time, without going through mergers or both MBHs becoming active again. The stellar stripping of the inactive MBH leads to very inefficient orbital decay (also see e.g. Tremmel et al. 2018b), such that the MBH stalls at relatively large orbits for up to >Gyrs. During this long period of in-fall time, we also see that |$\sim 10~{{\ \rm per\ cent}}$| of the same-galaxy one-AGN pair will be dissociated, likely due to the disruption from a third galaxy. Finally, only around 5 per cent of the one-AGN pair will be observable as a dual at a given time, mostly during the pericentric passages when the secondary MBH passes through the high-density regions near the primary AGN.
4.2 Pair evolution during galaxy mergers: case studies
Previously, we have found that duals and one-AGN pairs are luminous at a closer pair separation, and that the high-mass ratio, different-galaxy duals may be the progenitor of one-AGN pairs at a closer separation. In this subsection, we will follow some of the z = 3 duals and one-AGN pairs throughout their formation histories, and investigate their surrounding environment and activation during different stages of the galaxy mergers.
In Fig. 14, we show the evolution of the galaxy and gas surrounding the two MBHs in a z = 3 dual AGN during the pair formation, where the galaxies are colour-coded by the stellar age (warmer colours correspond to older stars), and the gas is colour-coded by the gas temperature (warmer colours correspond to higher temperature), with brightness representing the densities for both. The bottom panels show the density profiles of the stars and gas, centred around the two MBHs. The evolution of the luminosities, gas densities, masses, and the separation between the two MBHs in the same pair are shown in the top panel of Fig. 16. For this system, we see that the initially less-massive and inactive MBH (cyan in Fig. 14 and red in Fig. 16) was embedded in a galaxy with newly formed stars and a denser cold gas reservoir. During the galaxy merger, this less-massive MBH goes through very rapid growth by accreting from its surrounding gas and becomes the brighter AGN at the third pericentric passage. Then, after about |$50\, {\rm Myrs}$|, its mass also catches up with the initially more massive MBH (yellow in Fig. 14 and blue in Fig. 16). In the meantime, the central density of its surrounding gas also grows by more than an order of magnitude.
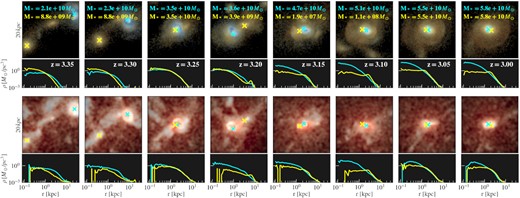
The galaxy (top) and gas (bottom) surrounding a dual AGN during the galaxy merger. The galaxies are colour coded by the stellar age (warmer colours correspond to older stars), and the gas is colour coded by the gas temperature (warmer colours correspond to higher temperature), with brightness representing the densities for both. The crosses mark the two MBHs. The bottom panels show the gas and stellar densities around the MBH with the corresponding colour. The host galaxy masses of the two MBHs are marked with the corresponding colour. The host galaxies merge between z = 3.1 and z = 3.05.
The chosen dual AGN is typical among the few hundred duals, although there is a large variance among the population (see e.g. the distribution shown in Fig. 20). The evolution of this pair is also in concordance with the cases of idealized galaxy mergers presented by Callegari et al. (2009, 2011) and Van Wassenhove et al. (2012) in many aspects: during the galaxy merger, there is a weaker SFR in the initially more massive MBH, while the initially lighter MBH has a higher central SFR during the galaxy merger, building up a dense cusp while outgrowing and disrupting the initially more massive MBH.
In Fig. 15 and the bottom panels of Fig. 16, we show the same information but for a one-AGN pair at z = 3. Compared with the dual AGN example, both MBHs in this one-AGN pair are more massive, but we note that the mass contrast between the two MBHs in this one-AGN pair before the encounter is actually smaller, indicating that minor mergers are not necessary conditions for forming a one-AGN pair. The large-scale environment can also play a key role: the gas temperature surrounding the one-AGN pair is hotter, and we find this to be generally true for the majority of one-AGN pairs, compared with the dual AGN. The hotter ISM/environment can be attributed to these objects being embedded in a more massive halo than a typical dual. This is illustrated in Fig. 11.

Similar to Fig. 14, but for an MBH pair that evolved from a dual AGN to a one-AGN pair after the galaxy merger. The colour ranges of the gas and galaxy images are the same as the dual pair for comparison. The host galaxies merge between z = 3.1 and z = 3.05. After z = 3.1, the secondary galaxy is almost completely disrupted and the secondary MBH becomes an inactive bare MBH. We also note that the gas temperature around the one-AGN pair is higher, and we find this to be generally true among one-AGN pairs.
From the luminosity and gas density shown on the bottom panel of Fig. 16, we can see that between the first and the second pericentric passages, the primary AGN goes through a very rapid phase of gas accretion, when its surrounding gas density increases by two orders of magnitude, and its luminosity also increases by two orders of magnitude. On the other hand, there is a very clear gas stripping of the gas surrounding the secondary MBH immediately after the secondary pericentric passage (marked by the purple solid lines). After this point, the secondary MBH remains inactive for the majority of the time, although occasionally during the pericentric passages of the orbits, the inactive secondary comes very close to the primary, so that its luminosity peaks above |$10^{43}\, \mathrm{erg/s}$|.

The evolution of a dual (top) and an one-AGN pair (bottom), where we traced their luminosity (first panel), surrounding gas density (second panel), masses (third panels), and the pair separation (fourth panel), throughout the pair formation time. We mark the time of the first (dark blue), second (blue) and third (green) pericentric (solid) and apocentric (dashed) passages by the vertical lines.
From the pair separation shown in the fourth panel of Fig. 16, we can also see that another effect of the complete star and gas stripping of the secondary is that the MBH orbit remains large for a very long time: even though the galaxy merger of the one-AGN pair takes place before the dual example shown in the top panel, the MBHs do not merge in the next Gyr.
4.3 Pair evolution during galaxy mergers: population statistics
From the previous section, we have selected two typical cases among the dual AGN and one-AGN pairs at z = 3 to illustrate the difference in their time evolution. Now, we will apply a similar time-evolution analysis but for the whole dual and one-AGN pair population.
Similar to the case studies, the point at which the pericentric passage is identified is shown by the vertical lines of the same colours in the fourth panel of Fig. 16. We show the redshift distribution of the first three pericentric passages for the same-galaxy duals and one-AGN pairs in Fig. 17. Note that duals and one-AGN pairs have similar first-passage redshifts, but the orbital periods of one-AGN pairs are shorter, leading to an earlier third passage among one-AGN pairs (as was illustrated in the cases of Fig. 16). When comparing the pair properties of duals and one-AGN pairs, the difference between the time of the third passage should also be noted, while the comparison between the first two passages is fair. Finally, the time before the encounter is defined to be the first time that the two MBHs are separated by less than the virial radius of the smaller subhalo, such that there has not been any significant dynamical interaction between the gas and stars surrounding the two MBHs.

The redshift distribution of the first three pericentric passages between the same-galaxy dual AGN pairs (left) and one-AGN pairs (right) at z = 3. Duals and one-AGN pairs have similar pericentric passage times, but the orbital periods of one-AGN pairs are shorter, leading to an earlier third passage (as was illustrated in the cases of Fig. 16).
In Fig. 18, we show the Eddington ratio of two MBHs involved in the dual and one-AGN pairs at different stages of the galaxy merger. The top panels show the evolution of the primary MBH at z = 3 (but note that they are not necessarily more massive at all stages), and the bottom panel shows the evolution of the secondary MBH at z = 3. Here we trace the AGN activation before the galaxy merger and during the first, second, and third pericentric passages of the orbits.

The distributions of the Eddington ratio of the z = 3 same-galaxy duals (top) and one-AGN pairs (bottom), traced back to before the encounter galaxies, and the first, second and third pericentric passages of the MBHs. The left column shows the Eddington ratio of the primary AGN, and the right column shows the Eddington ratio of the secondary AGN. We also plot the Eddington ratio of all MBHs with |$M_{\rm BH}\gt 10^7\, \mathrm{M}_\odot$| at z = 3.25 (250 Myr before z = 3, grey) for reference.
For the dual AGN, both MBHs start at an Eddington ratio slightly above 0.1, but there are 20 per cent in each population with Eddington ratios below 0.03. During the first pericentric encounter, we see an increase in AGN activity in both MBHs of the dual: a large fraction of the initially inactive tails activated with an Eddington ratio around 0.1. The divergence between the evolution of the two MBHs happens at the second pericentric passage: the primary AGN becomes more active with Eddington ratios peaking around 0.3, whereas some of the secondaries show a decrease in activity.
The effect of pericentric passages on the one-AGN pairs is more significant, as was shown in the right-hand panels of Fig. 18. From the plot on the left, we can see that the activation of the primary MBH of the one-AGN pairs steadily increases with each pericentric passage. The secondary MBHs (which are inactive at z = 3) start at a similar Eddington ratio as the primary, with an Eddington ratio of ∼0.1, and maintain this Eddington ratio at the first pericentric passage. However, we see a sharp decrease in the Eddington ratio at the second pericentric passage, when half of the secondaries now have Eddington ratios below ∼0.03. At the third passage, the gas stripping is more severe, and the majority of the secondary becomes inactive with Eddington ratios below 0.01. This is illustrated earlier in Fig. 16, where we see a very sudden drop of the secondary MBH’s surrounding gas density at exactly the second pericentric passage.
The strong gas stripping and the deactivation of the initially bright secondary among one-AGN pairs is a result of many factors. For example, Callegari et al. (2011) and Van Wassenhove et al. (2012) find that compared to coplanar galaxy mergers, inclined mergers can have less central star formation in the secondary, leading to disruption at ∼kpc separations rather than efficient pairing. Here, we investigate one specific factor that could affect the degree of gas stripping: the velocity difference between the two MBHs at their first pericentric passages. In Fig. 19, we show the velocity difference Δvfirst between the two MBHs in duals and one-AGN pairs, at their first passage. Compared with duals, one-AGN pairs have a larger velocity offset at the first encounter. This could also be a consequence of the deep potential associated with the large host halo of one-AGN pairs. The high potential energy is transformed into high kinetic energy during the pericentric passages. Since large (|$\Delta v\gt 150\, {\rm km/s}$|) velocity offsets between AGN pairs are also important for pair detection, one-AGN pairs will more likely satisfy the velocity criterion than duals.

The distribution of the velocity difference between the two MBHs in the z = 3 same-galaxy duals (green) and one-AGN pairs (purple) at the first pericentric passage. The dashed lines show the median of each distribution. The one-AGN pairs generally have larger velocity offsets compared to duals.
In Fig. 20, we show the evolution of the MBH masses and host galaxy masses for the duals and one-AGN pairs, as well as the MBH and galaxy mass ratio between the host galaxies. Here, we denote the more massive MBH at z = 3 as the primary (BH1) and its host as gal1, and the less massive MBH at z = 3 as the secondary (BH2) and its host as gal2.
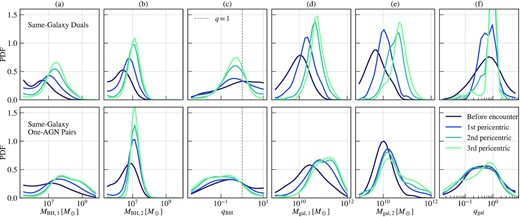
(a/b): The mass evolution of the two MBHs in the dual (top) and the one-AGN (bottom) pairs before the encounter of the host galaxies, and at the first, second and third pericentric passages between the MBH pair. Here, BH1 is the more massive MBH at z = 3, and BH2 is the less massive MBH at z = 3. (c): Mass ratio between the two MBHs in the pair. (d/e): The stellar mass of the host galaxies for each MBH in the dual and one-AGN pairs. If the galaxies of the two MBHs merged, then we show the mass of the merger remnant. (f): The evolution of the galaxy mass ratio between the galaxy hosting the secondary MBH and that hosting the primary MBH.
Before the encounter of their host galaxies, MBHs in duals have typical BH masses below |$10^7\, \mathrm{M}_\odot$|, and a subset as low as |$M_{\rm BH}\lt 10^6\, \mathrm{M}_\odot$|. The one-AGN pairs start with typically higher masses than duals, with about 50 per cent of one-AGN pairs with BH masses above |$10^7\, \mathrm{M}_\odot$| before their host’s first encounter. During the interaction of their host galaxies, the primary MBHs, in both the duals and one-AGN pairs, accrete a significant amount of mass, and by the end of the third pericentric passage, the peaks, in the respective BH mass distributions, shift up by an order of magnitude. This is expected from the high Eddington ratio of the primary BH in duals and one-AGN pairs during this period shown in Fig. 18. As for the secondary MBHs in duals, the BH mass growth is less significant, but most secondaries still reach a mass of |$10^7\, \mathrm{M}_\odot$| by the second passage. However, after this point, the growth stalls and the masses of the secondaries do not go much beyond |$10^7\, \mathrm{M}_\odot$|. Notably, |$\gtrsim 50~{{\ \rm per\ cent}}$| of duals have a mass ratio greater than unity before the host galaxy encounter, meaning that the initially less massive MBH among duals ends up accreting more mass during the galaxy merger and becomes the primary at z = 3.
We also see similar trends for the respective host galaxy masses of duals and one-AGN pairs. Before the first encounter, the primary MBHs of the duals reside in galaxies with masses between |$10^9\, \mathrm{M}_\odot$| and |$10^{11}\, \mathrm{M}_\odot$|. The secondary galaxy is generally slightly less massive, with distribution peaked near |$5\times 10^9\, \mathrm{M}_\odot$|. Notably, none of the dual pairs has a galaxy mass above |$10^{11}\, \mathrm{M}_\odot$| before the encounter. Now looking at the time evolution of the masses, we see that the primary galaxy mass grows by an order of magnitude during the few hundred Myrs of the orbital passages. The galaxy mass of the secondary grows even faster, and by the time of the third pericentric passage, the majority of the two hosts have already merged and thus share the same galaxy mass.
The evolution of the mass ratio between the two MBHs in the pairs and between their host galaxies is particularly worth noting. Observational studies such as Comerford et al. (2015) found that all dual AGN and dual AGN candidates in their sample share the feature that the MBH in the less luminous galaxy always has the highest Eddington ratio. From the host galaxy mass ratio of our dual AGN sample, we see that although the distribution of the secondary’s host galaxies does initially peak at a lower value (consistent with observations), about 30 per cent of the duals have an original galaxy mass ratio above unity. This means that 30 per cent of the more massive MBH in the duals at z = 3 starts off residing in the smaller galaxy, which then picks up a lot of its mass during the galaxy merger. Steinborn et al. (2016) also saw a similar trend in their sample of one-AGN pairs. Volonteri et al. (2022) also studies the galaxy mass evolution of the dual AGN hosts before the galaxy merger by looking at the evolution of a sample of dual AGNs at z = 1. In their sample, qgal almost always decreases with time before the galaxy mergers, whereas we see a larger mass growth in the galaxy that hosts the secondary AGN. Our result is in agreement with high-resolution hydrodynamical simulations of galaxy mergers, which find that the Eddington rate is higher for the AGN in the less massive of the two merging galaxies (Capelo et al. 2015). Van Wassenhove et al. (2012) also produced situations where the less massive BH accretes at a higher Eddington fraction until the less massive galaxy’s gas is lost to ram pressure stripping. The higher mass gain in the less massive galaxies can happen if the less massive galaxies have higher gas fractions, or if the gas accretion is more efficient in less massive galaxies due to their stronger gravitational instabilities during mergers.
5 CONCLUSION
In this work, we characterize the properties and evolution of dual AGN, one-AGN pairs, and offset AGN at z = 2 ∼ 3 within the Astrid simulation, identified with the canonical |$L_{\rm bol,12}\gt 10^{43}\, \mathrm{erg\,s^{-1}}$|, |$M_{\rm BH,12}\gt 10^7\, \mathrm{M}_\odot$| and |$\Delta r\lt 30\, {\rm kpc}$| thresholds (|$L_{\rm bol,2}\lt 10^{43}\, \mathrm{erg\,s^{-1}}$| for one-AGN pairs, and offset AGN are one-AGN pairs residing in separate galaxies). At these redshifts, dual and offset AGN pairs are very rare (with a number density of |$\sim 10^{-5} \, {\rm cMpc}^{-3}$|), but with the large volume of Astrid, we are able to identify a statistically large sample of AGN pairs (1087 duals, 842 one-AGN pairs, and 197 offsets at z = 2; 329 duals, 110 one-AGN pairs, and 32 offsets at z = 3). Having included an on-the-fly subgrid dynamical friction prescription in Astrid, we can trace the MBH orbits down to the resolution limit of |$\sim 3\, {\rm ckpc\, h^{-1}}$| (|$\sim 1\, {\rm kpc}$| at z = 2), and capture tens of dual AGN at (small) kpc separations.
Among the massive (|$M_{\rm BH}\gt 10^7\, \mathrm{M}_\odot$|) and luminous (|$L_{\rm bol}\gt 10^{43}\, \mathrm{erg\,s^{-1}}$|) AGN at z = 2, the dual fraction is 3 per cent with separations below |$30\, {\rm kpc}$|. Another 2.2 per cent (0.5 per cent) of the AGN are involved in one-AGN (offset) pairs, where the secondary is massive but not luminous (with |$L_{\rm bol}\lt 10^{43}\, \mathrm{erg\,s^{-1}}$|). We do not see a strong redshift dependence in the dual fraction from z = 2 to z = 4, but the fraction drops below 2 per cent above z = 4.
Out of the z = 2 dual AGN, |$\sim 50~{{\ \rm per\ cent}}$| are AGN within the same galaxy and separated by |$\lt 5\, {\rm kpc}$|. The number of duals increases with decreasing separation, and over half of the same-galaxy duals are found at separations below |$2\, {\rm kpc}$|. For the dual AGN residing in different galaxies, we do not see a strong separation dependence in the number of duals. Among the offset pairs, over 80 per cent are found at separations between |$5{\text{ and}}10\, {\rm kpc}$|. Offset pairs are rare at smaller or larger separations because their formation involves both strong gas stripping which becomes most effective at |$\lt 10\, {\rm kpc}$| scales, and large enough separation between the pair such that the two MBHs are not accreting from the same gas reservoir (which would equalize their luminosities).
The luminosities of both AGN in duals increase by up to an order of magnitude with decreasing separation below |$\Delta r=5\, {\rm kpc}$|, indicating that observations with high-luminosity threshold could bias towards close pairs (if the spatial resolution allows for detection of those pairs). None the less, we find that the gas column density of duals also increases with decreasing separation, which adds complication to the detection of the close pairs. At larger separations, we find indications of an enhancement in the dual luminosities at |$\Delta r=10\!-\!15\, {\rm kpc}$|, similar to the result shown in Stemo et al. (2021). We then confirm with the time evolution analysis of the duals AGN that there is an enhanced AGN activity among both AGN in the pair following the first pericentric passage, which could lead to this bump.
The details in dynamical interaction during galaxy mergers play a crucial role in explaining the emergence of the dual AGN, one-AGN pair, and offset AGN populations. Compared with the typical Eddington ratio of ∼0.025 among the MBHs with |$M_{\rm BH}\gt 10^7\, \mathrm{M}_\odot$| in the simulation, both the dual AGN and the active AGN in the offset AGN correspond to BHs with an increased level of activity with Eddington ratios peaking around 0.05. Following each pair through the initial stages of galaxy mergers, we find that the AGN activity of the primary BH in both duals and one-AGN pairs increases with each pericentric encounter of the pair due to the enhanced gas supply brought in by the galaxy merger, whereas the secondaries suffer from various degrees of gas stripping mostly starting from the second pericentric passage and are thus tend to be less active over time. The secondary MBHs of the one-AGN pairs experience the most severe/complete stripping, and typically remain inactive on orbits with |$\Delta r\gt 2\, {\rm kpc}$| for a few hundred Myrs. For the secondaries among duals, the central stellar bulges are not completely disrupted during the galaxy merger. Thus, |$\gt 80~{{\ \rm per\ cent}}$| these secondaries can go through more efficient orbital decays towards a simulation merger, usually within |$500\, {\rm Myrs}$|. The host-galaxy disruption among one-AGN pairs also implies that dual/offset candidates selected through distinguishable galaxy bulges (e.g. Stemo et al. 2021) are more likely dual AGN pairs with one of the AGN hidden.
By further investigating the host galaxies of the dual and offset AGN, we find that MBHs involved in duals and offsets are undermassive relative to their hosts, with an MBH/M* ratio below the median value of the similar-mass MBHs. One possible reason is that the triggering of star formation preludes the phase of high MBH accretion during galaxy mergers (also see e.g. Callegari et al. 2011; Van Wassenhove et al. 2012). Indeed, we find that the pair-hosting galaxies show an enhanced sSFR compared with galaxies of similar masses, especially after the merger of the two hosts.
Notably, there is a switch between the primary and the secondary MBH as well as in their host galaxy mass in |$\sim 50~{{\ \rm per\ cent}}$| of dual AGN during the galaxy merger: the initially less massive MBH embedded in the smaller galaxy ends up becoming the primary AGN shortly after the galaxy merger. This switch mostly takes place after the second pericentric passage between the two BHs/AGN. Our finding is in concordance with higher resolution galaxy merger simulations (e.g. Capelo et al. 2015) as well as recent observation results (e.g. Comerford et al. 2015). This may give rise to a significant population of bright off-centre AGN in the smaller companion galaxy.
The large separation, different-galaxy dual AGNs are progenitors to both duals and one-AGN pairs at closer separations. Whether a large-separation dual evolves into a close-separation dual or one-AGN pair depends largely on the level of gas and star stripping during the first three pericentric passages. The secondary in one-AGN pairs started with a similar level of activation as the secondary of dual AGN, and are even more massive before the galaxy mergers, but they show a sudden decrease in the AGN activity by the third pericentric passage. One reason for the more severe gas stripping among one-AGN pairs is that they preferentially reside in some of the most massive haloes and have the deepest gravitational potential. The velocity difference between the one-AGN pairs at the first pericentric passage is higher compared with the duals. Other factors such as the rotation of the galaxies relative to the orbit, and the angle of the initial galaxy merger also play important roles, but we do not explicitly quantify these effects from our samples.
In this work, we do not explicitly separate the multiple AGN systems from the pairs as in e.g. Volonteri et al. (2022). None the less, we have checked that the multiple AGN systems make up |$\lt 10~{{\ \rm per\ cent}}$| of all pairs and do not have a large impact on the overall statistics. We defer further study of triples and quadruple systems in Astrid to upcoming work.
ACKNOWLEDGEMENTS
Astrid was run on the Frontera facility at the Texas Advanced Computing Center.
TDM and RACC acknowledge funding from the NSF AI Institute: Physics of the Future, NSF PHY-2020295, NASA ATP NNX17AK56G, and NASA ATP 80NSSC18K101. TDM acknowledges additional support from NSF ACI-1614853, NSF AST-1616168, NASA ATP 190084, and NASA ATP 80NSSC20K0519, and RACC from NSF AST-1909193. YN acknowledges support from McWilliams Graduate Fellowship. SB acknowledges funding from NASA ATP 80NSSC22K1897. AMH is supported by the McWilliams Postdoctoral Fellowship. MT is supported by an NSF Astronomy and Astrophysics Postdoctoral Fellowship under award AST2001810.
DATA AVAILABILITY
The code to reproduce the simulation is available at https://github.com/MP-Gadget/MP-Gadget, and continues to be developed. Text file forms of the data presented here as well as scripts to generate the figures are available. The dual and offset catalogues including the MBH information and the host galaxy properties are available upon request.
