


ABSTRACT
We present results of the spectroscopic study of the chemically peculiar star BD +30°549, which is a bona fide member of the young NGC 1333 star-forming region. We found that the star possesses negligible rotation and a helium-weak spectroscopic pattern with strongly enhanced Si ii and Si iii lines. The fundamental parameters of the star, Teff = 13 100 K and log (L/L⊙) = 2.1, indicate that its age is about 2.7 Myr and that its position on the Hertzsprung–Russell diagram is at the end of the pre-main-sequence evolutionary track, close to the zero-age main sequence. Abundance analysis reveals the modest deficit of almost all elements, with the exception of Si , Fe , Ca and P, which are overabundant. We performed non-local thermodynamic equilibrium (non-LTE) calculations for Si ii/Si iii, Mg ii and Ca ii in order to check the influence of departures from LTE on line formation. Non-LTE calculations lead to much better reproduction of individual silicon line profiles, but do not completely remove the abundance discrepancy between Si ii and Si iii lines. We also investigate the effects of possible chemical stratification in BD +30°549. We suspect that the ‘Si ii/Si iii anomaly’ observed in the BD +30°549 spectrum arises under the combined action of the vertical and horizontal abundance gradients and non-LTE effects. We suppose that the evolutionary status and phenomena observed in BD +30°549 indicate that conditions favourable for the selective diffusion and formation of the surface chemical composition peculiarities (slow rotation and stabilization of the atmosphere) could already be built up at the pre-main-sequence phase.
1 INTRODUCTION
About 15–20 per cent of stars on the upper main sequence (MS) represent peculiar spectra, which are indicative of the severe anomalies in surface chemical composition (for reviews, see Smith 1996; Romanyuk 2007). The subgroup of helium-peculiar stars with either weakened or enhanced helium lines is considered to be an extension of the sequence of magnetic Ap/Bp stars in the region of higher temperatures. Helium-peculiar stars are encountered among the spectral classes ∼B3–B8 and many of them also host large-scale magnetic fields with an intensity of ∼103 G. It is believed that the vertical abundance gradients in the atmospheres of magnetic chemically peculiar (CP) stars and, hence, the inhomogeneities of their surface elemental composition are developed by atomic diffusion processes (Michaud 1970; Michaud, Alecian & Richer 2015). It is clear that the diffusion can be sufficiently efficient and leads to the build-up of observable strong abundance inhomogeneities only in the absence of the macroscopic mixing caused by convection, turbulence or meridional circulation due to the axial rotation of the star.
The exact evolutionary stage when atmospheric stabilization and formation of the vertical abundance gradients occurs is still unknown. The vast majority of CP stars are the MS objects (Kochukhov & Bagnulo 2006). However, there is evidence – from the evolutionary trend in abundances (Bailey, Landstreet & Bagnulo 2014), the frequency of CP stars in clusters of different ages (Netopil et al. 2015) and from theoretical expectations – that the surface chemical inhomogeneities could develop before the star has reached the zero- age main sequence (ZAMS). Special searches for CP stars were conducted by Folsom et al. (2012) among Herbig Ae/Be stars, which are still contracting pre-main-sequence (PMS) progenitors of MS intermediate-mass stars. They found several stars with λ Boo peculiarity and only one star with a weak Ap/Bp pattern (i.e. V380 Ori). Recently, a weak magnetic field and Ap spectral pattern were discovered in the secondary component of the PMS binary AK Sco (Castelli et al. 2020). Except for these two PMS objects, the present sample of very young CP stars is still very limited and contains few members of young clusters, which are believed to settle on the ZAMS (e.g. Bagnulo et al. 2004; Netopil et al. 2014). The expansion of this sample is essential for a better understanding of the time-scale and mechanisms that lead to the stabilization and formation of abundance gradients in the atmospheres of early-type stars.
One possible way to increase the sample is to use data stored in the literature and spectral archives. In a discussion of the problem of young CP stars, Herbig & Dahm (2006) pointed out a few poorly investigated stars as possible candidates, including BD+30°549, which is the subject of this paper. The star BD +30°549 is located in the northern part of the NGC 1333 star-forming region and illuminates the eponymous reflection nebula also known as VdB 17 (van den Bergh 1966). The designation of the NGC 1333 star-forming region refers to the young stellar cluster associated with the complex reflection nebula and dark cloud B255 (or L1450). NGC 1333 lies on the western edge of the Perseus molecular cloud at an average distance of 293 ± 22 pc (Ortiz-León et al. 2018). It is the most active site of the ongoing low- to intermediate-mass star formation within the Perseus cloud (Bally et al. 2008; Walawender et al. 2008) and the age of its stellar population ranges from ∼105 to 5 × 10⁷ yr (Aspin 2003). The high numbers of embedded protostars and disc-bearing stars, Herbig–Haro objects and molecular outflows in this region are consistent with the more recent estimate of the cluster’s median age as t ≈ 1 Myr (Luhman, Esplin & Loutrel 2016). At this age, stars later than ∼B5 should be still PMS or early MS objects.
In early studies, BD +30°549 was classified as a B9–8Vp star (Hubble 1922; Racine 1968). However, these papers gave no indication of the type of peculiarity or any description of its spectrum. Later, BD+30°549 was often included in samples of Herbig Ae/Be stars, satisfying the fundamental criteria for early spectral type and association with the reflection nebula. However, there is still confusion about the presence of emission lines in the spectrum, which are indicators of the ongoing mass accretion from the circumstellar disc, and hence uncertainty about the definite attribution BD +30°549 to the Herbig Ae/Be group. The index e appeared after the spectral classification of BD +30°549 in the list of Cep R1 members in Racine (1968), but was omitted in his table II. To the best of our knowledge, the only high-resolution spectrum of BD+30°549 in modern era was obtained by G. Herbig, but remained unpublished. According to the characteristics given above, the star is a promising candidate for a PMS chemically peculiar star. Here, our aim is to determine the parameters of BD +30°549’s atmosphere, age and evolutionary status, and also to quantitatively characterize its chemical composition.
2 OBSERVATIONS AND DATA REDUCTION
For our analysis, we used the high-resolution optical spectrum of BD +30°549 retrieved from the Keck Observatory archive.1 The star was observed with the Keck I telescope and the High Resolution Echelle Spectrometer (HIRES) on 2000 February 2 (PI: G. Herbig). The observations were carried out with the 0|${_{.}^{\prime\prime}}$|86 projected slit width that resulted in nominal resolving power about R ≈ 48 000. The λλ4240–6710 Å range was covered by a spectrogram with some inter-order gaps in the red. The signal-to-noise ratio (S/N) was estimated in the region near Hα as S/N ≈ 130 (per pixel). The raw data were processed with the MAKEE2 (Mauna Kea echelle extraction) pipeline written by T. Barlow. The data processing workflow included the bias subtraction and flatfielding of the science frames as well as wavelength calibration using the reference spectrum of a Th–Ar hollow cathode lamp. After this calibration, the one-dimensional spectrum extraction was performed. The accuracy of the localization of spectral orders in the two-dimensional image, the boundaries of the object and the background extraction were manually controlled.
A well-known difficulty in processing the echelle spectra of early-type stars is the normalization of the orders containing broad hydrogen lines to the continuum level. We used the method of interpolating a continuum from the neighbouring orders traced with a low-degree cubic spline. Because of the relative smoothness of the HIRES blaze function, the application of this method resulted in reasonably accurate normalization of the wings of hydrogen lines. The only exception was the very broad and weak depression in the red wing of Hβ centred roughly at 4880 Å, which is presumably of interstellar origin. Indeed, this feature coincides in wavelength with the very broad and shallow diffuse interstellar band (DIB) at 4882 Å (Herbig 1995; Galazutdinov et al. 2020). In any case, this region was excluded from further spectroscopic analysis.
3 RESULTS
3.1 Stellar parameters, distance, extinction
The absorption-line spectrum of BD+30°549 generally corresponds to the mid- to late-B photosphere. No hydrogen or metallic line emissions indicative of accretion activity were detected. Hence, BD +30°549 cannot be classified as a typical Herbig Ae/Be star, at least on the basis of the spectrogram at our disposal. Its comparison with the spectra3 of two late-B MK standards (Gray & Corbally 2009) – that is, HR1029 (sp:B7V) and 134 Tau (sp:B9IV) – revealed the striking absence of He i lines, even the strongest ones at 4471 and 5876 Å . The strong Mg ii 4481 Å line visible in the spectrum of BD +30°549 seems to be shallow compared with that in the 134 Tau spectrum. At the same time, the Si ii lines at 4621, 5041, 5055, 5466, 6347, and 6371 Å are abnormally enhanced. The Si iii triplet at 4552, 4567, 4574 Å, which is almost absent in the spectra of standards, is clearly seen in the spectrum of BD+30°549. The notable sharpness of the absorption lines of different metals indicates very slow rotation. Qualitatively, it is possible to classify BD +30°549 as a helium-weak Bp star with silicon peculiarity.
A rich interstellar spectrum, which contains both atomic and molecular features as well as numerous DIBs, is superimposed on the photospheric spectrum. Measurements of the radial velocity of CH at 4300 Å , the Na i D interstellar features and a few mostly symmetric DIBs, including those at 5780, 5797, 6380, and 6614 Å, provide an average value of RVh ≈ + 14 km s−1. This is close to the heliocentric radial velocity RVh = +16.45 km s−1 of BD +30°549, which is measured by the cross-correlation of the photospheric absorption lines with the template spectrum in several spectral windows.
The Gaia Early Data Release 3 (Brown et al. 2021) provides the parallax π = 3.48 ± 0.0237 for BD +30°549 with a renormalized unit weight error, RUWE = 1.14. This value of the RUWE is well below the recommended 1.4 upper threshold4 and indicates a ‘well behaved’ astrometric solution. The parallax of the star can be converted into distance D = 287 ± 2 pc, which is in perfect agreement with the average distance to the NGC 1333 cluster. Both the spatial position and the coincidence of the radial velocity of the star with the mean velocity of molecular material in the NGC 1333 region, RVh ≈ +15.7 km s−1, determined from the 13CO (3–2) and C18O (3–2) transitions (Curtis, Richer & Buckle 2010), confirm that the location of BD +30°549 inside the reflection nebula is not due to the projection effect. The star is a bona fide member of the NGC 1333 star-forming region and is still intimately connected with its parental molecular material.
Embeddedness inside the reflection nebula implies the non-negligible effects of interstellar reddening, which affect the observed photometry of BD +30°549. The variation in the ratio of total to selective absorption RV within NGC 1333 has been investigated by Cernis (1990), who found that in the direction of BD +30°549 it deviates significantly from the standard extinction law and equals RV = 4.7 ± 0.1. In order to determine the value of the interstellar extinction AV, we used the colour excess E(B − V) = +0.59, calculated from the observed colour index (B − V) = +0.48 (Henden et al. 2016) and the intrinsic colours interpolated from the Pecaut & Mamajek (2013) tables, for our best-fitting effective temperature Teff = 13 100 K (see Section 3.3). As a result, we obtained the visual extinction AV = 2.8. The observed spectrophotometry of BD +30°549 was dereddened using this value and the extinction curve of Fitzpatrick et al. (2019). The bolometric absolute magnitude |$M_\mathrm{bol}^{*}=-0.5$| was found for BD +30°549 by adopting a distance of 287 pc and using this extinction value as well as the bolometric correction BCV = −0.9 (Pecaut & Mamajek 2013). Finally, the absolute magnitude was converted to luminosity: |$\log (L_*/{\rm L}_{\odot })= 0.4(M_\mathrm{bol}^\odot -M_\mathrm{bol}^{*})=2.1\pm 0.1$|.
With the obtained values of luminosity and effective temperature, the star was placed on the Hertzsprung–Russell (HR) diagram (Fig. 1). A comparison with the evolutionary tracks and isochrones from the PARSEC model grid (Bressan et al. 2012), calculated for solar metallicity Z = 0.017, has revealed that BD +30°549 lies near the end of the 3.2-M⊙ PMS track, close to the ZAMS. The stellar radius inferred from the model track is R = 2.2 R⊙. The age of the star was determined from the closest theoretical isochrone as t ≈ 2.7 Myr.
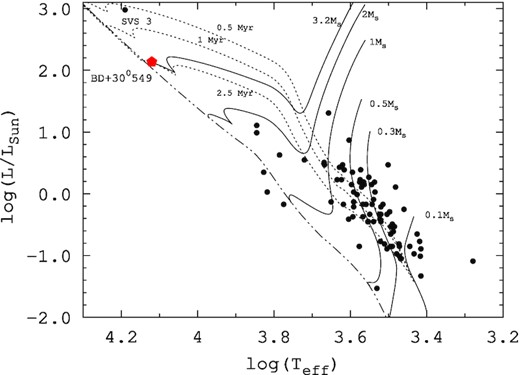
HR diagram with the position of BD +30°549 marked by the red pentagon. The sample of low-mass members of the NGC 1333 cluster from Foster et al. (2015) is shown by black dots, with the most massive cluster member ∼B5 star SVS3 labelled. Theoretical evolutionary tracks and isochrones from the PARSEC grid (Bressan et al. 2012) are labelled and are represented by solid and dotted curves, respectively. The ZAMS is shown by the dash-dotted curve.
3.2 Spectrophotometric properties and variability of BD +30°549
3.2.1 Spectral energy distribution
The spectral energy distribution (SED) of BD +30°549 was constructed in the 0.2–24 |$\mu{\rm m}$| wavelength range, from ultraviolet (UV) to mid-infrared (mid-IR), using photometric data from the XMM–Newtonoptical monitor (OM) survey (Page et al. 2012), using the AAVSO Photometric All-Sky Survey (APASS) Data Release 9 (Henden et al. 2016), Two-Micron All-Sky Survey (2MASS; Skrutskie et al. 2006) and the Wide-field Infrared Survey Explorer(WISE; Wright et al. 2010) catalogues, and using Spitzer photometry (Evans Neal et al. 2003). Fig. 2 shows a comparison of the photospheric flux calculated with our final set of atmospheric parameters (Section 3.3) and diluted for the given distance D = 287 pc with dereddened observations. Previously, BD +30°549 was classified as a J-type source, which implies the presence of near-infrared (NIR) excess due to the thermal radiation of circumstellar dust (Guzmán-Díaz et al. 2021). With a newly adopted Teff and specific reddening, our SED fitting resulted in an excellent match between the theoretical flux and observed photometry in the optical and NIR regions within the 0.23–8 |$\rm{\mu m}$| range. However, the observed SED definitely shows the UV excess in the XMM–OM UVW2 and UVM2 bands as well as mid-IR excess at λ ≳12 |$\rm{\mu m}$| in the W3−4 and MPIS 24 |$\rm{\mu m}$| bands. While the UV excess could be caused by the anomalous temperature structure of the atmosphere of BD +30°549 (Section 3.6), the mid-IR excess is reasonably well fitted by the ∼200 K blackbody radiation, as can be seen from Fig. 2. The peak temperature of the excess is about an order of magnitude higher than the typical ∼101 K dust temperature in the reflection nebulae (e.g. Gibson & Nordsieck 2003). Thus, the observed mid-IR excess traces the radiation of the warm dust located closer to the star in the circumstellar disc surrounding BD +30°549. At the same time, the lack of NIR excess in the JHK bands and the absence of the spectroscopic signatures of accretion indicate that gas and dust are depleted in the immediate vicinity of the star. Such a radial distribution of the circumstellar material is characteristic for the evolved discs: transitional or debris discs (Williams & Cieza 2011)
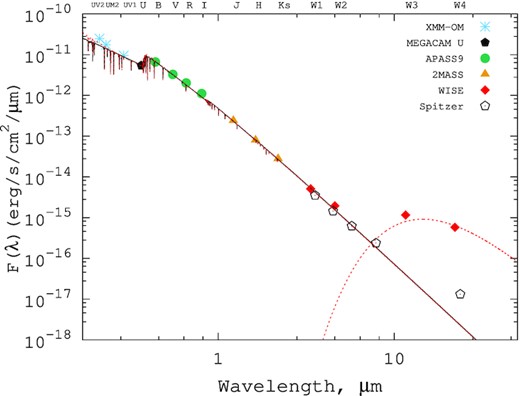
Dereddened SED of BD +30°549 from UV to mid-IR. Observed spectrophotometry from different sources is shown by different symbols, as explained in the legend. The solid black curve represents the theoretical SED calculated using the final set of atmospheric parameters, namely for Teff = 13 100 K, log g = 4.2 and helium-weak chemical composition. The emergent flux calculated with the same parameters but for the stratified model is shown by the dotted curve. The dashed curve represents the Planck function for Teff = 200 K.
A noteworthy detail in the mid-IR part of the SED of BD +30°549 is the step difference in flux between two nearby W4 and MPIS 24-|$\rm{\mu m}$| points. The differences of about an order of magnitude exceed the errors of both WISE and Spitzer photometry, so it most probably reflects the real variability of the |$\sim 24\hbox{-}\mu{\rm m}$| flux. We have inspected the WISE multi-epoch photometry of BD +30°549 obtained on a few dates within a six-month interval in 2010, but were not able to detect any variability exceeding 0.2 mag. However, the Spitzer data we used were obtained in the course of the original Cores-to-Disks (c2d) Legacy programme (Evans Neal et al. 2003). Thus, variations in the 24-|$\rm{\mu m}$| flux occurred on a decadal time-scale. A possible explanation of this mid-IR variability is the appearance of a large amount of dust in the disc at some point between the Spitzer and WISE observations. As simulations show (Kenyon & Bromley 2005), the amount of dust that can significantly affect the observed excess at 24 |$\rm{\mu m}$| could arise from the collision of ∼1000-km sized bodies, such as planetesimals or planetary embryos during the late stages of planet formation. Indeed, such catastrophic events resulting in the temporary rise of mid-IR excess are sometimes observed in young stars with planet-forming discs (e.g. Melis et al. 2012; Su et al. 2022).
3.2.2 Photometric variability
In order to investigate the long-term photometric behaviour of BD +30°549, we retrieved its light curve from the data base of the All-Sky Automated Survey for Supernovae (ASAS-SN; Kochanek et al. 2017). Observations in the Sloan g filter covering six observational seasons from 2017 to 2022 were analysed. Even at first glance, the periodic changes in the stellar brightness with an ΔV ≈ 0.2 amplitude were manifested in the light curve. The frequency analysis yielded several peaks on the Lomb–Scargle periodogram, the most powerful of which corresponds to a period of ≈123.3 d (Fig. 3a). The phase curve folded using the ephemeris JD(max.light) = 2458101.677 + 123d.277 E is also shown in Fig. 3(b). One can see the smooth quasi-sinusoidal light changes with the prolonged minimum and somewhat sharper maximum.

(a) Power spectrum for ASAS-SN archival photometry of BD +30°549. (b) Phase curve folded with a period of 123.3 d, with the curve showing the sinusoidal fit. (c) Power spectrum after subtraction of the sinusoidal fit corresponding to a period of 123.3 d. (d) Deviation from the mean curve after subtraction of the main rotational signature and its first harmonic as well as correction for the diurnal variations.
Similar variability is common within Ap/Bp stars with elemental spots on their surface. For example, the well-studied Ap–Si star, CU Vir, shows quasi-sinusoidal light changes with an amplitude up to 0.2 mag in the U filter (Pyper et al. 1998). The brightness maximum of CU Vir coincides with the maximum of absorption in the Si ii lines. If we assume that the photometric variability of BD +30°549 is also rotationally modulated and caused by the chemical spots with an altered temperature structure, the date of the spectral observation falling on the phase ϕ = 0.94 should also correspond to the line absorption maximum. It is essential to obtain additional spectroscopic observations near the phase ϕ ≈ 0.5 (corresponding to the minimum light) to test this hypothesis.
Except for the main peak at the stellar rotational period Prot, we identified its first harmonic Prot/2 and a few aliases at 73.7, 91.5 and 1 d. After subtraction of the rotationally modulated signal corresponding to the main peak, aliases at 73.7 and 91.5 d became insignificant, although the periodogram still contained meaningful peaks corresponding to the first harmonic of rotational period Prot/2 and diurnal alias (Fig. 3c). Further subtraction of the latter two signals from the data resulted in the 3σ scatter of residuals around the mean of about ∼0.09 mag (Fig. 3d). This is typical accuracy for ground-based photometry. However, it is worth noting that BD +30°549 lies in the temperature domain of slowly pulsating B (SPB) stars with periods typically ranging from ∼0.5 to 4 d (Waelkens 1991; Kurtz 2022). Whether BD +30°549 possesses such variability or not could be clarified with high-precision space photometry.
3.3 Atmospheric parameters and average abundances
The atmospheric parameters of BD +30°549 were determined using the self-consistent iterative procedure based on the spectral synthesis technique. As an initial guess, we used the effective temperature and surface gravity of a B8 star from the MK system calibrations (Gray & Corbally 2009; Schmidt-Kaler 1982). In the next step, the grid of the helium-weak atmospheric models with hydrogen abundance NH/Ntot = 0.99 was calculated using the LLmodel code (Shulyak et al. 2004), which accurately accounts for the influence of anomalies in chemical composition on the opacity distribution in the atmosphere. Hereafter, we use the models with the temperature structure calculated for the homogeneous abundance distribution as the best approximation to date (see Section 3.6 for a discussion). Using these model atmospheres and atomic data extracted from the VALD3 data base (Piskunov et al. 1995; Ryabchikova et al. 2015; Pakhomov, Ryabchikova & Piskunov 2019), the synthetic spectra were calculated with the synth3 code (Kochukhov 2007). The Teff and log g parameters have been refined by comparing the synthetic spectrum with the observed spectrum in the region of the wings of hydrogen Hα, Hβ and Hγ lines. Because in late-B stars the hydrogen lines are both temperature- and gravity-sensitive, we used the observed SED as the independent temperature constraint. The observed spectrophotometry was dereddened using the extinction curve of Fitzpatrick et al. (2019), adopting RV = 4.7. The dereddened SED was compared with the synthetic fluxes computed on each iteration with the LLmodel code for a given model atmosphere. The theoretical fluxes were diluted assuming a distance of 287 pc and a stellar radius R = 2.2 R⊙. The microturbulent velocity ξt was determined by the classical method of minimizing the slope of the dependence of the elemental abundance on the equivalent widths. We used a set of unblended Fe ii/ iii lines further employed for stratification analysis (see Section 3.5 and Table 4). The calculations were performed with a version of the Kurucz width code modified by V. Tsymbal (private communication). The procedure for the spectrum and SED fitting was repeated in a few iterations. The uncertainties of the derived parameters were estimated from the dispersion of a few last iterations around the best-fitting solution.
As a result the following set of parameters was determined: the effective temperature Teff = 13 100 ± 100 K, the surface gravity log g = 4.2 ± 0.1, and the microturbulent velocity ξt = 0 km s−1. The stellar parameters are also summarized in Table 1. Fig. 4 shows a comparison of the observed and synthetic Balmer lines profiles calculated with this final set of parameters. It can be seen that there is reasonable agreement between the synthetic spectrum and observations for Hβ and Hγ lines. The prominent discrepancy between the observations and the synthetic spectrum in the core of the Hα line is caused by unaccounted non-local thermodynamic equilibrium (non-LTE) effects, while a little mismatch in the red wing could be due to the spectrum reduction faults. At the same time, the theoretical SED reproduces well the magnitude of the Balmer discontinuity and the slope of the Paschen continuum (Fig. 2), which confirms the reliability of our effective temperature determination.
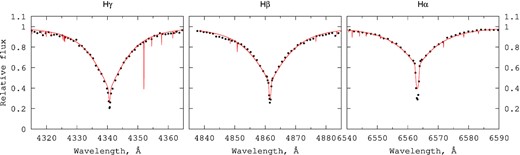
Balmer line profiles in BD +30°549 (dotted curve) compared with the best-fitting synthetic spectrum (solid curve).
Parameters of BD +30°549.
| Parameter | Value |
|---|---|
| Teff | 13 100 ± 100 K |
| log g | 4.2 ± 0.1 dex |
| ξt | 0.0 ± 0.2 km s−1 |
| ζRT | 0.0 ± 1.5 km s−1 |
| vsin i | <2.0 km s−1 |
| 〈B〉 | ≲ 1 kG |
| AV | 2.8 |
| log (L/L⊙) | 2.13 ± 0.05 |
| M/M⊙ | 3.2 |
| R/R⊙ | 2.2 |
| Age | ≈2.7 Myr |
| Parameter | Value |
|---|---|
| Teff | 13 100 ± 100 K |
| log g | 4.2 ± 0.1 dex |
| ξt | 0.0 ± 0.2 km s−1 |
| ζRT | 0.0 ± 1.5 km s−1 |
| vsin i | <2.0 km s−1 |
| 〈B〉 | ≲ 1 kG |
| AV | 2.8 |
| log (L/L⊙) | 2.13 ± 0.05 |
| M/M⊙ | 3.2 |
| R/R⊙ | 2.2 |
| Age | ≈2.7 Myr |
The macroscopic broadening parameters (rotational broadening vsin i and macroturbulence ζRT) were found by fitting the metallic line profiles in several spectral windows (e.g. 4590–4650 Å , 5045–5115 Å) with the binmag6 tool (Kochukhov 2018). In agreement with the visual impression of the line sharpness, neither rotational nor macroturbulence broadening was detected. Given the spectral resolution and instrumental profile width, we can set the upper limit for rotational velocity as vsin i ≲ 1–2 km s−1 .
Despite the sharpness of absorption lines and the evidence of a highly stabilized atmosphere, no sign of Zeeman splitting or sufficient magnetic intensification was detected in the magnetically sensitive spectral lines such as Fe ii λλ4303, 4385, 4520, 6149 Å . Within the measurement error, we were also unable to detect the differential magnetic intensification in the Fe ii 6147/6149 Å pair of lines, which is often considered to be an indication of the magnetic field presence (Mathys & Lanz 1992; Kochukhov et al. 2013). These lines have identical intensity in normal stars without magnetic fields but possess a different Zeeman spitting that produces a difference in the observed equivalent widths when the magnetic field is presented. We estimate the normalized equivalent width difference of these lines as |$\Delta W_{\lambda }/\overline{W}_{\lambda }\lesssim 0.03$|. Unfortunately, there is no accurate experimental transition probabilities for these lines. The non-magnetic spectrum synthesis results in |$\Delta W_{\lambda }/\overline{W}_{\lambda }$| = 0.026 with the theoretical transition probabilities from Raassen & Uylings (1998) while |$\Delta W_{\lambda }/\overline{W}_{\lambda }$| = 0.003 with the theoretical transition probabilities from the Kurucz 2013 line list.5 Magnetic spectrum synthesis of this pair with the help of the synmast code (Kochukhov 2007) showed that a global magnetic field 〈B〉 >1 kG produced synthetic line profiles that were too wide. Therefore, we set an upper limit on the strength of the mean magnetic field as 〈B〉 ≲1 kG. However, based on single-epoch spectroscopy, we cannot rule out the possible existence of a stronger magnetic field in BD +30°549, which could be detected in another rotational phase or, more confidently, with spectropolarimetric observations.
Line identification in the BD +30°549 spectrum was performed using a synthetic spectrum calculated in the entire range λλ4240–6710 Å covered by the spectrogram at our disposal; we also used the line lists from Fossati et al. (2009) for guidance. Because of its relatively high effective temperature, most of the elements in the BD +30°549 spectrum are presented by a moderate number of lines of the first ions. Only iron and silicon possess lines originating from two different ionization stages. The negligible rotational broadening simplified the task of line selection. We were able to select a reasonable number of lines for abundance analysis, although for some light elements (e.g. C and O), the sampling was incomplete due to limited spectral coverage and the decrease of the S/N in the blue spectral region. The atomic data for abundance analysis were taken from the VALD3 data base. For the light elements Mg and Si , the oscillator strengths gf, excitation energies and damping constants retrieved from VALD were checked against critically selected data from Alexeeva et al. (2018) and Mashonkina (2020) and, if necessary, replaced by the latter values. We compiled a list of Fe ii/ iii with excitation energies ranging from 2.8 to 18.2 eV for the abundance determination and subsequent stratification analysis (see Table 4). Hyperfine splitting was taken into account for Al ii and Ti ii using the facilities of VALD3 (Pakhomov et al. 2019).
Abundances, log (A)X = log (NX/NH), were determined under the LTE assumption as the mean of measurements of several lines of a given element X. Individual abundances were deduced from the fitting of observed line profiles by synthetic line profiles with the binmag6 tool. The error in abundance determinations was estimated as a standard deviation of individual measurements from the mean.
We derived the LTE abundances of 13 elements. The results of the abundance analysis are summarized in Table 2 and are also shown in Fig. 5, where we compare the derived and solar abundances as [X/H] = log (NX/NH) − log (NX/NH)⊙. The reference solar abundances were taken from Scott et al. (2015a, b) for elements from Na to Ni while the rest were adopted from Asplund et al. (2009). Most of the studied elements in BD +30°549 show depletion up to ≈1 dex with respect to the solar atmosphere. We were unable to detect any traces of absorption due to He i at 4471, 5015, 5876 Å, and hence put the upper limit for helium abundance as |$\log (A)_{\rm He}\le -3.5$| dex, which is 2.4 dex lower than the solar value. In contrast, Si , Ca , P and Fe display the overabundance. For silicon and iron, we found substantial abundance differences of 0.8 and 1.2 dex, respectively, between the lines of the first and second ions. Also, for the strongest lines of Si ii (5055/5056, 6347, 6371 Å) and Mg ii 4481 Å, their wings and cores cannot be fitted with a single value of abundance. In such cases, the element abundance that fits the entire profile in the best way was adopted as a final value. The discrepancies found inspired us to check for an influence of the departures from LTE on line formation for Si ii–iii, Mg ii, and Ca ii, and to determine the non-LTE abundances (Section 3.4).
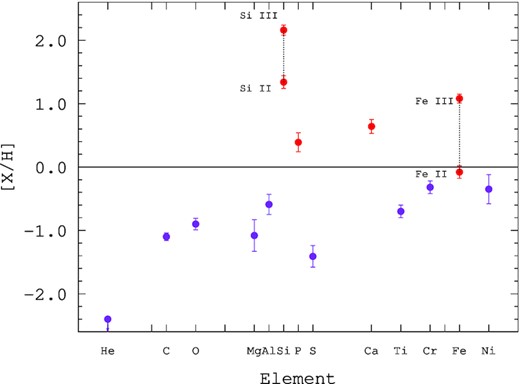
LTE abundances relative to the Sun in BD +30°549. For Si and Fe , abundances deduced from the lines of the first and second ions are presented (connected by thin dashed lines). The upper limit for He abundance is marked.
Average LTE abundances in BD +30°549.
| Ion | Nlines | log (NX/NH) | log (NX/NH)⊙ |
|---|---|---|---|
| He i | – | ≤−3.5 | −1.07 |
| C ii | 2 | −4.67 ± 0.06 | −3.57 |
| O i | 3 | −4.21 ± 0.09 | −3.31 |
| Mg ii | 6 | −5.48 ± 0.25 | −4.41 |
| Al ii | 4 | −6.16 ± 0.16 | −5.57 |
| Si ii | 7 | −3.15 ± 0.05 | −4.49 |
| Si iii | 3 | −2.33 ± 0.16 | −4.49 |
| P ii | 6 | −6.20 ± 0.15 | −6.59 |
| S ii | 6 | −6.29 ± 0.17 | −4.88 |
| Ca ii | 5 | −5.04 ± 0.11 | −5.68 |
| Ti ii | 6 | −7.77 ± 0.1 | −7.07 |
| Cr ii | 8 | −6.70 ± 0.1 | −6.38 |
| Fe ii | 20 | −4.61 ± 0.1 | −4.53 |
| Fe iii | 7 | −3.44 ± 0.07 | −4.53 |
| Ni ii | 5 | −6.15 ± 0.23 | −5.80 |
Despite the mild phosphorus overabundance in the atmosphere of BD +30°549, we were unable to detect any gallium lines, which could also be enhanced in spectra of the phosphorus–gallium subgroup of helium-weak stars. We also did not find any strontium lines, because the strongest of them, Sr ii 4077Å and 4215 Å, were not covered by our spectrogram.
3.4 Non-LTE effects on lines of Si ii– iii, Ca ii, and Mg ii
The lines of Si ii and Si iii in BD +30°549 reveal the largest deviations from the classical line-formation scenario that is based on the assumptions of LTE and a chemical homogeneity of the atmosphere. In this section, we check for an influence of the departures from LTE on the statistical equilibrium (SE) of silicon and the element abundances derived from different Si lines. The non-LTE calculations were performed with the model atom treated by Mashonkina (2020). It includes levels of the first three ionization stages (Si i, Si ii, and Si iii) and the ground state of Si iv, and it implements the most up-to-date atomic data on transition probabilities, photoionization cross-sections, and electron-impact excitation rates. One of the stars studied by Mashonkina (2020), namely HD 17081 (π Cet), has atmospheric parameters (Teff = 12 800 K and log g = 3.75) close to that of our star. The LTE analysis of π Cet found an abundance difference of 0.23 dex between the two ionization stages, Si ii and Si iii, while abundances consistent within 0.03 dex were obtained in the non-LTE calculations. Compared with π Cet, BD +30°549 reveals substantially larger LTE abundance discrepancies between Si ii and Si iii and high Si abundance, which exceeds the solar abundance by more than 1.3 dex. In the atmosphere enhanced with silicon, the Si line-formation depths shift to the upper atmospheric layers, which can result in stronger non-LTE effects compared with those for π Cet.
The coupled radiative transfer and statistical equilibrium equations were solved with the code detail (Giddings 1981; Butler 1984), where the opacity package was updated as presented by Mashonkina et al. (2011). Fig. 6 displays the departure coefficients, b|$_i = n_i^{\rm NLTE}/n_i^{\rm LTE}$|, of the selected levels of Si ii and Si iii involved in the transitions, where the Si ii 5041, 5055, 5056 Å (4p 2Po–4d 2D) and Si iii 4552 Å (4s 3S–4p 3Po) lines arise. Here, |$n_i^{\rm NLTE}$| and |$n_i^{\rm LTE}$| are the SE and thermal (Saha–Boltzmann) number densities, respectively. Si ii is subject to overionization in the line-formation layers, above log τ5000 = 0, resulting in depleted populations of the ground state and the excited levels up to 4p 2Po (Ei = 10.1 eV). The upper level of the Si ii 4p 2Po–4d 2D transition is depopulated to a lesser extent than is the lower level in the atmospheric layers up to log τ5000 ≃ −3 and, in contrast, to a greater extent in the higher layers. Such behaviour of 4d 2D is explained by a competition between the pumping UV transition from the ground state and spontaneous transitions to the levels below 4d 2D. As a result, the Si ii 5041 Å line, which forms downwards of log τ5000 ≃ −3, is weakened compared with its LTE strength (Fig. 7, middle panel) because b(4p 2Po) <1 and the line source function, Sν, is greater than the Planck function, Bν(T). The core of Si ii 5055.98 Å forms around log τ5000 ≃ −3.4, where Sν < Bν(T), and this prevails over b(4p 2Po) <1, resulting in strengthened line core (Fig. 7, top panel). The wings of Si ii 5055.98 Å form in deeper layers and are weakened compared with the LTE case. Note that, in Fig. 7, the non-LTE profile of Si ii 5055.98 Å was computed with a higher Si abundance than for the LTE profile.
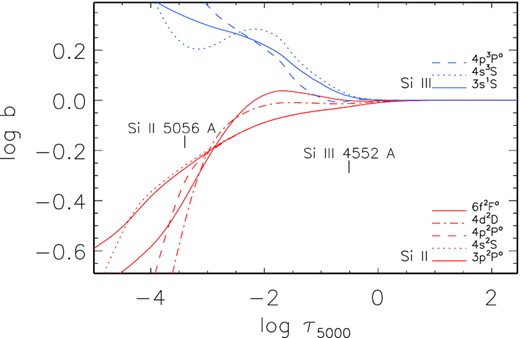
Departure coefficients, b, for the selected levels of Si ii (red curves) and Si iii (blue curves) as a function of log τ5000 in the model atmosphere of BD +30°549. Tick marks indicate the locations of line centre optical depth unity for Si ii 5056 Å and Si iii 4552 Å. Here, we used logNSi/NH = −2.77.
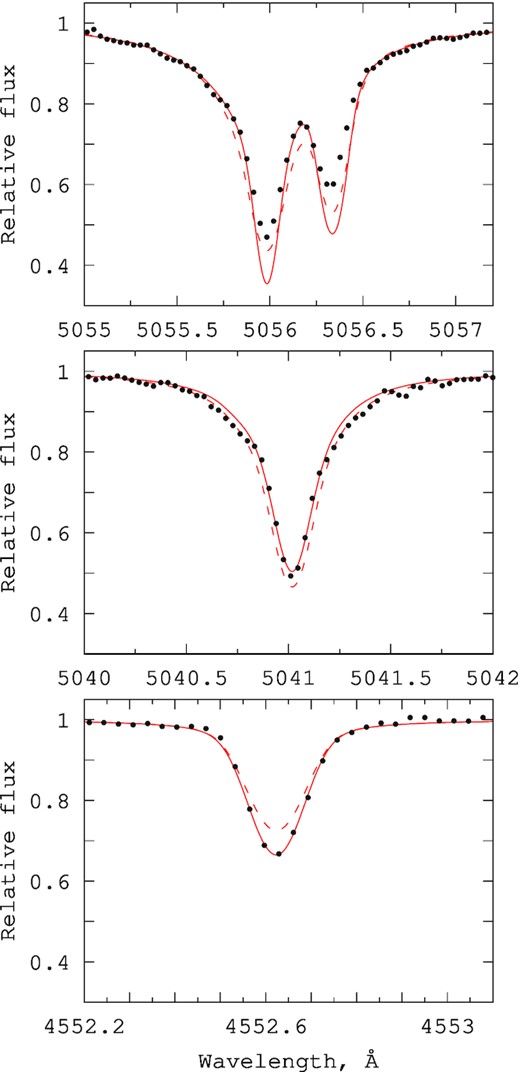
Si ii 5055–5056 Å, 5041 Å, and Si iii 4552 Å lines in BD +30°549 (black dots) compared with the non-LTE (solid curve) and LTE (dashed curve) theoretical profiles. Top panel: the best fits of the Si ii 5056 Å blend obtained with logNSi/NH = −3.1 (non-LTE) and −3.2 (LTE). Middle and bottom panels: the best non-LTE fits of Si ii5041 Å and Si iii 4552 Å, respectively. The obtained Si abundances are presented in Table 3. The same abundances were used to compute the LTE line profiles.
The Si iii levels have enhanced populations in the line-formation layers, resulting in strengthened Si iii lines compared with their LTE strengths, as shown in Fig. 7 for Si iii 4552 Å.
The LTE and non-LTE synthetic spectra were calculated with the synthv_nlte code (Tsymbal, Ryabchikova & Sitnova 2019), which implements the pre-computed departure coefficients from the detail code. The best fit to the observed spectrum was obtained automatically using the IDL binmag6 tool. In the fitting procedure, ξt = 0, V sin i = 0, and R = 48 000 were fixed, while the Si abundance and macroturbulent velocity were allowed to vary.
We found that profiles of the Si ii 4621.4, 4621.7, 5041.0, 5466.8 Å lines are well fitted in non-LTE (see Fig. 7 for Si ii 5041 Å) and the obtained non-LTE abundances are higher than the LTE abundances, by 0.12–0.21 dex (Table 3). For the Si ii 5056 Å blend, the non-LTE profile reproduces the observed profile better than the LTE profile; however, it fails to fit the observed line core (Fig. 7). The non-LTE abundance obtained from the line wings beyond the relative flux of r ≃ 0.6 is only about 0.1 dex lower compared with that for the well-fitted Si ii lines. The strongest Si ii 6347.1 and 6371.3 Å lines, with their cores formed in the uppermost atmospheric layers (log τ ≃ −4.2), can only be fitted in their outer wings (r ≳ 0.9).
LTE and non-LTE abundances of BD +30°549 from the Si ii–iii and Ca ii lines.
| Ion | λ, Å | Comment | Ei, eV | log (gf) | log (Nel/NH) | log τ5000 | |
|---|---|---|---|---|---|---|---|
| LTE | Non-LTE | (line centre) | |||||
| Si ii | 4621.42 | 12.53 | −0.610 | −3.09 | −2.97 | −1.69 | |
| Si ii | 4621.70 | Blend | 12.53 | −1.750 | −3.09 | −3.07 | −1.83 |
| Si ii | 4621.72 | Blend | 12.53 | −0.450 | −3.09 | −3.07 | −1.83 |
| Si ii | 5041.02 | 10.07 | 0.030 | −3.15 | −2.97 | −3.23 | |
| Si ii | 5055.98 | r ≥ 0.6 | 10.07 | 0.520 | −3.20 | −3.10 | −3.56 |
| Si ii | 5466.85 | Blend | 12.52 | −1.380 | −3.20 | −2.99 | −2.26 |
| Si ii | 5466.89 | Blend | 12.52 | −0.080 | −3.20 | −2.99 | −2.26 |
| Si ii | 6371.37 | r ≥ 0.9 | 8.12 | −0.080 | −3.18 | −3.18 | −4.07 |
| Mean | −3.15 ± 0.05 | −3.04 ± 0.08 | |||||
| Si iii | 4552.62 | 19.02 | 0.290 | −2.28 | −2.52 | −0.78 | |
| Si iii | 4567.84 | 19.02 | −0.070 | −2.20 | −2.38 | −0.66 | |
| Si iii | 4574.76 | 19.02 | −0.410 | −2.51 | −2.62 | −0.56 | |
| Mean | −2.33 ± 0.16 | −2.51 ± 0.12 | |||||
| Ca ii | 5001.48 | 7.51 | −0.507 | −4.94 | −4.48 | −0.76 | |
| Ca ii | 5019.97 | 7.51 | −0.247 | −5.20 | −4.73 | −0.76 | |
| Ca ii | 5307.22 | 7.51 | −0.848 | −4.99 | −4.53 | −0.37 | |
| Ca ii | 5339.19 | 8.44 | −0.079 | −5.01 | −4.55 | −0.51 | |
| Mean | −5.04 ± 0.11 | −4.57 ± 0.11 | |||||
The Si iii line profiles in BD +30°549 are well fitted in the non-LTE calculations. Their non-LTE abundance corrections, ΔNLTE = log Anon-LTE − log ALTE, are negative and amount to −0.24 dex to −0.11 dex (Table 3). Thus, non-LTE reduces an abundance discrepancy between Si iii and Si ii, although it is still substantial, log A(Si iii – Si ii) = 0.53 dex. The non-LTE calculations confirm a strong enhancement of silicon in the atmosphere of BD +30°549, with [Si/H] = 1.45 and 1.98 from lines of Si ii and Si iii, respectively.
Our spectrum of BD +30°549 covers only weak Ca ii lines listed in Table 3. They all form in deep atmospheric layers and, in the LTE analysis, indicate an enhanced Ca abundance. We performed the non-LTE calculations using the model atom treated by Mashonkina, Korn & Przybilla (2007). It was successfully applied by Sitnova, Mashonkina & Ryabchikova (2018) to achieve the Ca i/Ca ii ionization equilibrium in the sample of A–B-type stars, including the star π Cet with Teff and log g close to the corresponding parameters of BD +30°549.
We find that, in the line-formation layers of BD +30°549, Ca ii is subject to overionization, resulting in depleted populations, weakened spectral lines, and positive non-LTE abundance corrections. The lines under investigation have very similar ΔNLTE = 0.46 and 0.47 dex (Table 3). Thus, the derived Ca abundance is pushed up to [Ca/H] = 1.11.
The non-LTE calculations were also performed for Mg i–Mg ii using the non-LTE method treated by Alexeeva et al. (2018). In contrast to Si and Ca, Mg is underabundant in the atmosphere of BD +30°549, with [Mg/H] ∼ −1 from the LTE analysis. Therefore, compared with the Si ii lines of similar excitation energy and gf-value, the Mg ii lines form deeper in the atmosphere, and the non-LTE effects are expected to be smaller. The core of the strongest of the used lines, Mg ii 4481 Å, forms around log τ5000 = −1.8 and the remaining Mg ii lines listed in Table 4 form close to log τ5000 = 0. Similarly to Si ii and Ca ii, Mg ii is subject to overionization in the atmosphere of BD +30°549. The non-LTE effects are minor, with ΔNLTE < 0.01 dex, for all the Mg ii lines except Mg ii 4481 Å. For the latter, non-LTE leads to a strengthened line core, but weakened line wings, and ΔNLTE = −0.06 dex.
Line list used for stratification analysis. The references listed in the last column are: K10, K13, K14, the Kurucz online data base of observed and predicted atomic transitions (http://kurucz.harvard.edu/atoms/); WS, Den Hartog et al. (2014); KP, Kurucz & Peytremann (1975); NIST, Kramida et al. (2021); M95, Mendoza et al. (1995); M01, Matheron et al. (2001).
| Ion | Wavelength, Å | Ei, eV | log gf | log Γ4 | Ref. |
|---|---|---|---|---|---|
| Fe ii | 4508.280 | 2.85 | −2.420 | −6.530 | K13, WS(gf) |
| Fe ii | 5018.436 | 2.89 | −1.399 | −6.583 | K13 |
| Fe ii | 5022.418 | 10.35 | −0.054 | −5.567 | K13 |
| Fe ii | 5022.789 | 10.35 | −0.005 | −5.367 | K13 |
| Fe ii | 5030.632 | 10.29 | 0.381 | −5.891 | K13 |
| Fe ii | 5045.106 | 10.31 | −0.151 | −4.984 | K13 |
| Fe ii | 5127.961 | 5.57 | −2.397 | −6.520 | K13 |
| Fe ii | 5169.028 | 2.89 | −1.300 | −6.590 | K13 |
| Fe ii | 5278.939 | 5.91 | −2.520 | −6.696 | K13 |
| Fe ii | 5291.661 | 10.48 | 0.561 | −5.468 | K13 |
| Fe ii | 5303.393 | 8.18 | −1.625 | −5.822 | K13 |
| Fe ii | 5325.552 | 3.22 | −3.185 | −6.603 | K13 |
| Fe ii | 5549.000 | 10.52 | −0.186 | −5.330 | K13 |
| Fe ii | 5567.831 | 6.73 | −1.866 | −6.578 | K13 |
| Fe ii | 6149.246 | 3.89 | −2.732 | −6.588 | K13 |
| Fe iii | 4395.751 | 8.26 | −2.586 | −6.680 | K10 |
| Fe iii | 4419.596 | 8.24 | −1.690 | −6.680 | K10 |
| Fe iii | 5063.467 | 8.65 | −2.922 | −6.680 | K10 |
| Fe iii | 5086.706 | 8.66 | −2.563 | −6.680 | K10 |
| Fe iii | 5114.606 | 8.65 | −3.235 | −6.680 | K10 |
| Fe iii | 5156.111 | 8.64 | −1.922 | −6.680 | K10 |
| Fe iii | 5276.476 | 18.26 | −0.067 | −6.350 | K10 |
| Fe iii | 5282.297 | 18.26 | 0.044 | −6.350 | K10 |
| Mg ii | 4384.637 | 9.99 | −0.790 | −4.07 | NIST |
| Mg ii | 4390.514 | 9.99 | −1.490 | −4.07 | NIST |
| Mg ii | 4390.572 | 9.99 | −0.530 | −4.07 | NIST |
| Mg ii | 4427.994 | 9.99 | −1.208 | −4.40 | NIST |
| Mg ii | 4433.988 | 9.99 | −0.910 | −4.40 | KP |
| Mg ii | 4481.126 | 8.86 | 0.749 | −4.70 | NIST |
| Mg ii | 4481.150 | 8.86 | −0.560 | −4.70 | NIST |
| Mg ii | 4481.325 | 8.86 | 0.590 | −4.70 | NIST |
| Mg ii | 6545.942 | 11.63 | 0.040 | −2.98 | KP |
| Mg ii | 6545.994 | 11.63 | 0.150 | −2.98 | KP |
| Si ii | 4621.418 | 12.52 | −0.610 | −3.86 | M95 |
| Si ii | 4621.696 | 12.52 | −1.750 | −3.86 | M95 |
| Si ii | 4621.722 | 12.52 | −0.450 | −3.86 | M95 |
| Si ii | 5041.024 | 10.07 | 0.030 | −4.80 | M01 |
| Si ii | 5055.984 | 10.07 | 0.520 | −4.76 | M01 |
| Si ii | 5056.317 | 10.07 | −0.490 | −4.76 | M01 |
| Si ii | 5056.317 | 10.07 | −0.490 | −4.76 | M01 |
| Si ii | 5462.144 | 12.88 | −1.107 | −4.04 | K14 |
| Si ii | 5466.460 | 12.52 | −0.080 | −4.20 | M95 |
| Si ii | 5466.849 | 12.52 | −1.380 | −4.20 | M95 |
| Si ii | 5466.894 | 12.52 | −0.080 | −4.20 | M95 |
| Si ii | 5469.451 | 12.88 | −0.762 | −4.06 | M95 |
| Si ii | 5469.233 | 16.73 | −1.100 | −4.06 | M95 |
| Si ii | 6371.371 | 8.12 | −0.080 | −5.08 | M01 |
| Si iii | 4552.622 | 19.02 | 0.290 | 0.00 | NIST |
| Si iii | 4567.840 | 19.02 | −0.070 | 0.00 | NIST |
| Si iii | 4574.757 | 19.02 | −0.410 | 0.00 | NIST |
In summary, accounting for non-LTE effects leads to a much better representation of those silicon lines that are formed at intermediate optical depths (log τ5000 > −3), but fails to reproduce profiles of the strongest Si ii 5056, 6347, 6371 Å lines. Non-LTE reduces, but does not remove, the abundance discrepancy between Si ii and Si iii. The obtained results lead us to suspect the presence of a vertical abundance gradient for silicon, with increasing abundance towards deeper layers. We consider the chemical stratification in the next section.
3.5 Vertical abundance stratification in the atmosphere of BD +30°549
Abundance analysis of BD +30°549 under the assumption of a chemically homogeneous atmosphere led to the following discrepancies, which are canonical signatures of a vertical abundance gradients (Ryabchikova, Wade & LeBlanc 2003).
Strong Si and Mg lines require different abundances to fit their wings and cores.
The abundances obtained from the lines of the same ion (e.g. Fe ii) show a dependence on the excitation energies. The strong Fe ii lines, which are formed in the upper layers, indicate a lower abundance than the weaker lines, which form deeper in the atmosphere.
The lines of the second ions Fe iii and Si iii are abnormally strong and could not be fitted with the same abundances as for the first ions of iron and silicon.
Therefore, we performed a stratification analysis using the approximation of the vertical abundance distribution in the atmosphere by the step-like function (for validation of the method, see, e.g. Ryabchikova, Leone & Kochukhov 2005; Kochukhov et al. 2006). Stratification calculations were made for three elements, Fe , Si , and Mg , with the ddafit code (Kochukhov et al. 2006). The automatic procedure is based on the least-squares fitting of the observed line profiles, varying the four parameters that characterize the stratification profile: the lower and upper abundances, and the position and width of the abundance jump in the log τ5000 scale. Selection of spectral lines and atomic data for analysis is of critical importance for reliable reconstruction of the stratification profile. The employed line list should include lines with different excitation energy of the lower level, Ei, and formed at different optical depths, which are uniformly distributed through the atmospheric layers contributing to the line absorption.
The line list with atomic parameters used in our calculations is presented in Table 4. Because of the large number of observed lines, including those from the second ionization stage, these line selection criteria are easily fulfilled for iron. For iron, we performed calculations with two sets of atomic data. The first data set was based on the Kurucz 2010 and 2013 lists for Fe iii and Fe ii, respectively, while for the second we used primarily data from Raassen & Uylings (1998) for Fe ii. Both data sets resulted in fairly close parameters of the stratification profile, but the line list based entirely on the Kurucz data made it possible to fit the observed line profiles more accurately. The silicon lines we used also originate from the two ionization states, and are more or less evenly distributed in the 8–19 eV energy range. In contrast, most of the available magnesium transitions are in the narrow range of excitation energies. However, the strong Mg ii 4481 Å line is formed over a wide range of optical depths, −1.7 ≲ log τ5000 ≲ 0.8, and allows us to account for the contribution of different atmospheric layers.
The resulting abundance stratification for Mg and Fe is shown in Fig. 8. The iron and magnesium possess a step abundance gradient in the narrow range of optical depths near log τ5000 ≈ −0.3. Both elements show a tendency to increase abundance in the deeper atmosphere. Iron is mildly depleted in the upper atmosphere and increases its concentration with depths up to ∼1.5 dex excess relative to the Sun. Magnesium is significantly underabundant by 1.9 dex in the upper atmospheric layers, reaches the solar value at log τ5000 ≈ 0, and experiences a mild overabundance in the deepest layers contributing to line absorption. A comparison of observed and synthetic line profiles calculated with stratified abundances shows reasonable agreement for Fe and Mg . Compared with the homogeneous distribution, accounting for stratification allows us to adequately reproduce the line core depths for Fe lines arising from both ionization stages (Fig. 9), as well as the profiles of magnesium lines including wings of the Mg ii 4481 Å line (Fig. 10).
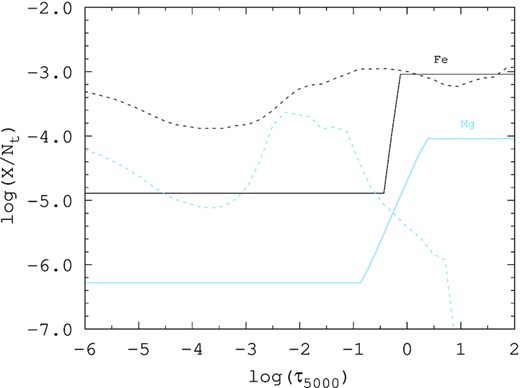
Fe and Mg stratification profiles in the BD +30°549 atmosphere. Results of theoretical diffusion calculations from LeBlanc et al. (2009) for the same elements at Teff = 12 000 K are shown for reference (dotted curves).
Observed Fe line profiles (shown by dots) compared with synthetic spectra calculated with homogeneous abundance distribution (dashed curves) and with vertical stratification (solid curve).
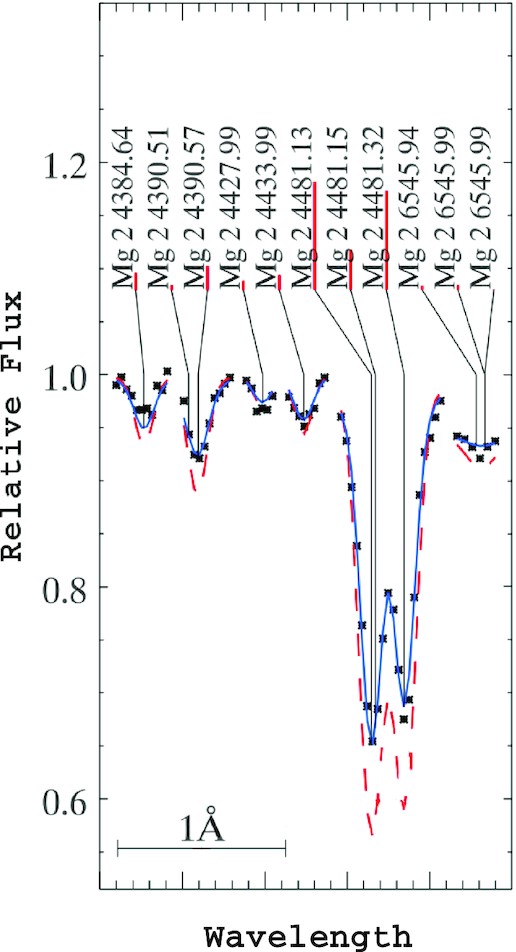
The same as Fig. 9 but for Mg lines.
In contrast, the jump of the stratification profile for silicon turned out to be very gradual, distributed over a wide range of optical depths. The resulting fit of the observed line profiles is poor and can reproduce neither the enhanced absorption in the Si iii lines, nor the wings of the strong Si ii lines.
Qualitatively, the depth dependences of iron and magnesium abundances, as well as the depletion of helium in the upper atmosphere of BD +30°549, are consistent with the results of theoretical calculations (LeBlanc et al. 2009) and point to selective diffusion as the reason for the vertical stratification of these elements. However, the exact position and magnitude of the abundance jumps in the BD+30°549 atmosphere deviate from the model predictions. First, these parameters depend on the physical conditions in a given atmosphere, and, second, the calculations represent the equilibrium solution while equilibrium could not yet be reached in the atmosphere of the young BD +30°549. It is interesting to note that the results of calculations by LeBlanc et al. (2009) show a flattening of the stratification profiles as Teff rises from 8000 to 12 000 K. The latter value is the maximum effective temperature used in their calculations, and the resulting abundance gradients are overplotted in our Fig. 8. It is evident that the stratification profiles in the hotter atmosphere of BD +30°549 are steeper, in contrast to the theoretical predictions. This could be due to the star’s young age and non-equilibrium diffusion processes.
3.6 Impact of Si overabundance on the atmospheric structure
Our abundance analysis has revealed that both silicon and iron are substantially overabundant in the atmosphere of BD +30°549 (Section 3.3) and also that these elements possess both vertical and probably lateral abundance gradients (see Sections 3.5 and 3.2.2). These metals play an important role in the opacity distribution throughout the atmosphere due to bound-free transitions and, consequently, affect its thermal balance (e.g. Khan & Shulyak 2007). Indeed, as far back as Strom & Strom (1969) it was shown that ≈1.5 dex silicon enhancement affects the structure of the atmosphere in the same way as a ∼1000 K increase in Teff, and also causes a flux redistribution in UV.
We performed a preliminary series of calculations to check how the vertical and horizontal stratification of the silicon affects the atmospheric model structure and emergent spectrum of BD +30°549. First, using the LLmodel code, we calculated the atmospheric model, taking into account the individual abundances determined in the atmosphere of BD +30°549 as well as the vertical stratification for Si , Fe and Mg . For iron and magnesium, we applied stratification profiles derived from our analysis (see Fig. 8). For silicon, the profile was set manually. The abundance |$\log (N_{\rm Si}/N_{\rm H})=-2.33$| dex, which was deduced from the LTE determination using Si iii lines, was adopted for the deep atmospheric layers, while as the upper limit we took |$\log (N_{\rm Si}/N_{\rm H})=-3.76$| dex, obtained from our fitting procedure with ddafit. The location of the abundance jump was set at the same optical depth as for iron. The results of calculations are shown in Fig. 11. We can see that the temperature structure of the model changed noticeably in the regions of both line and continuum formation. In the line-forming region, we obtained a trend of decreasing temperature with depth compared with the homogeneous model (also helium-weak and silicon-rich). The difference reaches |$\Delta T\approx 3{{\ \rm per\ cent}}$| at log τ5000 = −1. The change in the electron pressure was less pronounced and occurred predominantly in the deep atmospheric layers with log τ5000 ≳ 0. The joint effect of these changes on the SED and line profiles appeared to be significant. The stratified model provides larger Balmer discontinuity and steeper Balmer continuum in UV. The latter resulted in a better fit of the observed fluxes in the XMM–OM UVW2 and UVM2 filters than for the homogeneous model (see Fig. 2). The magnitude of the Balmer jump produced with the stratified model is less consistent with the observations, but this can be compensated by small variations in extinction and increasing Teff within ∼300 K. Nevertheless, in the synthetic spectrum calculated with the stratified model, the Balmer lines became much broader. Fitting the theoretical profiles to the observed profiles requires significant temperature correction, conflicting with the SED fitting. We conclude that current calculations with the homogeneous model provide a better simultaneous representation of the SED and line absorption spectrum of BD +30°549.
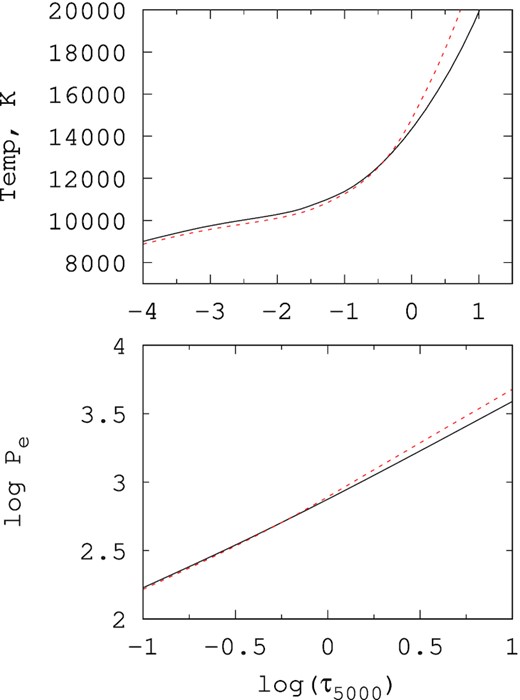
Dependence of temperature (top panel) and electronic pressure (bottom panel) on the optical depth for the helium-weak and silicon-rich homogeneous (shown by solid curve) and stratified (dashed curve) models.
Although our spectrum allowed us to put only an upper limit on the strength of the magnetic field of BD +30°549 at the date of observation, generally helium-weak silicon stars belong to the magnetic sequence of CP stars (Romanyuk 2007). Therefore, if BD+30°549 hosts a large-scale magnetic field, it could also lead to the patchy horizontal distribution of elements (i.e. the existence of elemental spots with an altered temperature structure). The detected photometric variability of BD +30°549 preliminarily confirms this assumption.
To take into account the influence of the silicon spot on the emergent spectrum, we used an approach similar to that applied for another silicon star, CU Vir (Krivoseina, Ryabchikova & Khokhlova 1980). A grid of simple models has been computed, in which ∼50 per cent of the stellar surface is occupied by a spot with enhanced silicon abundance with the rest of the surface being with the solar abundance. The temperature structure of the spot was recomputed with the LLmodel code, taking into account the opacity due to the increased silicon abundance. Varying the spot area and silicon abundance within reasonable limits, we were able to reproduce the profiles of individual silicon lines. However, an attempt to simultaneously reproduce Si ii and Si iii lines with the same abundance in the spot failed. A simple estimate also shows that presence of such a spot with [Si /H] = +1.8 dex leads to rotational brightness modulation with an amplitude up to ∼0.1 mag in the V filter. This value is less than the observed ΔV ≈ 0.2 mag amplitude, but it should be taken into account that, in reality, the temperature structure of the spot could be modified by opacity due to other elements as well as by effects of vertical stratification. Thus, in order to reproduce the emergent spectrum, one needs to know both the distribution of spots on the stellar surface and the elemental abundances within each of them. Such information can be obtained from a subsequent spectroscopic monitoring of BD +30°549.
4 DISCUSSION
4.1 Stellar parameters, chemical abundances, and stratification
Our spectroscopic analysis of the atmosphere of BD +30°549 yields the following parameters: Teff = 13 100 ± 100 K and log g = 4.2 ± 0.1. According to the modern temperature calibrations of the MKK system (Gray & Corbally 2009; Pecaut & Mamajek 2013), such an effective temperature, as well as the bolometric absolute magnitude |$M_\mathrm{bol}^{*}=-0.5$|, are in reasonable agreement with the historical spectral classification of the star as B8. Our analysis revealed the significant depletion of helium in the atmosphere of BD +30°549 with |$\log (A)_{\rm He}\le -3.5$| dex. Other elements, on average, are also depleted, with the exception of Ca , P , Si and Fe, which possess mild to strong overabundance. The helium-weak stars constitute a heterogeneous group of hot CP stars and reveal a diversity of element abundance patterns (see, e.g. Ghazaryan, Alecian & Hakobyan 2019). With the obtained element abundance pattern, BD+30°549 is not an outlier in this group. We attribute BD +30°549 with caution to the silicon subgroup of helium-weak stars because of strikingly enhanced lines of Si ii and Si iii in its spectrum.
Except for the general enrichment of silicon in the atmosphere of BD +30°549, which exceeds more than 1.3 dex with respect to the solar value, the lines corresponding to the two ionization stages yield an abundance difference of about 0.8 dex. In fact, such a discrepancy in abundances deduced from the Si ii and Si iii lines is known for B-type stars (see Bailey & Landstreet 2013, and references therein). Bailey & Landstreet (2013) studied this ‘Si ii/ iii anomaly’ on the representative sample containing normal B-type stars as well as magnetic Bp and HgMn stars. It was shown that both magnetic and non-magnetic stars exhibit log A(Si iii – Si ii) difference, but for normal B stars it is less pronounced, reaching ∼0.3−0.8 dex. The non-LTE effects and abundance stratification were proposed as possible reasons for this Si ii/ iii anomaly. Indeed, the non-LTE calculations by Mashonkina (2020) resulted in agreement between Si iii- and Si ii- based abundances for normal B7 and B3 stars (i.e. eliminated the difference in LTE abundances of 0.23 and 0.7 dex).
However, for BD +30°549, even after accounting for the non-LTE effects, the ≈0.5 dex difference still persists between abundances deduced from the Si ii and Si iii lines. Intuitively, the discrepancy in the silicon lines after accounting for the non-LTE effects suggests its depletion in the upper atmosphere with increasing abundance in the deepest layers. Indeed, we found clear observational evidence of vertical abundance stratification in BD +30°549 manifested in the lines of some other elements (e.g. Fe and Mg). However, in our analysis we were unable to construct such a stratification profile to equalize the abundances determined from the silicon lines forming at significantly different optical depths. Although, at present, we cannot fully explain the Si ii/ iii anomaly observed in the BD +30°549 spectrum, our results clearly indicate that a combination of the effects of abundance stratification as well as departures from LTE in the silicon line formation region contributes to its appearance, in agreement with the suggestion by Bailey & Landstreet (2013).
Another important factor that should be taken into account is the inhomogeneous lateral distribution of elements over the stellar surface (chemical spots), which is typical for Ap/Bp stars. For BD +30°549, the spots manifest in the rotationally modulated period, detected in the photometric variability of the star. Our preliminary calculations have shown that both silicon overabundance and the vertical gradient of its abundance also significantly affect the temperature structure of the atmosphere. Thus, we reinforce the conclusion made by Kochukhov & Ryabchikova (2018) that a sophisticated interpretation of the observed spectra of CP stars generally requires taking into account the three-dimensional distribution of abundances and subsequent recalculation of the atmospheric structure.
4.2 Evolutionary status and conditions for early development of chemical peculiarity
CP helium stars are abundant among the young stellar population in OB associations and Galactic star-forming regions. For a long time, numerous helium-weak stars have been known in young Orion and Scorpius–Centaurus OB associations (see a review in Smith 1996). The existence of helium-weak stars in the Ori OB1c (∼2−6 Myr old; Bally 2008) subgroup (Romanyuk et al. 2013), as well as the recent discovery of the helium-weak silicon star in the Orion Trapezium region (Costero et al. 2021) – although without unambiguous attribution to the ∼1 Myr old Trapezium – indicate that the onset of this type of peculiarity either is a very rapid process, or can be triggered long before the star’s settling on the ZAMS, during the PMS phase. The target of the present study, BD +30°549, is a member of active NGC 1333 star-forming region and still embedded in the reflection nebula. Its isochronal age, t ≈ 2.7 Myr, is slightly larger than the median cluster age, ∼1.5 Myr (Luhman et al. 2016), but is well within the age dispersion found by Aspin (2003). In the HR diagram, BD +30°549 lies at the end of its PMS track, very close to the ZAMS.
Results of modern time-dependent diffusion calculations show that the diffusion time-scale in the typical Ap/Bp atmosphere is of the order of ∼101−103 yr (Alecian, Stift & Dorfi 2011; Alecian & Stift 2019). Hence, the development of surface chemical inhomogeneities can occur rapidly when favourable conditions for effective atomic diffusion have been achieved. Basically, such conditions are set up by slow axial rotation and hence ineffective meridional circulation, as well as by suppression of the microturbulence.
Indeed, our spectroscopic analysis has revealed zero turbulence in the atmosphere of BD +30°549 and undetectable rotational broadening of the absorption lines with the upper limit on the projected rotational velocity V sin i ≲ 2 km s−1. Is BD +30°549 a really slow rotator or it is observed pole-on? If the photometric variability of the star is rotationally modulated, then the ≈123.3 d period corresponds to the equatorial rotation velocity V* ≲ 1 km s−1, adopting the stellar radius R* = 2.2 R⊙. This velocity is in good agreement with our spectroscopic determination and implies that the star is observed close to equator-on. If we assume that during the PMS phase, BD +30°549 followed the evolutionary path of a typical Herbig Ae/Be star, then after the main protostellar mass-accretion phase, it should gain the angular momentum resulting in typical equatorial rotational velocity of the order ofV* ≈ 150 km s−1 (corresponding to a rotational period ≈0.7 d for R* ≈ 2 R⊙). Comparing this value with the present-day rotational period, we conclude that BD +30°549 has lost (or not gained) a significant fraction of its angular momentum during the PMS phase.
The main agent in various macroscopic mechanisms of rotational braking (for a review, see Bouvier 2013) is believed to be the magnetic field, which also effectively suppresses the turbulence and various types of circulation in the outer layers of the atmosphere (Mestel & Moss 1977). Another possibility sometimes invoked to explain the loss of the angular momentum by Ap/Bp stars is synchronization in a binary system. Below we examine both of these scenarios to see if they can explain an increase the rotational period of BD +30°549 from ≈0.7 d to about 123 d during the lifetime of the star (i.e ≈2.7 Myr).
4.2.1 Synchronization in a binary system
The structure of the SED of BD +30°549 shows the absence of the NIR emission above the photospheric level within the ≈1.2–8 |$\rm{\mu m}$| range, indicative for the inner cavity in the disc. At the same time, the mid-IR excess that peaks at 24 |$\rm{\mu m}$| is approximated by ∼200 K blackbody radiation and traces of warm dust on the inner edge of the disc. Assuming that Td ⋍ 200 K is the equilibrium temperature of the dust, we can estimate its radial distance from the relation Rd/R* ≈ (T*/Td)2. Substituting the stellar parameters T* = 13 100 K and R* = 2.2 R⊙, we obtain the inner cavity radius Rd ≈ 50 au. Such a radial distribution of dust is typical for evolved transitional or debris discs (Williams & Cieza 2011). Recent interferometric observations showed that such large cavities in discs around Herbig Ae/Be stars are widespread (e.g. van der Plas et al. 2017a, b) and could be opened by both accretion and photoevaporation processes, as well as by the orbital motion of the secondary companion.
If we assume that the radius of the circular orbit of the putative secondary companion coincides with the inner boundary of the disc, then the corresponding Keplerian period at this distance will be ≈196 yr for the given stellar parameters. However, the variability of the mid-IR excess indicates the existence of a population of ∼1000-km sized bodies at this distance rather than a single massive companion (see Section 3.2). Obviously, such bodies cannot play a role in the tidal slowdown of the host star.
Moreover, synchronization for such a long period is fundamentally doubtful. Both observational studies (Abt & Snowden 1973; Gerbaldi, Floquet & Hauck 1985) and theoretical considerations (Zahn 1977) suggest that synchronization usually occurs for short orbital periods P < 6 d, and statistically the number of synchronized systems among Ap/Bp stars is low. Thus, we have to assume the existence of a closer and more massive companion inside the central cavity in the disc in order to explain the braking of the rotation of BD +30°549 due to synchronization. Currently, neither the photometric behaviour of the star, nor the structure of its disc, indicates the existence of such a companion. However, we cannot completely rule out its existence, and observations with high-angular resolution could be beneficial.
4.2.2 Magnetic braking
Using, for clarity, the largest value RA/R* ≈ 3.3, and adopting the relatively high mass-loss rate |$\dot{M}_{\rm out}/\dot{M}_{\rm acc}\approx 0.1$| and parametrized gyration radius k = 1, we finally obtain from equation (3) the estimation of the braking time of the star, τ ≈ 40 Myr, from the initial equatorial velocity V* = 150 km s−1. Obviously, 40 Myr is an order of magnitude larger than the duration of the PMS evolution of a 3.2-M⊙ star and indicates that magnetic wind braking in its simplest form is not sufficient to explain the present slow rotation of BD+30°549. Moreover, the obtained τ is a lower limit, as it was implicitly assumed that the mass-loss rate remained constant throughout the whole considered time-span. In fact, in addition to the decrease of the accretion rate with time, dissipation of the inner disc in BD +30°549 (see Section 3.2) and the corresponding termination of the accretion/outflow processes indicate that the action of this mechanism also halted before it could lead to a significant deceleration of the star.
Our simplified estimations are in agreement with those of Spruit (2018) and with the results of more sophisticated numerical calculations by Rosen et al. (2012), who showed that the spin down of intermediate mass stars as well as the formation of the long period tail in the rotational period distribution of Ap/Bp stars is unlikely to be directed by the mechanisms of disc locking and wind braking considered above. Alternatively, Spruit (2018) proposed an idea that, in rare cases, the initial phases of protostellar mass accretion can occur without acquiring angular momentum. For this scenario of magnetically dominated accretion, it is important that the connection between the magnetic field of the disc and the field inside the parental cloud is preserved. Application of this model to BD +30°549 suggests that its long-lasting association with the reflection nebula could be an essential factor. Indeed, a survey of NGC 1333 with the JCMT (Doi et al. 2020) revealed the presence of dust polarized emission in the BD+30°549 region, which is indicative of particle alignment by the global interstellar magnetic field. This interstellar field itself is aligned in a NW–SE direction, which is roughly coincidental with the orientation of the reflection nebula in the optical images. The interstellar field may be the anchor that initially prevented the star from gaining large angular momentum at the stage of protostellar collapse. Detection of the proper magnetic field of BD +30°549 with spectropolarimetric observations is essential as proof of this magnetic braking scenario.
5 CONCLUSIONS
We summarize our main findings as follows.
BD +30°549 is ≈2.7 Myr old and a PMS or early-ZAMS member of the NGC 1333 star-forming region with a pronounced chemical peculiarity of helium-weak silicon type. Using the spectral synthesis technique, we found the following parameters of its atmosphere: Teff = 13 100 ± 100 K, log g = 4.2 ± 0.1. We also detected evidence of a highly stabilized atmosphere with negligible axial rotation and zero turbulence.
The average chemical composition indicates a deficit of almost all of the investigated elements, except Si , Fe , Ca, and P . Si is overabundant up to 2.2 dex, with a significant difference in abundance determined with the lines of the first and second ions (the so-called Si ii/ iii anomaly). We also found additional observational signatures of vertical abundance stratification in the atmosphere of BD +30°549.
Non-LTE calculations resulted in minor to moderate corrections for Mg and Ca abundances, respectively. Also, the NLTE approach leads to a much better reproduction of individual silicon line profiles, but does not completely remove the abundance discrepancy between Si ii and iii.
We determined stratification profiles for iron and magnesium, which show depletion of these elements in the upper atmosphere and increased concentrations with depth. We were unable to reconstruct the reliable stratification profile for the silicon.
Currently, neither the non-LTE effects nor the vertical abundance gradient exclusively explain the Si ii/ iii anomaly observed in the spectrum of BD +30°549. The observed difference in abundances could probably be reduced by also accounting for the non-uniform lateral distribution of the silicon (i.e. its concentration in spots with an altered temperature structure). The existence of such spots is suspected on the basis of the ≈123 d period found in the low-amplitude photometric variability of BD +30°549.
The vertical distribution of elements in the atmosphere of BD +30°549 is qualitatively consistent with the results of theoretical diffusion calculations and points to atomic diffusion as the mechanism for their formation.
The star has an age of t ≈ 2.7 Myr and lies close to the ZAMS. Nevertheless, the conditions favourable for the development of the peculiar chemical composition under the action of the diffusion processes apparently arose at the PMS phase. One of the mechanisms responsible for the slow rotation and rapid stabilization of the atmosphere could be the sustained magnetic linkage of the stellar field lines with the interstellar magnetic field in the parental cloud.
The detection of the mid-IR excess indicates that BD +30°549 hosts a circumstellar disc with a developed inner cavity. The tentatively discovered variability of the flux at 24 |$\rm{\mu m}$| on the decadal time-scale is likely to be indicative of ongoing collisions in the planetesimal belt, which produce a significant amount of secondary generated dust.
ACKNOWLEDGEMENTS
This research was funded by grant No 21-72-00022 from the Russian Science Foundation (https://rscf.ru/en/project/21-72-00022/). This research has made use of the Keck Observatory Archive (KOA), which is operated by the W.M. Keck Observatory and the NASA Exoplanet Science Institute (NExScI), under contract with the National Aeronautics and Space Administration. We thank Vladimir Grinin for a discussion on the possible variability of the star’s mid-IR flux. We also thank the anonymous referee for the thorough reading of the manuscript and the comments that helped to improve it.
DATA AVAILABILITY
The data underlying this article will be shared on reasonable request to the corresponding author.
Footnotes
High-resolution (R = 42 000) spectra were retrieved from the ELODIE archive (Moultaka et al. 2004).
