


ABSTRACT
The standard formation theory of binary millisecond pulsars (BMSPs) predicts efficient orbital circularization due to tidal interaction during the previous mass transfer phase. Therefore, BMSPs are expected to have a circular orbit. However, the discovery of several eccentric BMSPs (eBMSPs) with a white dwarf (WD) companion has challenged this picture. In particular, recent observation reveals that the spin angular momentum of the eBMSP J0955−6150 is tilted at an angle >4.8○ from the orbital angular momentum. This is the first time that a tilt angle is deduced for eBMSPs, which provides an important clue to their formation mechanism. Both the orbital eccentricity and the tilt angle could be qualitatively accounted for by asymmetrical mass ejection during thermonuclear flashes from proto-WDs (so-called thermonuclear rocket model), but detailed studies are still lacking. In this paper, we simulate the impact of the kick caused by asymmetrical mass ejection on the properties of BMSPs. We find that the thermonuclear rocket model can potentially explain the observational characteristics of both eBMSPs and normal BMSPs under reasonable input parameters. In addition, our results predict a wide range of the orbital period (from less than one day to more than several hundred days) for eBMSPs, which can be tested by future observations.
1 INTRODUCTION
In the standard formation theory, binary millisecond pulsars (BMSPs) originate from low-mass X-ray binaries (LMXBs) that have undergone long-time (∼108–1010 yr) mass transfer (Alpar et al. 1982; Radhakrishnan & Srinivasan 1982; Bhattacharya & van den Heuvel 1991). In the LMXB phase, the neutron star’s (NS) spin is accelerated to millisecond periods and the binary orbit is circularized by strong tidal interactions. As a consequence, the resultant BMSPs are expected to reside in circular orbits (Phinney 1992). In fact, the majority of BMSPs with helium white dwarf (He WD) companions in the Galactic field have very small eccentricities in the range of 10−7–10−3, consistent with the theoretical predictions. However, recent observations reveal the existence of a population of eccentric BMSPs (eBMSPs), which challenges the standard formation theory. Champion et al. (2008) first reported the discovery of a BMSP J1903+0327 with a high eccentricity (e ∼ 0.44) and a G-type main-sequence companion star. The current consensus is that this binary originated from the disruption of a triple system (Freire et al. 2011; Portegies Zwart et al. 2011; Pijloo, Caputo & Portegies Zwart 2012). After that, several eBMSPs with He WD companions in the Galactic field were discovered (see table 1 of Serylak et al. 2022, for a list of eBMSPs). The properties of most eBMSPs can be briefly summarized as follows: (1) the eccentricities e ∼ 0.0274–0.14; (2) similar orbital periods ∼20–30 d and WD companion masses ∼0.25–0.3 M⊙; (3) fully recycled pulsars with short spin periods ∼2–11 ms; and (4) a wide range of the NS masses MNS ∼ 1.3–1.8 M⊙.
Description of the model parameters.
| Ni | i denotes the number of flashes. |
| σ(k) | If k > 0, vk follows Maxwellian distribution with the standard deviation σk = k |$\rm km\, s^{-1}$|. |
| If k < 0, vk follows flat distribution, with k = −1 and −2 corresponding to vk ∈ (0, 5) and (0,10) |$\rm km\, s^{-1}$|, respectively. | |
| Case | A: The vk distribution is independently set in each flash. |
| B: The vk distributions in all flashes take the same form. |
There are five models proposed to explain (at least some of) eBMSPs in the literature, and they can be classified into three categories, i.e. the phase transition model (Freire & Tauris 2014; Jiang et al. 2015), the thermonuclear runaway burning model (Antoniadis 2014; Han & Li 2021), and the resonant convection model (Ginzburg & Chiang 2022). In the phase transition model, the orbital eccentricity is caused by sudden mass-loss due to the phase transition of the compact object after the LMXB phase – either accretion-induced collapse of a super-Chandrasekhar mass WD into an NS (Freire & Tauris 2014) or conversion of an NS into a strange quark star (Jiang et al. 2015). In the thermonuclear runaway burning model, the eccentricity is induced by mass-loss from the proto-WDs (Antoniadis 2014; Han & Li 2021). Because of unstable Carbon-Nitrogen-Oxygen (CNO) shell burning on the surface of proto-WDs (after the LMXB phase and prior to the WD cooling stage), part of the ejected mass may form a circumbinary disc around the binary, which dynamically interacts with the binary and pumps up an eccentricity (Antoniadis 2014). Han & Li (2021) instead proposed that mass is asymmetrically lost from the proto-WDs, which imparts a kick on the binary and makes the binary orbit to be eccentric. In the resonant convection model, Ginzburg & Chiang (2022) argued that a coherent resonance between the orbital period and the convective eddies in the red giant progenitor of the WD may drive the anomalous eccentricity in eBMSPs.
Currently, all the models are subject to various uncertainties and are not fully consistent with observations. For example, the phase transition models predict rather specific pulsar masses that are disfavoured by the wide range of the pulsar masses in eBMSPs. The thermonuclear runaway burning models struggle to explain why the orbital periods of eBMSPs are concentrated in a narrow range of ∼20–30 d. For the resonant convection model, it is difficult to account for why some BMSPs with orbital periods similar to those of eBMSPs have not undergone resonant interactions and remained in circular orbits. Obviously, more observational clues are required to justify or put stringent constraints on the theories.
Recent observations of PSR J0955−6150 carried out by Serylak et al. (2022) showed that the binary orbit is eccentric and, more interestingly, there is misalignment between the spin angular momentum (SAM) of the pulsar and the orbital angular momentum (OAM) . The tilt angle (μ) between them is >4.8○ at 99 per cent CI. This is the first time that a tilt angle in BMSPs is reported. Detection of an SAM–OAM tilt angle is not surprising in other types of double-degenerate systems, such as double NSs (e.g. Weisberg, Romani & Taylor 1989; Kramer 1998), double black holes (BHs), and BH−NS systems (Abbott et al. 2021; The LIGO Scientific Collaboration, the Virgo Collaboration, the KAGRA Collaboration 2021). Misalignment in these systems is generally thought to be produced by the supernova events during the formation of the second compact object or the dynamical process in dense environment (e.g. Kalogera 2000; Farr et al. 2011; Rodriguez et al. 2016; Liu & Lai 2017; Tauris et al. 2017; Gerosa et al. 2018). In principle, it is possible that an SAM–OAM misalignment exists in BMSPs in globular cluster via dynamical process. However, such misalignment is beyond the expectation of the standard formation theory for BMSPs in the Galactic field, because the old NSs should have experienced long duration of accretion (Alpar et al. 1982; Bhattacharya & van den Heuvel 1991). Though the natal kick during the NS formation may initially excite an eccentricity and a tilt angle, the binary orbit must have been circularized by tidal interaction and the SAM and the OAM must have been aligned by the accretion torques (Hills 1983; Phinney 1992; Guillemot & Tauris 2014). This means that the tilt angle in PSR J0955−6150 was very likely produced after the mass transfer had ceased. Unfortunately, most of the proposed formation channels of eBMSPs do not forecast such a large tilt angle (see Serylak et al. 2022, for detailed discussion). In addition, PSR J0955−6150 has a He WD with mass |$0.254(2)\, \mathrm{ M}_{\rm \odot }$|, which is smaller than the theoretical prediction according to the relation between the WD mass and the orbital period (the MWD−Porb relation; Tauris & Savonije 1999). This is also difficult to understand in the standard theory.
Interestingly, Serylak et al. (2022) noticed that an SAM–OAM tilt angle may be qualitatively produced by the thermonuclear rocket model proposed by Han & Li (2021). This model assumes that the thermonuclear flash(es) on the surface of a proto-WD during its cooling sequence lead to asymmetrical mass ejection. As a consequence, the proto-WD suffers mild kicks, causing the host orbit to become eccentric and the SAM to be misaligned with the OAM. Serylak et al. (2022) performed toy simulations of the thermonuclear rocket effect in single flash event with the kick velocity (vk) of 8 km s−1, but failed to obtain a large tilt angle and a long orbital period to match the observation of PSR J0955−6150.
However, numerical simulations (e.g. Althaus, Serenelli & Benvenuto 2001; Istrate et al. 2016) demonstrated that there are likely multiple flashes on the surface of the proto-WDs depending on their masses. After the Roche lobe overflow (RLO) process, a thick hydrogen envelope (with mass ∼10−2 M⊙) is left on the outer layer of the proto-WD (Sarna, Ergma & Gerškevitš-Antipova 2000; Althaus et al. 2001; Benvenuto & De Vito 2004; Istrate et al. 2016). Subsequently, the proto-WD goes through a phase of contraction with almost constant luminosity and increasing effective temperature. In this phase, the luminosity is mainly supplied by the CNO burning in the shell. When the proto-WD starts cooling, the CNO burning is not sustained because the temperature in the burning shell is too low, and gravitational energy released due to contraction becomes the dominant energy source. As the temperature in the hydrogen shell rises to a critical value, the pp-chain burning is ignited, and then a flash starts with increasing luminosity. After the flash, the proto-WD contracts with an almost constant luminosity, and evolves following the above cycle. When the temperature of the hydrogen shell reaches the critical value again, a second flash occurs, and so on (see Sarna et al. 2000, for a detailed description of the process of shell flashes). In the simulation of Istrate et al. (2016), the maximum number of flashes can reach 26 if the effect of element diffusion (ED)1 is considered. Thus, it is crucial to test the thermonuclear rocket model by considering the influence of multiple flashes (or multiple kick events).
The rest of this paper is organized as follows. In Section 2, we introduce the assumptions and the simulation methods used in this work. We present our calculated results in Section 3 and summarize in Section 4.
2 ASSUMPTIONS AND METHODS
We consider binaries consisting of an NS and a proto-He WD that is just detached from its RL and enters the cooling sequence. The initial values of e and μ are both set to be 0. The initial orbital periods (|$P_{\rm orb}^{\rm i}$|) are generated from a uniform distribution. Then the WD masses are calculated according to the MWD−Porb relation with a solar metallicity (Z = 0.02; Tauris & Savonije 1999). Considering the fact that the measured masses of the NSs are in a broad range, we performed calculation with both MNS = 1.4 and |$2.0\, \mathrm{ M}_{\rm \odot }$|, and found that there is only minor difference. Therefore, we only show the case of |$M_{\rm NS}=1.4\, \mathrm{ M}_{\rm \odot }$| without loss of generality.
The proto-WD is covered by a remaining hydrogen envelope. A significant part of hydrogen is burned stably at the bottom of the envelope, while the rest is consumed during shell flash(es) (e.g. Althaus et al. 2001; Benvenuto & De Vito 2004; Istrate et al. 2016). The released energy during flash(es) can heat the outer layer material and cause the inflation of the WD’s envelope. Han & Li (2021) argued that this energy may accelerate some outer layer material to a velocity of 5 × 10³ km s−1, comparable to the escape velocity of the WDs, and some of the envelope material is ejected asymmetrically from WDs. This idea originates from Schaefer (2020) who showed that asymmetrical mass-loss during nova bursts is required to explain the decay of the orbit after a nova burst in some cataclysmic variables. Consequently, asymmetrical mass-loss during shell flash(es) may impart a kick to the WD and result in an eccentric orbit. By using the law of momentum conservation, Han & Li (2021) estimated the magnitude of the kick velocity to be around 8 km s−1, depending on the WD mass (MWD), the average ejected mass in each flash (ΔMeach), and the velocity of the ejecta (Vejct; see equation 8). In this work, we will examine the influence of kicks on the orbital period, the eccentricity, and the angle between the SAM and the OAM simultaneously.
We calculate the eccentricity and the tilt angle after a flash using the method presented in Hurley, Tout & Pols (2002). Because the kick event may occur at arbitrary position in the orbit, in each simulation, we randomly choose a mean anomaly |$\mathcal {M}$| in [0, 2π] and solve the Kepler’s equation for the eccentric anomaly E. The corresponding binary separation is r = a(1 − ecos E), where a is the semimajor axis. It is noted that because our calculations involve multiple kicks and the orientation of the kick velocity is assumed to be randomly oriented in each flash, the orientations of OAM after several flashes are not always coplanar. Thus, the final tilt angle is not a simple addition or subtraction of the tilt angle after each kick event. In Appendix A1, we present the method to calculate the tilt angle after multiple flashes.
An important issue in the thermonuclear rocket model is the efficiency of tidal circularization between and during flashes. The proto-WD in the interflash phase is composed of a degenerated He core and a non-degenerate, radiation-dominated hydrogen envelope with mass ∼|$10^{-2}\, \mathrm{ M}_{\rm \odot }$|. Using the mesa code (Paxton et al. 2011, 2013, 2015, 2018), we evolve a binary with |$M_{\rm NS}^{\rm i}=1.4\, \mathrm{ M}_{\rm \odot },\, M_{\rm donor}^{\rm i}=1.4\, \mathrm{ M}_{\rm \odot }$|, and |$P_{\rm orb}^{\rm I}= 1.07\,\rm d$|, until the formation of a BMSP with a 0.25 M⊙ WD companion, roughly matching the observation of PSR J0955−6150. We obtain the density and temperature profiles from the mesa’s output files. Then we solve the equation of tidal torque presented in Campbell (1984, equation 41) to evaluate the total tidal torque Ttot and the torque exerted by the degenerate He core (|$T_{\rm He,\rm core}$|). We find that |$T_{\rm He, core}/T_{\rm tot}\sim 98{{\ \rm per\ cent}}$|, i.e. the envelope only contributes a tiny fraction to the total torque. Consequently, we can safely use the tidal circularization time-scale τcirc designed for double-degenerate binaries to estimate the efficiency of orbital circularization in the interflash phase (Campbell 1984; Hurley et al. 2002), in which the radiative damping mechanism is adopted for the WD’s interior. We get τcirc ≈ 1.5 × 1026 yr for the above example and 4.0 × 10²¹ yr for a binary consisting of a ∼|$0.20\, \mathrm{ M}_{\rm \odot }$| proto-WD. The extremely long circularization time-scales indicate that tidal circularization is negligible in the interflash phase, which is consistent with the conclusion of Istrate et al. (2016).
3 RESULTS
3.1 Single kick model for eBMSPs
We first present the predicted orbital properties of post-kick systems by considering a single kick event, which was also investigated by Serylak et al. (2022). Their results with a constant vk = 8 km s−1 produced too small tilt angles (always <4.7○), and could not reproduce the observed orbital period of PSR J0955−6150. Here, we adopt a slightly more sophisticated model assuming that the orientation of vk is randomly distributed and the magnitude of vk follows a Maxwellian distribution with standard deviation σk. We consider three cases with σk = 1, 2, and 3 km s−1, but with the same ejecta mass |$\Delta M_{\rm ejct, tot} \, =10^{-3}\mathrm{ M}_{\rm \odot }$| (Han & Li 2021), and simulate 5 × 10⁶ systems with the initial WD mass in the range of |$[0.25,\, 0.30]\, \mathrm{ M}_{\rm \odot }$| in each case. Fig. 1 illustrates the simulated distributions of Porb, e, and μ. On the top of the Porb−e and Porb−μ planes, we also show the probability distribution functions (PDFs) of e and μ, respectively. The observed BMSPs are plotted with the green stars in the top panels, including both eBMSPs [i.e. PSR J0955-6150 (Camilo et al. 2015; Serylak et al. 2022), J1618-3921 (Edwards & Bailes 2001; Octau et al. 2018), J1946+3417 (Barr et al. 2013, 2017), J1950+2414 (Knispel et al. 2015; Zhu et al. 2019), J2234+0611(Deneva et al. 2013; Stovall et al. 2019)] and normal BMSPs with orbital periods within 20−30 d [i.e. PSRs J0732+2314 (Martinez et al. 2019), J1421−4409 (Spiewak et al. 2020), J1709+2313 (Lewandowski et al. 2004), J1912−0952 (Miao et al. 2022), and J2010+3051 (Parent et al. 2019)]. The black star represents PSR J0955−6150. The green lines in the top and bottom panels represent the theoretical e−Porb (Phinney 1992) and Porb−MWD (Tauris & Savonije 1999) relations, respectively.
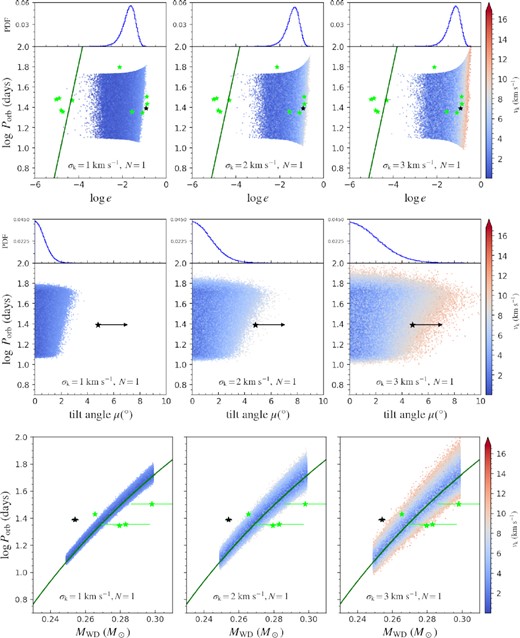
The parameter distribution of the simulated NS + He WD systems in the single kick model. The top, middle, and bottom rows show the distribution of the orbital period as a function of the eccentricity, tilt angle, and WD mass, respectively. In the top and middle panels, we also show the PDFs of e and μ, respectively. The left-hand, middle, and right-hand columns represent the cases of σk = 1, 2, and 3 km s−1, respectively. The green stars in the top row mark the observed normal and eBMSPs with orbital periods in the range of ∼20−65 d. The black star marks PSR J0955−6150, and in the bottom row only eBMSPs are plotted. The green lines in the top and bottom rows are the theoretical Porb−e and Porb−MWD relations (Phinney 1992; Tauris & Savonije 1999), respectively. The colour bars on the right of the panels represent the magnitude of vk.
The top panels in Fig.1 demonstrate that the distribution of the eccentricity shifts towards larger value with increasing σk: the peak values are 0.016, 0.032, and 0.056 in the cases of σk = 1, 2, and 3 |$\rm km\, s^{-1}$|, respectively. In all the three cases, the simulated results can only partially cover the eBMSPs in the Porb−e plane. In the middle panels, the tilt angle also exhibits the similar tendency. Even when |$\sigma _{\rm k}=3\, \rm km\, s^{-1}$|, about |$3{{\ \rm per\ cent}}$| systems can reach a tilt angle μ > 4.8○. Moreover, in the bottom panels, none of the simulated systems can match the orbital period of PSR J0955−6150. Therefore, we conclude that the single kick scenario does not seem to be adequate for the formation of eBMSPs.
3.2 Multiple kick model for eBMSPs
As pointed out before, a proto-WD likely undergoes multiple flashes depending on its mass. Previous numerical simulations show that the maximum number of flashes can reach 26 if the effect of ED is considered, although in most proto-WDs the number (N) of flashes is no more than 5−6 (Istrate et al. 2016). Thus, in this section, we investigate the possible influence of multiple kicks on the orbital evolution. In the following calculations, we set N = 3 and 5, and the total ejected mass |$\Delta M_{\rm ejct, tot}= 10^{-3}\, \mathrm{ M}_{\rm \odot }$|. We assume that in each flash, the ejected mass ΔMeach = ΔMejct,tot/N and the kick velocity is randomly orientated.
An example of our simulated results is shown in Fig. 2. Here, the magnitude of the kick velocity is assumed to follow a Maxwellian distribution (with σk = 1 and 2 km s−1) or flat distribution (with vk lying between 0 and 10 km s−1). The upper two panels correspond to the Maxwellian distribution of vk with N = 3 and 5, and the lower two panels correspond to the flat distribution of vk with N = 3 and 5, respectively. The PDFs are also demonstrated on the top of each panel. The colourful and grey dots (and the blue and grey curves) stand for the post-kick systems with the last kick velocity ≤5 and 10 km s−1, respectively.
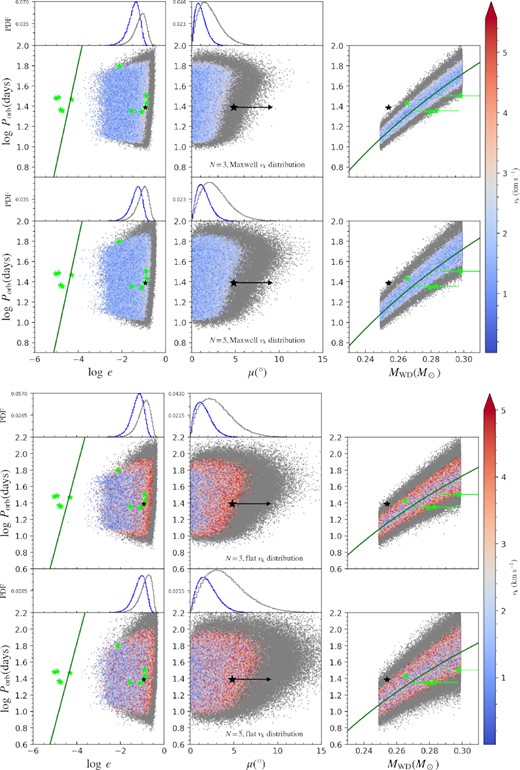
The parameter distribution of the simulated NS + He WD systems with multiple flashes. The magnitude and orientation of the kick velocity are both generated independently in each kick event. The kick velocity is assumed to follow Maxwellian distribution in the upper two rows and flat distribution in the lower two rows. For each distribution of vk, the upper and lower panels correspond to N = 3 and 5, respectively. The values of vk are limited to 5 km s−1 (colourful dots) or 10 km s−1 (grey dots). The PDFs are shown on the top of each panel.
A comparison of Figs 1 and 2 shows that multiple kicks indeed produce larger eccentricities and tilt angles. For example, for Maxwellian distribution of vk with |$\sigma _{\rm k}= 2 \, \rm km\, s^{-1}$| and N = 5, 69.7 per cent of the systems have an eccentricity within the observed interval (0.0274−0.1345) of eBMSPs, and 11.85 per cent of the systems have a tilt angle μ > 4.8○. We also see that flat vk distribution can produce slightly more systems with large eccentricities and tilt angle than Maxwellian distribution, because flat distribution tends to generate more systems with relatively high vk. In addition, the increase in N leads to larger change in the orbital period. By comparing with the observations, we conclude that multiple flashes with both Maxwellian and flat distributions of the kick velocity seem possible to reproduce the properties of eBMSPs.
We then construct a number of models by changing the key parameters that describe the kick properties, including the number of flashes (N) and the kick velocity distribution σ(k) in various flashes. The meanings of the model names are summarized in Table 1. For example, model |$N5\_\sigma (-2)\_A$| means that there are five flashes, and in each flash, the kick velocity independently follows flat distribution between 0 and 10 km s−1; and model |$N3\_\sigma (+1)\_B$| means that there are three flashes, and in all flashes, the kick velocity follows the same Maxwellian distribution with the standard deviation σk = 1 km s−1.
In Fig. 3, we compare the simulated PDFs of the eccentricity (top panel) and the tilt angle (bottom panel) for 19 representative models. We also list the percentage (f) of systems with e or μ in specific intervals confined by the dashed lines. The green dots in the top panel represent eBMSPs and normal BMSPs, and the red line in the bottom panel denotes the lower limit of the tilt angle of PSR J0955−6150. More detailed information about the models and the corresponding results are presented in TableB1.
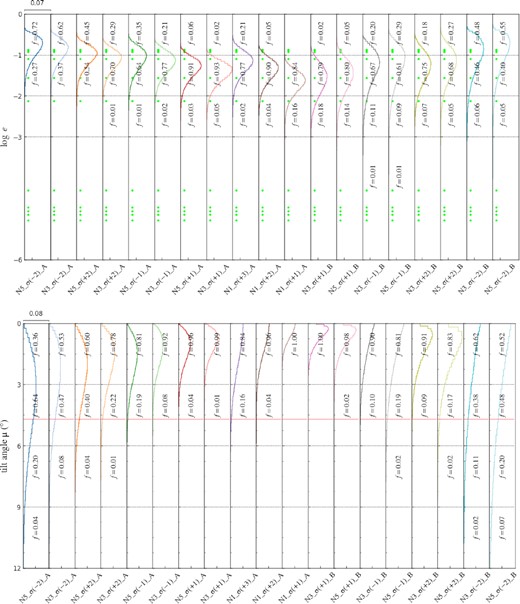
The PDFs of e (top panel) and μ (bottom panel) for 19 representative models. In the top panel, the green stars represent the observed eccentricities of BMSPs. In the bottom panel, the red line represents the lower limit of the tilt angle of PSR J0955−6150. The values of f denote the percentages of the systems located in specific intervals.
From Fig.3 and TableB1, we see that most of the multiple kick models can more or less cover the observed e distribution of eBMSPs. However, to reach a tilt angle μ > 4.8○ with a sufficiently high probability requires relatively large vk (with σk ≥ 2 km s−1 or vk ∈ [0, 10] km s−1) and/or N (≥ 3).
3.3 Multiple kick model for both BMSPs and eBMSPs
A successful kick model should be able to simultaneously account for both eBMSPs and normal BMSPs. While the above models seem to be able to explain the properties of eBMSPs, none of them can cover the eccentricity distribution of normal BMSPs. This means that the realistic situations of shell flashes are more complicated than our assumptions about the kick velocity, that is, the kick velocity may depend on not only the ejecta mass but also the asymmetry of mass ejection. So, we introduce an asymmetry parameter fa that quantifies the extent of asymmetry in the mass-loss processes during shell flashes. The case of fa = 1 corresponds to fully asymmetric ejection, while fa = 0 represents fully symmetric mass ejection without any kick. Then the modified kick velocity is favk. Since the form of fa is unclear, we tentatively consider two possibilities: (1) |$\log \, f_{\rm a}$| follows a flat distribution in the range of [−5, 0], and (2) log fa = C(1 − x)3, where C = −5 and x is a random number in [0, 1]. While in the former case, the fa distribution is dominated by relatively small values, in the latter case it is clustered around both small and large values. We add ‘fa’ and ‘fa_U’ to the original model names to identify them, respectively.
We show the calculated results for 10 representative models with asymmetrical mass ejection considered in the left 10 columns of Fig. 4 and in Table B1. Comparing with Fig. 3, we find that the distributions of the eccentricity cover a wider range than predicted by models without fa considered, but the tilt angle is clustered smaller value. Among all the models, model |$N5\_\sigma (-2)\_B+fa\_U$| seems to simultaneously match the eccentricities of eBMSPs and normal BMSPs and the tilt angle of PSR J0955−6150. The inset in the lower panel shows the PDF of μ in detail.
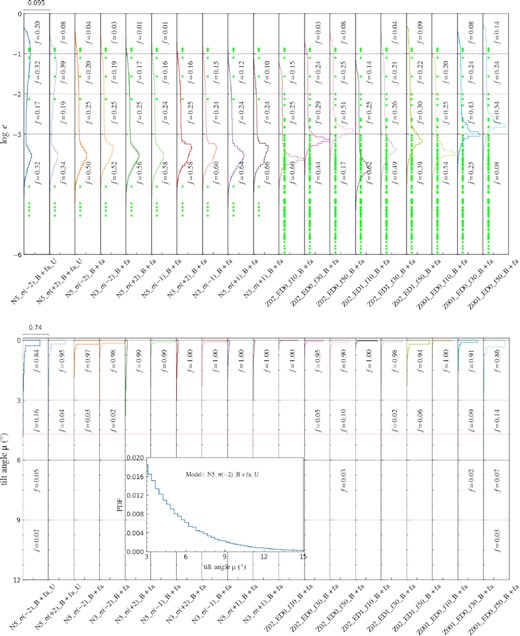
Similar to Fig. 3, but with the asymmetry parameter fa considered in the left 10 columns, and with fitted relations considered in the right 9 columns. The inset in the lower panel shows the PDF in model |$N5\_\sigma (-2)\_B+fa\_U$|.
3.4 The effect of flash number and ejected mass
We finally discuss the possible dependence of the flash number and ejected mass on the WD mass, rather taking them as fixed values. Depending on metallicity and ED, different WDs may experience different times of flashes (Althaus et al. 2001; Istrate et al. 2016). Generally, N is smaller for more massive WDs with the same metallicity (Istrate et al. 2016). In addition, the ejected mass during flashes may be different for different WDs. For example, Benvenuto & De Vito (2004) found that only ∼10 per cent of the hydrogen envelope mass (MEnv,det) is lost for a |$0.21\, \mathrm{ M}_{\rm \odot }$| WD during the flashes, while ∼|$43{{\ \rm per\ cent}}$| of MEnv,det is lost for a |$0.3\, \mathrm{ M}_{\rm \odot }$| WD in Iben & Tutukov (1986).
The right nine columns in Fig. 4 show the following features:
When |$f_{\rm ejct}=10{{\ \rm per\ cent}}$|, the kick velocities can barely explain the observed eccentricities of eBMSPs. The predicted tilt angles (<3○) are also smaller than the lower limit of μ for PSR J0955−6150. Increasing fejct can produce more systems with eccentric orbits and larger tilt angles. We find that models Z02_ED0_f50_B+fa, Z001_ED0_f30_B+fa, and Z001_ED0_f50_B+fa seem to better match the observational properties of both eBMSPs and normal BMSPs.
When ED is considered, both the eccentricities and tilt angles shift to smaller values compared with those without ED, due to relatively smaller ejected mass and kick velocity.
Models with lower metallicity generally produce larger eccentricities and tilt angles under the same fejct. This difference originates from the more massive envelope (i.e. larger MEnv,det) for lower metallicity stars (Istrate et al. 2016), which in turn results in larger kick velocity (see Fig. A3).
4 SUMMARY
In this work, we have investigated the feasibility of the thermonuclear rocket model for the formation of eBMSPs. Here, we focus on how to explain the tilt angle between the SAM and the OAM and the orbital period (or the WD mass) deviation from the theoretical prediction for PSR J0955−6150. We also explore the possibility to simultaneously explain the overall eccentricity distribution of both eBMSPs and normal BMSPs under the thermonuclear rocket model.
First, we let all WDs have the same number N of flashes and the same ejecta mass ΔMejec,tot during flashes, and artificially limit the mass range of WDs within that of observed eBMSPs. Under these simplified assumptions, we show that the thermonuclear rocket model with multiple kicks could better reproduce the properties of both eBMSPs than with single kick. However, to account for the normal BMSPs simultaneously, one needs to carefully take into consideration the effect of asymmetry of mass ejection.
Then, we discuss the more realistic case based on the numerical data of shell flashes on proto-WDs in previous studies. In this case, both N and ΔMejec,tot depend on MWD, metallicity, and ED. We fit the relations among these factors and incorporate them into our simulations. We find that under such situation, a few models with relatively large (30–50 per cent) mass ejection fraction can potentially match the observations. Moreover, our results predict a wide range of the orbital period (from less than one day to more than several hundred days) for eBMSPs, and some of them may have a tilt angle up to ∼10○. We expect these predictions to be tested by future observations.
ACKNOWLEDGEMENTS
We thank the referee, Pablo Marchant, for constructive comments and suggestions that have helped improve the manuscript. This work was supported by the National Key Research and Development Program of China (2021YFA0718500), the Natural Science Foundation of China under grant numbers 12041301 and 12121003, and Project U1838201 supported by NSFC and CAS.
DATA AVAILABILITY
All data underlying this article will be shared on reasonable request to the corresponding authors.
Footnotes
ED is the physical mechanism for mixing of chemical elements due to pressure, temperature, and composition gradients (Thoul, Bahcall & Loeb 1994).
REFERENCES
APPENDIX A
A1 The tilt angle after multiple kicks
The geometry of the binary is shown in Fig. A1. The NS is at the coordinate origin, and the orbit is on the xy plane. We assume that the unit vector |$\hat{\boldsymbol{ s}}$| of the spin momentum of the NS is initially aligned with the OAM |$\hat{\boldsymbol{ h}}_0$| and the z-axis, i.e. |$\hat{\boldsymbol{ s}}=\hat{\boldsymbol{ h}}_0=(0,0,1)$|.
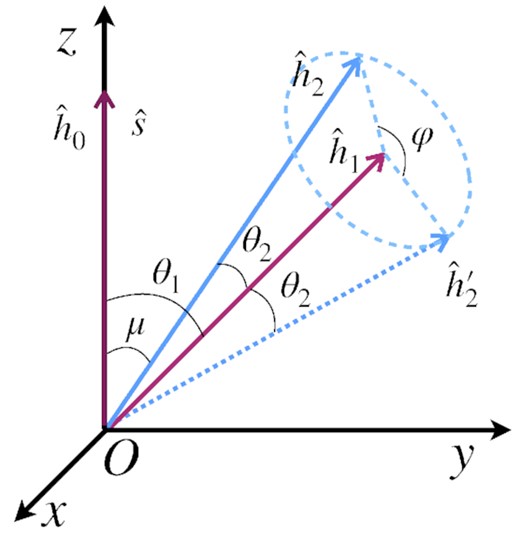
The geometry of the model for calculating μ after multiple kicks.
After the first kick, the angle μ between |$\hat{\boldsymbol{ s}}$| and |$\hat{\boldsymbol{ h}}_1$| is |$\mu _1=\theta _1=\langle \hat{\boldsymbol{ s}},\hat{\boldsymbol{ h}}_1\rangle$|. The toroidal angle of |$\hat{\boldsymbol{ h}}_1$| is arbitrarily set, and we assume that |${\hat{\boldsymbol{ h}}}_1$| is in the yOz plane.
A2 Fitting the N−MWD and ΔMejct,tot−MWD relations
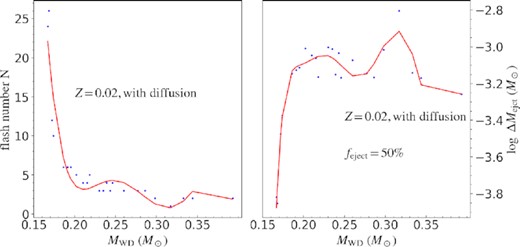
An example of the empirical N−MWD (left-hand panel) and ΔMejct,tot−MWD (right-hand panel) relations for model of Z02_ED1.
Fig. A3 shows several examples of the vk distribution by use of the empirical N−MWD and ΔMejct,tot−MWD relations and equation (8). Here, we adopt a lognormal fa distribution and |$f_{\rm ejct}=30{{\ \rm per\ cent}}$| (left-hand panel) and 50 per cent (right-hand panel).
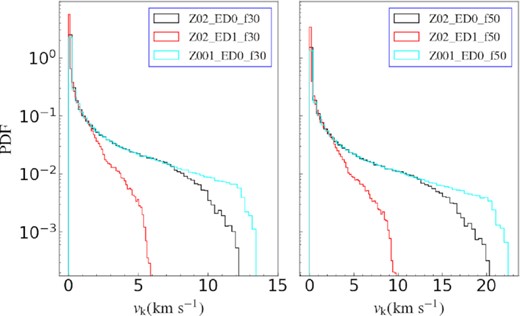
The obtained vk distribution by using the fitting result of Appendix A2 and equation ( 8) to calculate vk, where a lognormal fa distribution has been taken into account. The left-hand and right-hand panels show the case with fejct = 30 per cent and 50 per cent, respectively. In each panel, the green, black, and red lines correspond to the models of Z001_ED0, Z02_ED0, and Z02_ED1, respectively.
APPENDIX B
Table B1 presents a list of the model parameters and the calculated results.
Properties and predictions of multiple kick models.
| Name | Properties | |||||||||
|---|---|---|---|---|---|---|---|---|---|---|
| vk distribution | vk limita | N | vk in flashes | |$f_{\rm a}$|b | e ≤ 10−3 | e ≥ 10−2 | e ≥ 10−1 | μ ≥ 4.8○ | μ ≥ 10○ | |
| N1_σ(+1)_A | Maxwell: σk = 1a | – | 1 | No | 0.2 per cent | 84.0 per cent | ||||
| N1_σ(+2)_A | Maxwell: σk = 2 | – | 1 | No | 95.7 per cent | 5.2 per cent | 0.1 per cent | |||
| N1_σ(+3)_A | Maxwell: σk = 3 | – | 1 | No | 98.0 per cent | 21.1 per cent | 2.9 per cent | |||
| N3_σ(+1)_A | Maxwell: σk = 1 | 5 | 3 | Independent | No | 0.1 per cent | 94.7 per cent | 1.6 per cent | ||
| N3_σ(+2)_A | Maxwell: σk = 2 | 10 | 3 | Independent | No | 98.6 per cent | 29.0 per cent | 4.1 per cent | ||
| N5_σ(+1)_A | Maxwell: σk = 1 | 5 | 5 | Independent | No | 96.8 per cent | 5.9 per cent | 0.1 per cent | ||
| N5_σ(+2)_A | Maxwell: σk = 2 | 10 | 5 | Independent | No | 99.2 per cent | 44.8 per cent | 111.9 per cent | 0.1 per cent | |
| N3_σ(−1)_A | Flat | 5 | 3 | Independent | No | 97.8 per cent | 21.2 per cent | 0.4 per cent | ||
| N3_σ(−2)_A | Flat | 10 | 3 | Independent | No | 99.4 per cent | 62.3 per cent | 18.1 per cent | 0.3 per cent | |
| N5_σ(−1)_A | Flat | 5 | 5 | Independent | No | 98.6 per cent | 34.9 per cent | 2.4 per cent | ||
| N5_σ(−2)_A | Flat | 10 | 5 | Independent | No | 99.6 per cent | 72.3 per cent | 34.3 per cent | 2.3 per cent | |
| N3_σ(+1)_B | Maxwell: σk = 1 | 5 | 3 | Unchanged | No | 0.5 per cent | 81.7 per cent | 2.2 per cent | ||
| N3_σ(+2)_B | Maxwell: σk = 2 | 10 | 3 | Unchanged | No | 0.1 per cent | 93.3 per cent | 18.3 per cent | 1.4 per cent | |
| N5_σ(+1)_B | Maxwell: σk = 1 | 5 | 5 | Unchanged | No | 0.4 per cent | 85.5 per cent | 5.5 per cent | 0.1 per cent | |
| N5_σ(+2)_B | Maxwell: σk = 2 | 10 | 5 | Unchanged | No | 0.1 per cent | 94.7 per cent | 26.9 per cent | 4.4 per cent | 0.1 per cent |
| N3_σ(−1)_B | Flat | 5 | 3 | Unchanged | No | 1.2 per cent | 87.5 per cent | 20.3 per cent | 1.4 per cent | |
| N3_σ(−2)_B | Flat | 10 | 3 | Unchanged | No | 0.6 per cent | 93.7 per cent | 47.5 per cent | 18.8 per cent | 1.3 per cent |
| N5_σ(−1)_B | Flat | 5 | 5 | Unchanged | No | 1.1 per cent | 89.4 per cent | 28.5 per cent | 5.1 per cent | |
| N5_σ(−2)_B | Flat | 10 | 5 | Unchanged | No | 0.5 per cent | 94.6 per cent | 54.5 per cent | 29.3 per cent | 5.2 per cent |
| N3_σ(+1)_B+fa | Maxwell: σk = 1 | 5 | 3 | Unchanged | Yes | 65.8 per cent | 9.8 per cent | |||
| N3_σ(+2)_B+fa | Maxwell: σk = 2 | 10 | 3 | Unchanged | Yes | 58.2 per cent | 16.5 per cent | 0.7 per cent | ||
| N5_σ(+1)_B+fa | Maxwell: σk = 1 | 5 | 5 | Unchanged | Yes | 63.9 per cent | 11.7 per cent | 0.1 per cent | ||
| N5_σ(+2)_B+fa | Maxwell: σk = 2 | 10 | 5 | Unchanged | Yes | 56.4 per cent | 18.6 per cent | 1.2 per cent | 0.1 per cent | |
| N3_σ(−1)_B+fa | Flat | 5 | 3 | Unchanged | Yes | 59.6 per cent | 15.9 per cent | 0.8 per cent | ||
| N3_σ(−2)_B+fa | Flat | 10 | 3 | Unchanged | Yes | 52.2 per cent | 22.8 per cent | 3.3 per cent | 0.6 per cent | |
| N5_σ(−1)_B+fa | Flat | 5 | 5 | Unchanged | Yes | 57.8 per cent | 17.8 per cent | 1.4 per cent | 0.1 per cent | |
| N5_σ(−2)_B+fa | Flat | 10 | 5 | Unchanged | Yes | 50.3 per cent | 24.9 per cent | 4.5 per cent | 1.3 per cent | 0.1 per cent |
| N5_σ(+2)_B+fa_U | Maxwell: σk = 2 | 10 | 5 | Unchanged | ‘U’-like | 31.8 per cent | 51.6 per cent | 19.6 per cent | 8.4 per cent | 1.1 per cent |
| N5_σ(−2)_B+fa_U | Flat | 10 | 5 | Unchanged | ‘U’-like | 34.3 per cent | 46.7 per cent | 7.8 per cent | 1.0 per cent | |
In the unit of |$\rm km\, s^{-1}$|.
fa follows a lognormal distribution unless otherwise specified.
Properties and predictions of multiple kick models based on the fitted N−MWD and ΔMejct,tot−MWD relations.
| Name | Properties | ||||||||||
|---|---|---|---|---|---|---|---|---|---|---|---|
| vk and N | Z | ED | fejct | vk in flashes | fa | e ≤ 10−3 | e ≥ 10−2 | e ≥ 10−1 | μ ≥ 4.8○ | μ ≥ 10○ | |
| |$\rm Z02\_ED0\_f10\_B+fa$| | Fitting | 0.02 | No | 10 per cent | Unchanged | Yes | 59.7 per cent | 15.1 per cent | |||
| |$\rm Z02\_ED0\_f30\_B+fa$| | Fitting | 0.02 | No | 30 per cent | Unchanged | Yes | 44.1 per cent | 27.1 per cent | 2.8 per cent | 0.6 per cent | |
| |$\rm Z02\_ED0\_f50\_B+fa$| | Fitting | 0.02 | No | 50 per cent | Unchanged | Yes | 16.6 per cent | 32.7 per cent | 8.0 per cent | 5.3 per cent | |
| |$\rm Z02\_ED1\_f10\_B+fa$| | Fitting | 0.02 | Yes | 10 per cent | Unchanged | Yes | 61.8 per cent | 13.6 per cent | |||
| |$\rm Z02\_ED1\_f30\_B+fa$| | Fitting | 0.02 | Yes | 30 per cent | Unchanged | Yes | 48.8 per cent | 25.6 per cent | 4.2 per cent | 0.3 per cent | |
| |$\rm Z02\_ED1\_f50\_B+fa$| | Fitting | 0.02 | Yes | 50 per cent | Unchanged | Yes | 38.6 per cent | 31.2 per cent | 9.3 per cent | 2.2 per cent | 0.1 per cent |
| |$\rm Z001\_ED0\_f10\_B+fa$| | Fitting | 0.001 | No | 10 per cent | Unchanged | Yes | 54.2 per cent | 20.4 per cent | 0.1 per cent | ||
| |$\rm Z001\_ED0\_f30\_B+fa$| | Fitting | 0.001 | No | 30 per cent | Unchanged | Yes | 24.5 per cent | 32.4 per cent | 8.4 per cent | 4.5 per cent | 0.1 per cent |
| |$\rm Z001\_ED0\_f50\_B+fa$| | Fitting | 0.001 | No | 50 per cent | Unchanged | Yes | 7.8 per cent | 38.0 per cent | 14.0 per cent | 9.3 per cent | 2.1 per cent |
