


ABSTRACT
We measure the velocity dispersions of clusters of galaxies selected by the red-sequence Matched-filter Probabilistic Percolation (redMaPPer) algorithm in the first three years of data from the Dark Energy Survey (DES), allowing us to probe cluster selection and richness estimation, λ, in light of cluster dynamics. Our sample consists of 126 clusters with sufficient spectroscopy for individual velocity dispersion estimates. We examine the correlations between cluster velocity dispersion, richness, X-ray temperature, and luminosity, as well as central galaxy velocity offsets. The velocity dispersion–richness relation exhibits a bimodal distribution. The majority of clusters follow scaling relations between velocity dispersion, richness, and X-ray properties similar to those found for previous samples; however, there is a significant population of clusters with velocity dispersions that are high for their richness. These clusters account for roughly 22 per cent of the λ < 70 systems in our sample, but more than half (55 per cent) of λ < 70 clusters at z > 0.5. A couple of these systems are hot and X-ray bright as expected for massive clusters with richnesses that appear to have been underestimated, but most appear to have high velocity dispersions for their X-ray properties likely due to line-of-sight structure. These results suggest that projection effects contribute significantly to redMaPPer selection, particularly at higher redshifts and lower richnesses. The redMaPPer determined richnesses for the velocity dispersion outliers are consistent with their X-ray properties, but several are X-ray undetected and deeper data are needed to understand their nature.
1 INTRODUCTION
The growth rate of clusters of galaxies is in principle a highly sensitive probe of dark energy given that the cluster mass function is exponentially sensitive to the underlying cosmology. In fact, cluster studies have resulted in stringent constraints on the matter density, amplitude of perturbations (σ8), and competitive constraints on the present day dark energy density (e.g. Vikhlinin et al. 2009; Mantz et al. 2010, 2015; Rozo et al. 2010; de Haan et al. 2016; Planck Collaboration XXIV 2016; Bocquet et al. 2019; Abbott et al. 2020).
Currently, the largest cluster samples are drawn from wide area, optical imaging surveys using colour-based (e.g. red sequence; Gladders & Yee 2005; Koester et al. 2007; Murphy, Geach & Bower 2012; Oguri 2014; Rykoff et al. 2014; Licitra et al. 2016) or photometric redshift-based selection (Dong et al. 2008; Milkeraitis et al. 2010; Durret et al. 2011; Soares-Santos et al. 2011; Bellagamba et al. 2018; Aguena et al. 2021). The statistical power of these cluster samples gives them the potential to be the single most constraining probe of dark energy in large-area surveys like the Dark Energy Survey (DES; Weinberg et al. 2013; Abbott et al. 2020); however, the constraining power is currently limited by systematics in cluster selection and mass calibration (Abbott et al. 2020). In particular, photometric cluster selection inevitably suffers from the projection of structure along the line of sight with galaxies over a large range of distances potentially being counted as cluster members (e.g. Lucey 1983; Costanzi et al. 2019). Spectroscopy, where available, allows for a more robust determination of cluster membership, and the velocity dispersion of member galaxies correlates with cluster mass, allowing for the calibration of some of the systematics affecting optical cluster selection (Rozo et al. 2015; Farahi et al. 2016; Myles et al. 2021).
In this paper, we study the kinematics of the red-sequence Matched-filter Probabilistic Percolation (redMaPPer; Rykoff et al. 2014, 2016) selected clusters from the first three years of DES data using archival spectroscopy. Specifically, we determine the velocity dispersions of 126 clusters with at least 15 spectroscopic member galaxies and investigate the velocity dispersion–richness relation; the scatter and redshift dependence of this relation give us an indication of the types of systems selected by the cluster-finding algorithm. We also look at the correlation of velocity dispersion with X-ray cluster properties where available. This study extends the examination of redMaPPer cluster selection and dynamics to higher redshifts than previous spectroscopic studies of the Sloan Digital Sky Survey (SDSS) clusters (Rozo et al. 2015; Farahi et al. 2016; Myles et al. 2021).
The structure of this paper is as follows. In Section 2, we present our cluster selection and available spectroscopy and X-ray data. In Section 3, we outline the statistical methodology used to obtain velocity dispersion estimates. In Section 4, we examine the velocity dispersions, the velocity dispersion–richness relation, and the distribution of redMAPPer determined central galaxy velocities. In Section 5, we investigate the bimodal velocity dispersion–richness distribution in relation to other cluster properties like redshift and X-ray emission. In Section 6, we summarize our findings and discuss future work.
2 DATA
2.1 Cluster catalogue
We study the properties of clusters selected from the wide-area, optical imaging data of the DES (The Dark Energy Survey Collaboration 2005). Specifically, clusters are selected from the DES Year 3 (Y3) GOLD catalogue (Sevilla-Noarbe et al. 2021) that includes data taken from the first three years of the survey covering 4946 deg2 in griz. These data represent a large increase in area by a factor of ∼2.7 with only a modest increase in depth compared to DES Year 1 (Y1).
Clusters are identified in DES data using the redMaPPer algorithm, a photometric red-sequence cluster finder (Rykoff et al. 2014, 2016). RedMaPPer iteratively selects red-sequence galaxies and assigns them a probability of membership to clusters based on a matched filter on colour, magnitude, and spatial separation from the most likely identified central cluster galaxy. An observable proxy for cluster mass is the redMaPPer determined richness, λ, which is the sum of the galaxy membership probabilities in a given cluster within a given radius (Rykoff et al. 2014; McClintock et al. 2019).
The data set used in this study is composed of galaxy clusters and their respective member galaxies selected using redMaPPer version 6.4.22 + 2 from the DES Y3 GOLD catalogue. Specifically, we consider the richness greater than 20, full cluster catalogue, and the associated member catalogue. We will also examine results for the volume-limited, λ > 20, catalogue, which only includes clusters that have been observed with sufficient depth to detect the faintest galaxies used in the richness calculation, 0.2L* galaxies.
In this work, we focus on the subset of redMaPPer clusters with sufficient spectroscopy of cluster member galaxies for statistical analysis, as described below.
2.2 Spectroscopic catalogue
The redMaPPer member catalogue includes spectroscopic redshift measurements of cluster member galaxies from archival surveys including SDSS Data Release 14 (DR14; Abolfathi et al. 2018) and the Australian Dark Energy Survey (OzDES) Global Redshift Catalogue, which collates spectroscopy taken by the OzDES survey (Childress et al. 2017; Lidman et al. 2020), as well as data from other published spectroscopic surveys in the DES supernova fields. In addition to redshifts in the redMaPPer catalogue, we included spectra from additional archival surveys as collated for DES photometric redshift calibration (Gschwend et al. 2018).
As we wish to measure the peculiar velocity distributions within our clusters and to robustly probe cluster membership, we limit our sample to clusters with spectroscopic redshifts for at least 15 galaxies identified by redMaPPer as possible cluster members. The choice of 15 as a minimum is somewhat arbitrary. A minimum sample of 10 galaxies is typically recommended for the velocity dispersion estimators we use (e.g. Beers, Flynn & Gebhardt 1990); however, the scatter in velocity dispersion estimates decrease as the number of members increase, and few member velocity dispersions based on primarily the brightest galaxies can be biased (e.g. Saro et al. 2013). The minimum of 15 is chosen to strike a balance between reducing scatter and bias while not overly restricting the sample size.
As detailed in Section 3, after a first pass at determining the cluster central redshift, we further cull the galaxy catalogue removing galaxies whose velocity offsets indicate they are not cluster members. After this cut and again requiring spectroscopic redshifts for at least 15 member galaxies, we get a final sample of 126 clusters for our analysis; of these, 76 clusters have spectra for at least 20 members. We chose not to remove member galaxies based on their redMaPPer assigned probability of membership (PMEM), as it severely limited our sample without significantly reducing the ratio of outlier clusters, as shown in Appendix A. It is also important to note that we do not consider any bias due to selection effects such as targeting strategies, as these spectroscopic measurements are largely archival. Ongoing programs are collecting new spectroscopy for subsets of redMaPPer clusters, which will be the subject of future work.
2.3 X-ray data
A number of the clusters in our sample have existing X-ray data to which we compare the velocity dispersions in Section 5. Out of our total sample of 126 clusters, 30 have archival Chandra observations and 43 have archival XMM–Newton observations, after removing clusters where the proximity to the detector edge or other clusters prevented accurate analysis. 11 clusters appeared in both the Chandra and XMM samples. For these systems, we use the XMM measurements, because the temperatures typically had smaller uncertainties. In total, this gives a sample of 62 unique clusters with X-ray data, roughly half of our sample.
These data were reduced and analysed with the MATCha (Hollowood et al. 2019) and xcs(Lloyd-Davies et al. 2011; Giles et al. 2022) pipelines for Chandra and XMM data, respectively. For clusters with sufficient data, the X-ray temperature and luminosity were determined through fits to the X-ray spectrum. In this work, we utilize temperatures and luminosities within an r2500 radius. For X-ray detected clusters with insufficient statistics to fit the temperature, the luminosity was estimated starting with an assumed temperature of 3 keV and then iterating over the LX–TX relation for redMaPPer clusters (Hollowood et al. 2019). For undetected clusters we estimated the 3σ upper limit on LX given the detected count rate in a 500 kpc aperture surrounding the redMaPPer position. All X-ray to redMaPPer matches were visually examined and compared to known clusters and other nearby redMaPPer clusters. In some cases, the X-ray cluster was a known cluster at a different redshift and not the redMaPPer cluster being considered; these were removed from the sample. In general, given proximity, redshift, and richness the X-ray associations were unambiguous. For details see Hollowood et al. (2019) and Giles et al. (2022).
3 METHODOLOGY
In this section, we outline the methods used to determine cluster redshifts and velocity dispersions for the spectroscopic sample.
3.1 Member selection
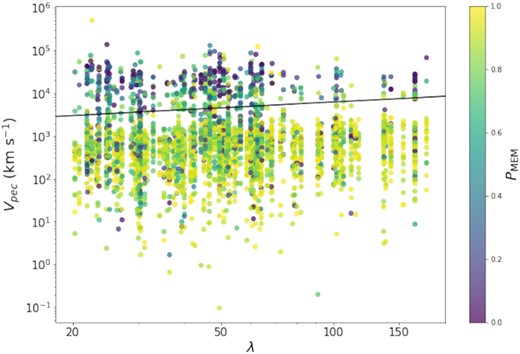
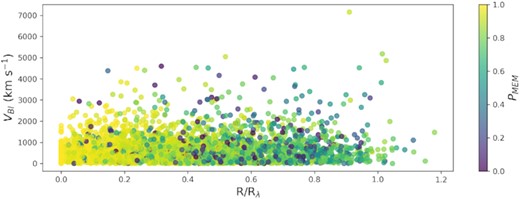
Member galaxy peculiar velocities shown against their cluster’s richness with the galaxy probability of membership on the colour axis. The black line shows the initial cut to remove interlopers from equation (2). Colour represents membership probability, PMEM, from the redMaPPer algorithm (Rykoff et al. 2014).
3.2 Statistics
For determination of cluster central redshift and velocity dispersion, we follow the methods detailed in Beers et al. (1990). In this section, we summarize the resistant and robust location and scale estimators from Beers et al. (1990) utilized in this work, in particular those appropriate to the few Nmembers regime of Nmembers ≥ 15 to obtain velocity dispersions for galaxy clusters that do not have complete spectroscopic sampling or have not reached dynamic equilibrium. We will specifically utilize and compare the biweight scale and gapper methods of estimating the velocity dispersion.
3.2.1 Biweight location estimator
The biweight location estimator is used to determine the redshift of the cluster based on the redshift of the member galaxies listed in the redMaPPer member catalogue. We chose this location estimate since it is robust in the presence of non-Gaussian initial populations and resistant to contaminated normal distributions.
3.2.2 Biweight scale estimator
3.2.3 The gapper method
3.3 Confidence intervals
Confidence intervals for the velocity dispersions were established using a bootstrap resampling with replacement. We created 10 000 resampled galaxy catalogues for each cluster in the study. We applied both the biweight scale estimate and gapper method to each of these resampled clusters. We chose our listed velocity dispersion to be the median measurement of the resampled clusters and set our confidence intervals to contain 68 per cent of the measurements around the median.
4 RESULTS
4.1 Velocity dispersions
We determined the velocity dispersions of the clusters using both the biweight scale estimate and the gapper method with the results listed in Table B1. We found that the biweight scale estimate agreed well with the gapper method that is apparent from both Table B1 and Fig. 2 showing the relation between velocity dispersion estimates for the two methods. The biweight scale estimates of 125 of the 126 clusters are contained within the confidence intervals of their respective gapper scale estimates. Because of the high level of non-Gaussianity in our sample and the presence of significantly offset interlopers, we chose to focus our investigation of the velocity dispersion–richness relation on the velocity dispersions obtained using the gapper method, since it appears to be more stable than the biweight scale estimate when considering the bootstrap resampling on our data. This choice is supported by analysis of both the biweight scale estimate and gapper method with simulated clusters showing that the gapper method returns a nearly constant estimate for the cluster velocity dispersion regardless of the number of sampled galaxies (Ferragamo et al. 2020). The velocity dispersion–richness relation using the gapper estimates is shown in Fig. 3.
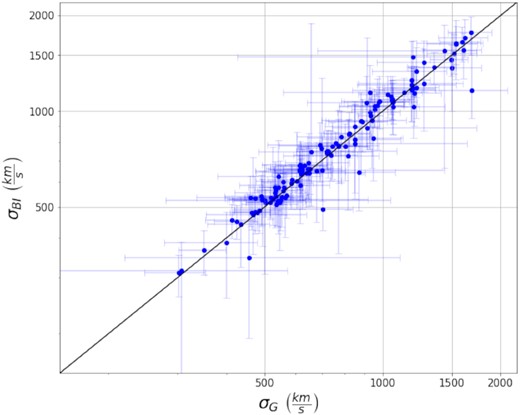
Comparison of the velocity dispersion estimators σG and σBI. The black line shows a one-to-one relation between both estimators. It is apparent that these estimators agree well for the majority of the clusters in our sample.

Velocity dispersion–richness relation for velocity dispersion estimated with the gapper method. The black line shows the λ adjusted σv–λ trend line found by Rozo et al. (2015), with the richness adjusted for the difference between SDSS and DES Y3 using equation (12). The redshift dependence is accounted for by adjusting the cluster velocity dispersion based on the cluster redshift (zp = 0.171, β = 0.54) following the redshift dependence found in Rozo et al. (2015). The σG–λ relation shows a bimodal distribution with a small but significant fraction of clusters having apparent velocity dispersions that are high for their richnesses. We use a double Gaussian fit to the residuals relative to the Rozo et al. (2015) line to separate the two populations giving best-fitting σG–λ relations for the main and outlier populations assuming the same slope as Rozo et al. (2015) but offset in normalization. The green dash–dotted line indicates the centre of the main population, while the red dotted line indicates the centre of the outlier population. The black dashed line shows a 1σ deviation from the centre of the main population. We define outlier clusters to be any systems whose velocity dispersion lower limit is above the dashed black line. Clusters that are in the volume-limited catalogue are marked with a black x. Clusters that are outliers are circled in red.
4.2 Velocity dispersion–richness relation
Inspection of the σG–λ relation in Fig. 3 reveals a bimodal distribution. The majority of clusters appear to follow a power-law relation similar to previous determinations of the velocity dispersion–richness relation (e.g. Rozo et al. 2015) with a slope of ∼0.44 (σ scales as ∼λ0.44; see equation 8 of Rozo et al. 2015). A smaller, but significant, population of clusters appear to have relatively high velocity dispersions for their richnesses.
In order to separate the two populations, we examine the residuals of the cluster velocity dispersions when compared to the trend line found by Rozo et al. (2015). We fit a double Gaussian to the residuals, as shown in Fig. 4; effectively we assume the same slope found by Rozo et al. (2015) but offset in normalization. The main population of clusters is well fit by a Gaussian peaked at −131 km s−1 relative to Rozo et al. (2015) (dot–dashed green line in Fig. 3) with a width of 126 km s−1, while the outlier population gives a secondary peak centred at 492 km s−1(dotted red line in Fig. 3) with a width of 333 km s−1. We define as outliers clusters whose lower limit on their velocity dispersion (68 per cent confidence interval) is more than one standard deviation from the σG–λ relation of the main population (dashed black line in Fig. 3). This population accounts for 17 per cent of the clusters in our sample; the selected outliers are circled in red in Fig. 3.
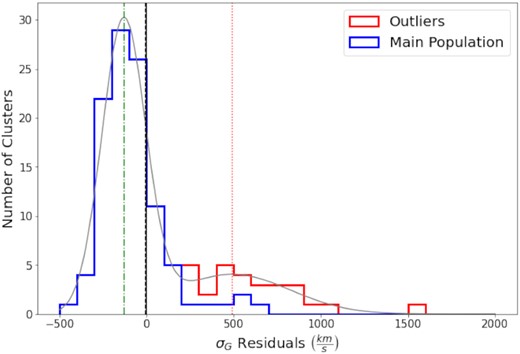
Stacked histogram of residuals between cluster velocity dispersions and the line found by Rozo et al. (2015). A double Gaussian fit to this distribution is shown in grey. The centre of the primary peak (representing the main cluster population) is at −131 km s−1 (green dot–dashed line) with a 1σ width of 126 km s−1. The centre of the secondary peak (representing the outlier population) is at 492 km s−1 (red dotted line) with a width of 333 km s−1. Using this information we chose to identify outliers as clusters whose velocity dispersion lower limit (68 per cent confidence interval) is more than one standard deviation away from the main population (black dashed line). The histogram of outlier clusters selected in this way is shown in red, and non-outliers clusters are shown in blue.
The determination of the velocity dispersion–richness relation in Rozo et al. (2015) was based on fits to the stacked velocity offsets of pairs of galaxies, specifically the velocity offset of redMaPPer centrals from other redMaPPer member galaxies, rather than individual clusters as analysed here. The higher normalization may then stem from their sample containing galaxies in a mix of both typical clusters and the outlier population. Rines et al. (2018) studied the velocity dispersion–richness relation using Hectospec spectroscopy for 27 high-richness, low-redshift SDSS redMaPPer clusters. Both the normalization and slope of their σ–λ relation are in good agreement with what we find, though their expanded sample extending to lower richness clusters has a slope that is too shallow compared to our data (Rines et al. 2018).
Fig. 3 shows the σG–λ relation for clusters drawn from the ‘full’ redMaPPer catalogue with no limitation on redshift. The redMaPPer performance is less robust at lower redshifts, due to the lack of u-band data, and at higher redshifts, due to incompleteness of the galaxy catalogues at Y3 depth. Furthermore, DES cluster cosmology studies have typically adopted a redshift range of 0.2 < z < 0.65. The ‘full’ catalogue, as compared to the volume-limited catalogue, includes data where the local depth is not deep enough to reach the 0.2L* limit used to calculate λ and so includes clusters with extrapolation of their richnesses. As a first test, we consider the σG–λ relation for only clusters in the volume-limited catalogue with 0.20 < z < 0.65, shown in Fig. 3 as black xs. The relation between velocity dispersion and richness including the appearance of a bimodal population is very similar, albeit with lower statistics, indicating that the outlier population does not simply stem from clusters with less robust selection compared to the core redMaPPer sample.
Investigation of the velocity distributions for the outlier clusters reveals that they are truly broad and often non-Gaussian; only one or two show indications of a bimodal velocity distribution. The individual and stacked histograms of all clusters in our sample are shown in Appendix A. In Appendix A, we also look at the effect of employing a more stringent initial selection of potential cluster members. This has the effect of somewhat reducing the velocity dispersions of the outlier clusters but they still appear as a population with higher normalization in the σG–λ relation. This test again shows that the velocity distributions are broad and fairly continuous, not simply influenced by a small number of galaxies with large velocity offsets.
Several factors can act to inflate the observed velocity dispersion including projection effects of structure along the line of sight, the presence of substructure or correlated structures, and unremoved interloping galaxies in the foreground or background. On the flip side, there are effects that can act to reduce the observed richness of redMaPPer-selected clusters, including miscentring and percolation (Costanzi et al. 2019; Zhang et al. 2019). If the origin of this population is related to cluster selection and characterization (e.g. projection effects and miscentring), it would have important implications for cosmological studies perhaps indicating significant richness scatter or impurity in the cluster catalogue. In Section 5, we further investigate the origin of these clusters.
4.3 Central galaxy velocity distribution
In addition to cluster velocity dispersions, we can also examine the redMaPPer redshift accuracy and the peculiar velocity distribution of the galaxies redMaPPer identifies as likely central galaxies. In this section, we examine central cluster redshifts, and we will return to examination of the velocity dispersion outliers in Section 5.
We examined several cluster redshifts for the clusters in our study including the redMaPPer estimated redshift, the redMaPPer central galaxy redshift, and the biweight location estimate based on spectroscopic measurements. Fig. 5 shows the distribution of velocity offsets between the redMaPPer estimated redshift and the biweight location for all clusters, and the distribution of velocity offsets between the central galaxy redshift and the biweight location for the 91 clusters with central galaxy spectra. The standard deviation of the redMaPPer redshifts compared to the biweight location is 0.0067. This dispersion is similar to previous determinations of the redMaPPer redshift performance; for example, McClintock et al. (2019) find a redshift scatter, when compared to spectroscopic redshifts for the central galaxy, of σcentral galaxy/(1 + z) ∼ 0.006.
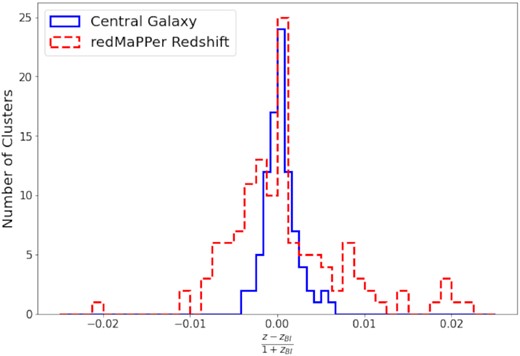
Difference in redshift between the biweight location estimate of the central cluster redshift and the redMaPPer estimated cluster redshift in z = 0.0013 wide bins (dashed red). Difference in redshift between the biweight location estimate and the redMaPPer central galaxy spectroscopic redshift where available in z = 0.00083 wide bins (solid blue).
Fig. 5 shows that the central galaxy peculiar velocities and biweight location are fairly tightly correlated with the standard deviation being 0.0018. None the less, there are putative central galaxies with velocity offsets compared to the overall cluster of up to 2000 km s−1. There are two likely origins of these large offsets. The first is ongoing or recent cluster merging activity. The second is that redMaPPer misidentified the central galaxy; miscentring by redMaPPer occurs for ∼20–30 per cent of clusters (Zhang et al. 2019). Significant velocity offsets of centrals for clusters that are otherwise well centred and relaxed could be an indicator of self-interacting dark matter, which creates cored dark matter profiles allowing for larger oscillation of the central galaxy within the halo (Kim, Peter & Wittman 2017).
5 INVESTIGATION OF BIMODAL σG–λ POPULATIONS
In this section, we examine the bimodal populations of galaxy clusters in σG–λ space. The two populations that are apparent in Fig. 3 are one, containing the majority of galaxy clusters, that has roughly the same slope as found by Rozo et al. (2015) but offset to lower velocity dispersions and a smaller population with relatively low richnesses and high velocity dispersions. As previously, we define the outlier population to be clusters with confidence intervals that remain above one standard deviation from the main population.
There are a few possible origins of the outlier population. First, they may be truly massive clusters whose richness is underestimated. This can occur, for example, if redMaPPer significantly miscentres the cluster thus counting galaxies around the wrong location (Zhang et al. 2019). On the flip side, they may be lower mass clusters as indicated by their richness whose velocity dispersions are inflated by correlated structure (e.g. filaments and superclusters), merging activity, or unremoved interloper galaxies. In fact, using simulated clusters, Saro et al. (2013) find that the interloper fraction in spectroscopic samples is expected to increase for both lower mass and higher redshift clusters as seen here, though the definition of interlopers in that work does not distinguish between contaminating galaxies in correlated structure and unrelated foreground and background galaxies. We will use interlopers to mean a small number of unrejected background or foreground galaxies and argue that this is unlikely to be a dominant origin of the outliers, while correlated structure, galaxies in nearby superstructures or filaments, are a likely origin.
In the case of correlated structure, it is possible the observed richness is also biased high compared to the halo mass due to projection effects (Costanzi et al. 2019). RedMaPPer downweights the membership probabilities, and therefore richness, for galaxies that are offset in colour and radius from the cluster centre; this weighting mitigates though does not remove the effects of projection on richness estimation (Costanzi et al. 2019; Myles et al. 2021). Thus, we might expect a larger bias in velocity dispersion compared to richness for crowded lines of sight. For example, a filamentary structure along the line of sight may have a very high velocity dispersion with a moderate/low richness that is none the less high for the true virialized mass impacting its selection.
Understanding the nature of the velocity dispersion outliers can give us insight into the types of systems that redMaPPer selects. In the following subsections, we further examine their properties including the individual and stacked velocity distributions of these clusters (Section 5.1), their spatial and redshift distributions (Section 5.2), and their X-ray properties compared to the main population (Section 5.3).
5.1 Velocity distributions and interlopers
It is difficult from sparse spectroscopic data to entirely rule out contamination from interlopers, and these may be the cause of some of the outliers. However, a few factors argue against this being the dominant source of the outliers. First, inspection of Fig. A1, which shows the individual peculiar velocity distributions of all clusters in our sample, sheds light on the shape of the velocity distributions of the outlier population. Many of these clusters appear to have intrinsically broad distributions. Second, cuts on galaxy membership probability (Fig. A3) or a more stringent initial cut on peculiar velocity (Fig. A7) that reduce interlopers do not significantly change the outlier population. In particular, a cut on membership probability at first appears to remove outliers (Fig. A5); however, this was almost entirely due to individual clusters dropping below the 15 members limit for study.
Fig. 6 shows the stacked velocity distribution of the outlier population compared to those of rich clusters with similar velocity dispersion (λ > 70 and σG > 1000 km s−1) and clusters of similar richness with low velocity dispersion (λ < 70 and σG < 1000 km s−1). If the outlier clusters were simply lower mass clusters with significant contamination, we might expect to see a narrower Gaussian component, similar to other low richness clusters, plus large wings in the stacked distribution. Instead the stacked outlier population has a fat Gaussian distribution very similar to that of richer clusters. Furthermore, a Kolmogorov–Smirnov test was unable to reject the null hypothesis that the distribution of stacked member galaxies from the outlier population was drawn from the same population as the high richness, high velocity dispersion population (λ > 70, σG > 1000 km s−1) with a p-value of 0.45. If contamination from interlopers contributed significantly to the outlier population, we would expect the stacked high richness, high velocity dispersion distribution to be markedly different than the stacked outlier distribution.
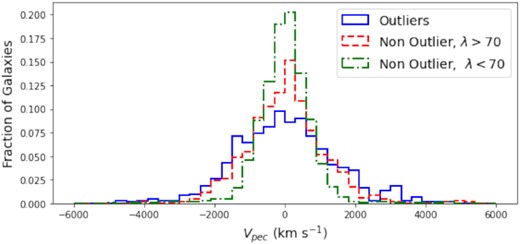
The fraction of galaxies in peculiar velocity bins for stacks of different cluster populations. The outlier population is shown in solid blue, the main population at high richness is shown in dashed red, and the main population at low richness is shown in dotted green.
The above suggests that at least some of the outlier clusters are massive clusters that have been assigned a low richness for their mass, that these are unvirialized structures, or that they are lower mass haloes living in regions with significant filamentary/correlated structure. It is also possible that many of them are merging clusters with some line-of-sight separation that cannot be distinguished with our limited spectroscopy, but this does not appear to be the case in Fig. A1.
5.2 Projection effects and correlation with redshift
An intrinsic difficulty in cluster selection from photometric data is the inability to distinguish cluster members from galaxies in projection, and galaxies ∼100 Mpc in front of or behind the clusters can be included by redMaPPer as potential member galaxies (Sohn et al. 2018; Costanzi et al. 2019). These projection effects lead to a preferential selection of clusters with correlated structure along the line of sight (Abbott et al. 2020; Sunayama et al. 2020; Wu et al. 2022). If the outlier clusters live in regions with filaments and/or supercluster environments, this could lead to the enhanced velocity dispersions, and the prevalence of these systems would tell us about the redMaPPer selection.
In fact, four of the outlier clusters (MEM_MATCH_IDs 2462, 2868, 24911, and 38983) lie within the same ∼2 deg2 patch of sky and within 0.1 in redshift, as shown in Fig. 7. A fifth cluster in this field and redshift range, MEM_MATCH_ID 3610, also has a high best-fitting velocity dispersion but with large uncertainties due to a potentially bimodal velocity distribution (see Fig. A1). There are also several additional redMaPPer clusters in the same field with similar redshifts but lacking sufficient spectroscopy for velocity dispersion estimates. It is not rare for λ > 20 clusters to appear close in projection and redshift to each other, and the overall density of clusters in this field is not particularly unusual. However, three of these clusters have λ > 50, and the spacing of two of these (2462 and 2868) within |$0{_{.}^{\circ}}25$| and Δz of 0.01 is rare (2 per cent of λ > 50 clusters in the redMaPPer catalogue).
![Top: DES Y3A2 r-band mosaic ($1{_{.}^{\circ}}5$ per side) of a superstructure at z ∼ 0.7. Circles mark the positions of redMaPPer λ > 20 clusters in a redshift range 0.6 < z < 0.8. Circle size indicates Rλ = (λ/100)0.2 h−1 Mpc, and region labels list z, λ; clusters in the velocity dispersion catalogue are also labelled with their MEM_MATCH_ID. Clusters that are velocity dispersion outliers are indicated in green; MEM_MATCH_ID 3610 that has a high best-fitting velocity dispersion but large uncertainties on σG is indicated in magenta, and additional clusters at similar redshifts in cyan. The cyan clusters do not have sufficient spectroscopy for velocity dispersion determination. This superstructure contains at least four high velocity dispersion, low-richness clusters. Bottom: normalized richness scanned over redshift, λ(z)/max[λ(z)], for the outlier clusters above (green circles) and 3610 (magenta circle) that are in the volume-limited redMaPPer catalogue. These are compared to the normalized λ(z) expected for a cluster without any projection at z = 0.65 (dashed purple line), and the 68 per cent and 95 per cent distribution of λ(z) at the same redshift (dark and light cyan bands).](https://oup.silverchair-cdn.com/oup/backfile/Content_public/Journal/mnras/514/4/10.1093_mnras_stac1623/1/m_stac1623fig7.jpeg?Expires=1750315909&Signature=pE5RuTe0uddqTAB99GSzWKPTnzWF6dd8IIHfW1V3CHeUr9RfWi3CUkI-VBp5zUWMgmD3nnoNCV74nxMBe-sAklVPjjzUpRfCm0-3kM5bimE0tvAkiOQqIneRl9ocp~ZhTyU5YyHEi5UsV3QvNflOsjX7Ele7AlLEq80zwKYte2pWoqOLtz45UHxPftPJL5zEqzjNTVXMHAzbb9Ehoc4~SkU-vngwtrU3w73ljuswMJToGxnoe0L2MOPjXu6eopWeHwzafKgGk4bYfv8J6NsCxDGFlQwWhDe-t5vnIp9cgx8sZLAl0QlXCAjxwFYIPr8krSe-PGWyCBUt3TiAWREyqg__&Key-Pair-Id=APKAIE5G5CRDK6RD3PGA)
Top: DES Y3A2 r-band mosaic (|$1{_{.}^{\circ}}5$| per side) of a superstructure at z ∼ 0.7. Circles mark the positions of redMaPPer λ > 20 clusters in a redshift range 0.6 < z < 0.8. Circle size indicates Rλ = (λ/100)0.2 h−1 Mpc, and region labels list z, λ; clusters in the velocity dispersion catalogue are also labelled with their MEM_MATCH_ID. Clusters that are velocity dispersion outliers are indicated in green; MEM_MATCH_ID 3610 that has a high best-fitting velocity dispersion but large uncertainties on σG is indicated in magenta, and additional clusters at similar redshifts in cyan. The cyan clusters do not have sufficient spectroscopy for velocity dispersion determination. This superstructure contains at least four high velocity dispersion, low-richness clusters. Bottom: normalized richness scanned over redshift, λ(z)/max[λ(z)], for the outlier clusters above (green circles) and 3610 (magenta circle) that are in the volume-limited redMaPPer catalogue. These are compared to the normalized λ(z) expected for a cluster without any projection at z = 0.65 (dashed purple line), and the 68 per cent and 95 per cent distribution of λ(z) at the same redshift (dark and light cyan bands).
This superstructure, containing four of 21 outlier clusters, hints that a significant fraction of the outlier population originates from the presence of correlated structure. Additional outlier clusters lie close in volume to each other and to other redMaPPer clusters, but again these associations are relatively common and the presence of nearby clusters alone is not sufficient to identify outliers. The bottom panel of Fig. 7 shows the distribution in richness when the λ calculation is scanned over redshift, λ(z), for the outlier clusters in the volume-limited redMaPPer catalogue belonging to the z ∼ 0.7 superstructure and also including MEM_MATCH_ID 3610. These distributions are compared to the λ(z) expected for a cluster with no projection at z = 0.65 and the 68 per cent and 95 per cent distributions of λ(z) at the same redshift (Costanzi et al. 2019). A wide λ(z) may be an indication of significant line-of-sight structure. While a couple of the outlier clusters have λ(z) that are somewhat wide compared to other clusters, particularly MEM_MATCH_ID 2868, they are generally within ∼2σ of expectations for their redshifts. In general, the full outlier population does not exhibit a significantly wider λ(z) distribution compared to redMaPPer clusters at similar redshifts. The fact that the outlier clusters are not clearly different in this metric highlights the difficulty of identifying complicated sightlines in photometric data.
Projection effects in the redMaPPer catalogue are expected to increase with redshift due to the fattening of the red sequence and the difficulties associated with establishing photometric redshifts of high-redshift galaxies. Looking at the redshift distribution, the outlier population does appear to have a significantly higher average redshift than clusters with a similarly low richness. This is apparent in Fig. 8 that shows σG–λ colour coded by redshift. While overall the outliers make up 22 per cent of the λ < 70 clusters in our sample, they account for more than half of the z > 0.5, λ < 70 clusters (11 out of 20). The presence of the outlier population and the redshift correlation is still present when limiting the sample to clusters in the volume-limited redMaPPer cluster catalogue with a redshift range of z ∈ [0.2, 0.65].
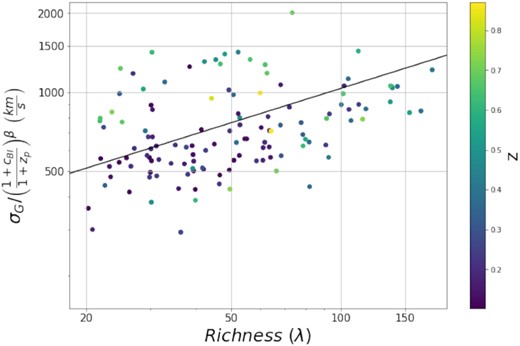
Velocity dispersion versus cluster richness with cluster redshift shown on the colour axis. The outlier population appears to have a higher average redshift than the main population of clusters. The black line is the λ adjusted σv–λ relation found by Rozo et al. (2015).
Fig. 9 shows the stacked histograms of the clusters with a redshift of z > 0.5 that are outliers or non-outliers, respectively. The histogram of the outlier population is broader than that of the non-outlier population that suggests that the outlier population is not strictly due to the challenges associated with photometrically determining the redshift of red-sequence galaxies at high redshifts.
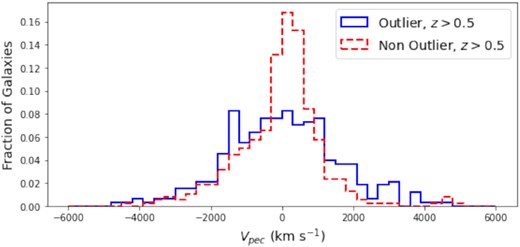
Histogram of the fractions of galaxies from the outlier (solid blue) and non-outlier (dashed red) populations at redshift z > 0.5. At high redshift the non-outlier stacked population is narrower than the outlier stacked population.
An important question is whether the redMaPPer assigned richnesses of the outlier clusters correctly reflect their underlying mass. λ is computed as a sum of redMaPPer estimated galaxy membership probabilities, PMEM, with membership probability downweighted for galaxies as a function of distance in colour and radius from the central cluster values. While the redMaPPer PMEM values are an indicator of whether a galaxy is more or less likely to be a cluster member and give λs that scale with mass with relatively low scatter, they are not a perfectly calibrated probability of cluster membership leading to biases in richness from projection and other effects (Rines et al. 2018; Costanzi et al. 2019; Myles et al. 2021). To explore the redMaPPer assigned richnesses of clusters in the outlier population, in Fig. 10 we investigate the velocity distributions as a function of PMEM.
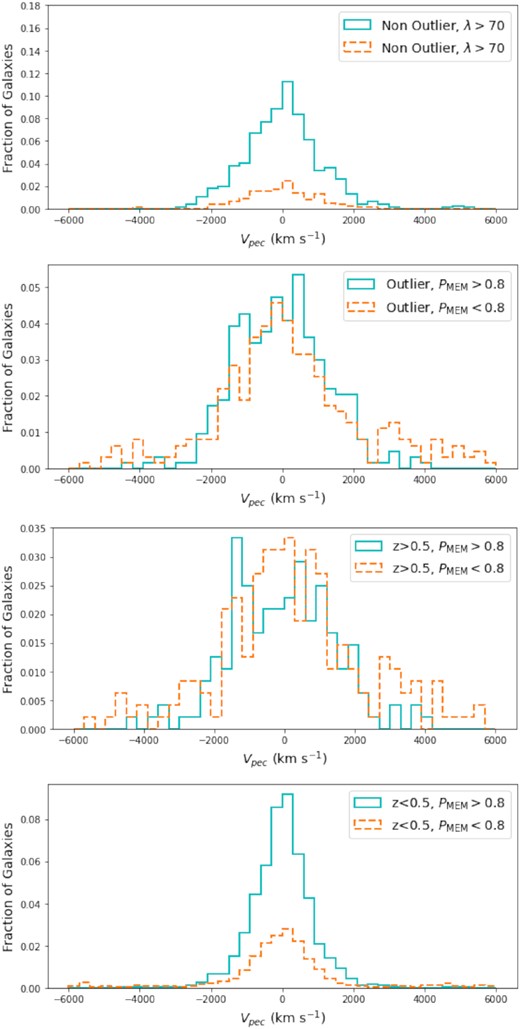
Stacked histograms of the fraction of galaxies from clusters in different populations in peculiar velocity bins separated by PMEM. Galaxies with PMEM > 0.8 are shown by the solid blue histogram. Galaxies with PMEM < 0.8 are shown by the dashed orange histogram. Top: the main population at high richness that appears most similar to the outlier population in Fig. 6. Middle top: the outlier population. Middle bottom: population of clusters with redshift z > 0.5. Bottom: population of clusters with redshift z < 0.5.
The top histogram shows the main cluster population at high richness separated for galaxies with PMEM > 0.8 and PMEM < 0.8. We chose a threshold of PMEM = 0.8 as it provided similar results to that of PMEM = 0.5 without drastically limiting our sample size. It is apparent that these clusters on average have few spectroscopic members with low PMEM. The second histogram from the top shows the outlier population. The low PMEM galaxies form a broader distribution and account for a far more significant fraction of the galaxies in this population of clusters. This may be accounted for by the high average redshift of the outlier population as can be seen from the third histogram that shows the galaxies in clusters with redshift z > 0.5. Again, the low PMEM galaxies account for a large fraction of this population and have a slightly broader distribution.
In general, redMaPPer clusters of similar richness at high redshift are composed of a larger number of potential cluster member galaxies with on average lower membership probabilities than their counterparts at lower redshift due to the increasing width of the red sequence and photometric redshift uncertainties. In contrast the bottom histogram shows the stacked histogram of low-redshift, z < 0.5, clusters. These clusters have a much smaller fraction of galaxies with low PMEM. The low PMEM galaxies do form a broader distribution reflecting the fact that a larger fraction of these galaxies are not cluster members, as expected.
The outlier clusters do not look substantially different than other high-redshift, redMaPPer clusters in terms of membership probabilities, while they do have wider velocity distributions (as seen in Fig. 9). We next turn to X-ray data where available to better understand the mass of these systems.
5.3 Comparison to X-ray properties
X-ray data where available can help distinguish massive from low-mass clusters as well as allowing us to determine whether redMaPPer has chosen the correct central galaxy. If the high velocity dispersions of the outlier clusters are indicative of a high mass, we expect to see luminous and hot X-ray emission. In this case, the most likely reason for the low measured λs is miscentring by redMaPPer. If instead the velocity dispersions are inflated by the projection of correlated structure, we would expect fainter or no X-ray emission. The question in this case is whether the measured λs are consistent with the X-ray signal or if the richness calculation is also biased by projection effects.
Fig. 11 shows σG–TX and TX–λ for the clusters in our sample compared to relations from the literature, while Fig. 12 shows the LX–σG and LX–λ relations including upper limits for undetected clusters. There is a well-known systematic offset between cluster X-ray temperatures estimated with XMM and Chandra (Schellenberger et al. 2015), and it is important when comparing the two to put them on the same scale. We adjust the Chandra temperatures to the XMM scale using the relation in Rykoff et al. (2016) derived through the comparison of 41 SDSS redMaPPer clusters observed with both instruments. Outlier clusters are circled in red.
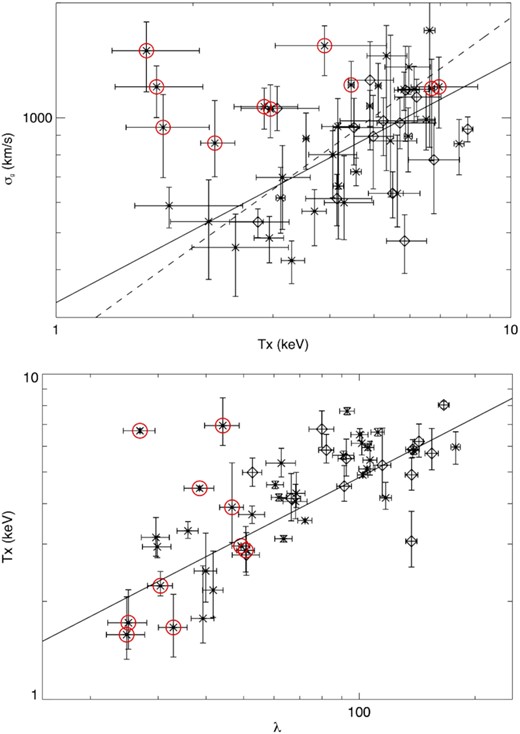
Top: velocity dispersion–temperature relation compared to the relations from Farahi et al. (2018) (solid line) and Wilson et al. (2016) (dashed line) for X-ray selected samples observed with XMM. Bottom: temperature–richness relation compared to the relation from Farahi et al. (2019) for DES Y1 redMaPPer clusters (solid line). In both plots, XMM temperature measurements are plotted with asterisks and Chandra measurements with diamonds. Chandra temperatures have been adjusted to the XMM scale using the relation from Rykoff et al. (2016). The TX–λ relation from Farahi et al. (2019) has likewise been adjusted to the XMM temperature scale. Velocity dispersion outlier clusters are circled in red.
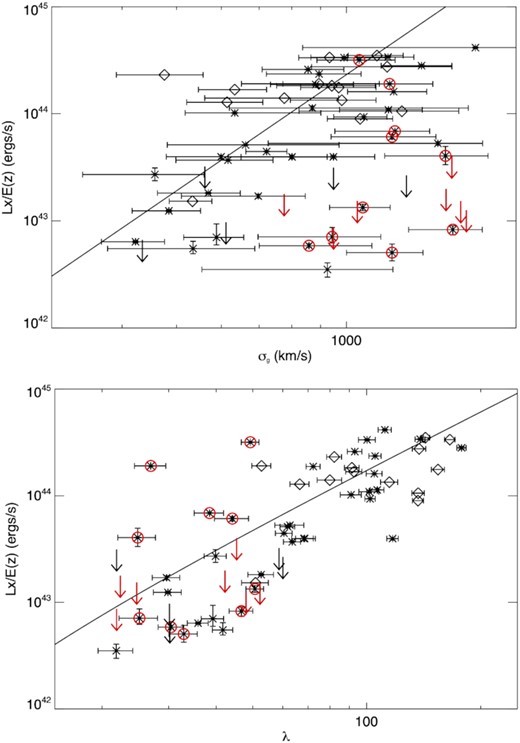
Top: luminosity–velocity dispersion relation compared to the relation from Popesso et al. (2005) (solid line), specifically the relation from that reference with velocity dispersion determined from the red members, and we have converted the 0.1–2.4 keV luminosities to the 0.5–2 keV band. Bottom: luminosity–richness relation compared to the relation from Hollowood et al. (2019) (solid line) for SDSS redMaPPer clusters, specifically the relation from that reference which includes luminosity upper limits for undetected clusters. In both plots, XMM measurements are plotted with asterisks and Chandra measurements with diamonds. Velocity dispersion outlier clusters are circled in red or plotted with red arrows.
These figures reveal that the outliers in σG–λ form a mixed population. For some outlier clusters, the high velocity dispersion is matched by a relatively high X-ray temperature. In particular for two clusters, MEM_MATCH_ID 1688 with TX = 6.7 keV and MEM_MATCH_ID 17296 with TX = 7.0 keV, the high temperatures are inconsistent with the low measured richness. The former of these clusters, 1688, is badly miscentred by redMaPPer, as shown in Fig. 13. Missing DES data at the location of the X-ray bright cluster Abell 209 causes redMaPPer to miss the true centre of this cluster; instead it finds a low-richness system near the outskirts offset by 2.4 Mpc from the X-ray centre. In general, another possibility would be that there is a separate group of galaxies near the massive, X-ray cluster; however, in this case, we have confirmed in the preliminary DES Y6 catalogue, in which the missing DES data has been filled in, which redMaPPer finds a single, rich cluster at the location of the X-ray cluster. The second, high TX cluster, 17296, has an estimated redshift of z = 0.82 and is not in the volume-limited redMaPPer catalogue. At these redshifts the richness estimate is less accurate as the depth is not sufficient to confidently detect fainter cluster galaxies. Cluster 17296 is also miscentred, but only by 260 kpc with respect to the X-ray centre, and recalculating the richness at the X-ray position does not significantly change the richness estimate. Besides these two clusters, there are a couple of additional outlier clusters whose X-ray temperatures are somewhat high for their richnesses, but these are within the scatter in TX–λ. These same clusters are consistent within the scatter with the σG–TX relation.
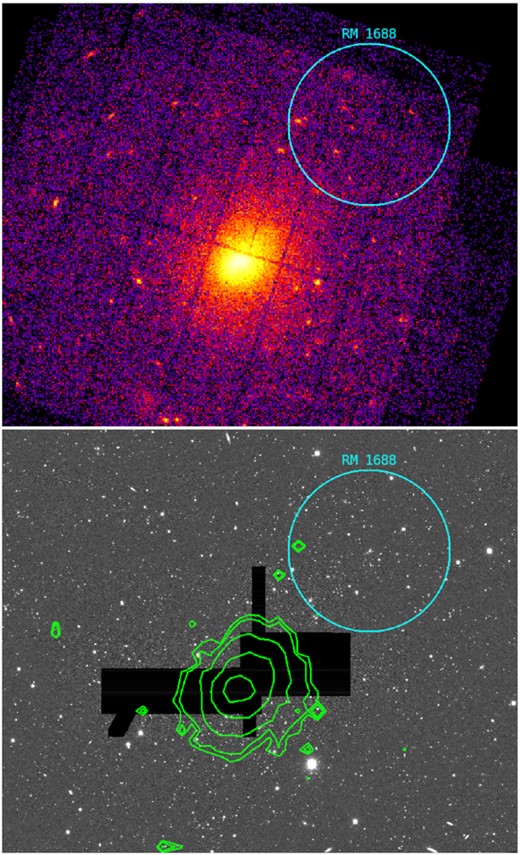
Example of a velocity dispersion outlier, MEM_MATCH_ID = 1688, that is X-ray bright, but miscentred by redMaPPer due to masking in the DES data. The high velocity dispersion comes from sampling galaxies in the outskirts of a massive cluster. Top: XMM–Newton image of Abell 209 at z = 0.206. RedMaPPer finds a low richness, λ = 27, cluster with a similar redshift, z = 0.21, offset from the X-ray cluster. The cyan circle marks the redMaPPer position and radius, Rλ = 5 arcmin. Bottom: DES Y3A2 r-band image with X-ray contours overlaid in green and redMaPPer cluster region in cyan. The position of Abell 209 is masked due to missing data.
The X-ray data indicate that miscentring is one reason for the velocity dispersion outliers, but not the dominant one. Comparing to the X-ray peak position, we find that six of the 10 outlier clusters that are X-ray detected are miscentred by 100 kpc or more, a much higher fraction than for the cluster population overall. However, with the exception of 1688 they are all miscentred by less than 1 Mpc, and their richness estimates increase by less than 15 per cent when centring on the X-ray position. For 1688, the missing data means that we cannot calculate an appropriate richness, but this hot, Abell cluster would be expected to have a high richness.
A second component of the outlier clusters is detected in X-ray with lower temperatures and luminosities. The velocity dispersions of these clusters are high compared to their X-ray properties and are likely inflated by correlated structure along the line of sight. A third portion of the outlier clusters is undetected in X-ray. These non-detections are in most cases inconsistent with the high measured velocity dispersion, again pointing to contributions to the velocity dispersion of structure along the line of sight.
An interesting question is whether the richnesses of the outlier clusters reflect their X-ray properties or if they appear to be biased by projection and correlated structure. Aside from 1688 and 17296 clusters, the richnesses of the X-ray detected clusters are consistent with their X-ray temperatures within the scatter. For most of the undetected clusters, the depth of the data is insufficient to judge, with the LX upper limits being consistent with richness at least within the large LX–λ scatter. There is a tendency for the undetected, outlier clusters to scatter low in the LX–λ relation. While unclear from the current sample, this potentially indicates the richnesses of some of these clusters may be overestimated due to projection. Deeper X-ray data are needed to confirm whether the undetected systems are truly virialized clusters or whether these are primarily projection effects where a filamentary structure or a string of small haloes has been incorrectly identified as a significant cluster.
6 CONCLUSION
In this paper, we calculate the velocity dispersions of galaxy clusters contained in the redMaPPer DES Y3 cluster catalogue using available spectroscopic redshifts from external catalogues of galaxies identified as possible cluster member galaxies by redMaPPer. Limiting the sample to clusters with sufficient statistics for velocity dispersion estimation, defined here as at least 15 spectroscopic members after interloper rejection, gives a total sample of 126 clusters. The cluster velocity dispersions are examined as a function of richness, redshift, and X-ray properties.
Investigation of the velocity dispersions in comparison to cluster richness reveals a bimodal population. The main population follows a similar σv–λ relation to that found by Rozo et al. (2015) for stacked spectroscopy of SDSS clusters. However, there are a significant fraction of clusters with velocity dispersions that are high compared to their richnesses, referred to as the outlier population. Defining outliers to be clusters whose lower limit on their velocity dispersion place them more than one standard deviation in the scatter high compared to the main population, this population makes up 17 per cent of the cluster sample and 22 per cent of clusters with richness λ < 70. These clusters tend to lie at higher redshifts, composing more than half (55 per cent) of λ < 70, z > 0.5 clusters. However, they do have wider velocity distributions than non-outlier clusters at similar redshifts.
Examination of the individual cluster velocity distributions and tests of a more conservative interloper rejection (Appendix A) indicate that the high velocity dispersions of the outliers do not appear to be the result of unrejected foreground or background galaxies or bimodal distributions in velocity space. Most of these clusters simply appear to have wide, flat velocity distributions. It remains possible, given our relatively sparse samples for some of these clusters, that a few of them have enhanced velocity dispersions due to the influence of unrejected interloping galaxies or mergers. However, it is likely that many of these systems lie in regions with significant line of sight and correlated structure. The photometric cluster selection, particularly at higher redshifts, can preferentially select this type of system (Costanzi et al. 2019; Abbott et al. 2020; Wu et al. 2022). The outliers do not appear to have significantly different membership probability distributions or wider distributions of richness in redshift space, λ(z), compared to clusters at similar redshifts, showing the difficulty in distinguishing line-of-sight structure from photometry.
Comparison to the cluster X-ray properties, where available, shows that a couple of the outlier clusters are hot, X-ray bright systems consistent with a high velocity dispersion and mass. One of these clusters is a bright Abell cluster that is very miscentred by redMaPPer due to gaps in the DES data coverage at the cluster location. However, most of the outlier clusters with X-ray data have low temperature and luminosity or are undetected in X-ray, implying lower mass systems. Some of the outliers have richnesses consistent with their X-ray properties, but in general the sample size and depth of data in the case of non-detections are insufficient to make firm statements. It is possible in some cases that the richnesses of these systems are overestimated due to projection effects. The main cluster population has X-ray–σ and X-ray–λ relations similar to previous works.
In terms of the central velocity, we find that the standard deviation of the offset between the redMaPPer estimated cluster redshift from that of the biweight location calculated from the spectroscopy is σ/(1 + z) = 0.0067, which is similar to the previously established redMaPPer redshift scatter of 0.006 (McClintock et al. 2019). The redMaPPer central galaxy offsets were found to have a small standard deviation of 0.0018; however, there were several clusters with central galaxies that have velocity offsets up to 2000 km s−1. These are likely the result of misidentification of the central by redMaPPer or cluster merging activity.
Our results indicate that projection effects likely contribute significantly to redMaPPer cluster selection and possibly also richness estimation, particularly at lower richness and higher redshifts. In fact, modelling of the mass–richness relation using Sunyaev–Zel’dovich (SZ) effect clusters from the South Pole Telescope–Sunyaev–Zel’dovich (SPT–SZ) survey implies a growing contamination of redMaPPer samples as richness decreases by low-mass objects boosted into the richness selected samples (Grandis et al. 2021) with estimated fractions of contaminants consistent with the fraction of velocity dispersion outliers found here. For lower redshift, SDSS redMaPPer clusters, Myles et al. (2021) also find that projection effects account for a growing fraction of the observed richness of lower richness clusters. A more quantitative understanding of these effects requires larger samples and more complete spectroscopy, particularly at high redshift, which is the goal of ongoing follow-up efforts.
ACKNOWLEDGEMENTS
This work was supported by the U.S. Department of Energy, Office of Science, Office of High Energy Physics, under Award Numbers DE-SC0010107 and A00-1465-001. AS is supported by the ERC-StG ‘ClustersXCosmo’ grant agreement 716762, by the FARE-MIUR grant ’ClustersXEuclid’ R165SBKTMA, and by INFN InDark Grant. PTPV was supported by Fundação para a Ciência e a Tecnologia (FCT) through research grants UIDB/04434/2020andUIDP/04434/2020.
Funding for the DES Projects has been provided by the U.S. Department of Energy, the U.S. National Science Foundation, the Ministry of Science and Education of Spain, the Science and Technology Facilities Council of the United Kingdom, the Higher Education Funding Council for England, the University of Illinois at Urbana-Champaign - National Center for Supercomputing Applications, the Kavli Institute of Cosmological Physics at the University of Chicago, the Center for Cosmology and Astro-Particle Physics at the Ohio State University, the Mitchell Institute for Fundamental Physics and Astronomy at Texas A&M University, Financiadora de Estudos e Projetos, Fundação Carlos Chagas Filho de Amparo à Pesquisa do Estado do Rio de Janeiro, Conselho Nacional de Desenvolvimento Científico e Tecnológico and the Ministério da Ciência, Tecnologia e Inovação, the Deutsche Forschungsgemeinschaft, and the Collaborating Institutions in the Dark Energy Survey.
The Collaborating Institutions are Argonne National Laboratory, the University of California, Santa Cruz, the University of Cambridge, Centro de Investigaciones Energéticas, Medioambientales y Tecnológicas – Madrid, the University of Chicago, University College London, the DES-Brazil Consortium, the University of Edinburgh, the Eidgenössische Technische Hochschule Zürich, Fermi National Accelerator Laboratory, the University of Illinois at Urbana-Champaign, the Institut de Ciències de l’Espai (IEEC/CSIC), the Institut de Física d’Altes Energies, Lawrence Berkeley National Laboratory, the Ludwig-Maximilians-Universität München and the associated Excellence Cluster Universe, the University of Michigan, NFS’s NOIRLab, the University of Nottingham, The Ohio State University, the University of Pennsylvania, the University of Portsmouth, SLAC National Accelerator Laboratory, Stanford University, the University of Sussex, Texas A&M University, and the OzDES Membership Consortium.
This study is based in part on observations at Cerro Tololo Inter-American Observatory at NSF’s NOIRLab (NOIRLab Prop. ID 2012B-0001; PI: J. Frieman), which is managed by the Association of Universities for Research in Astronomy (AURA) under a cooperative agreement with the National Science Foundation.
The DES data management system is supported by the National Science Foundation under grant numbers AST-1138766 and AST-1536171. The DES participants from Spanish institutions are partially supported by MICINN under grants ESP2017-89838, PGC2018-094773, PGC2018-102021, SEV-2016-0588, SEV-2016-0597, and MDM-2015-0509, some of which include ERDF funds from the European Union. IFAE is partially funded by the CERCA program of the Generalitat de Catalunya. Research leading to these results has received funding from the European Research Council under the EU Seventh Framework Programme (FP7/2007-2013) including ERC grant agreements 240672, 291329, and 306478. We acknowledge support from the Brazilian Instituto Nacional de Ciência e Tecnologia (INCT) do e-Universo (CNPq grant 465376/2014-2).
This paper has been authored by Fermi Research Alliance, LLC under contract no. DE-AC02-07CH11359 with the U.S. Department of Energy, Office of Science, Office of High Energy Physics.
DATA AVAILABILITY
The data underlying this paper are available at https://des.ncsa.illinois.edu/releases/dr2/dr2-docs and https://docs.datacentral.org.au/ozdes/overview/ozdes-data-release/. The redMaPPer catalogue used proprietary to the Dark Energy Survey Collaboration, but will be released upon publication of the Y3 cluster cosmology papers.
REFERENCES
APPENDIX A: VELOCITY DISTRIBUTIONS AND INTERLOPER REJECTION
In this appendix, we present peculiar velocity histograms with their corresponding bootstrap σG distribution for all clusters in our sample (Fig. A1) and the stacked histogram for all clusters (Fig. A2). We also explore the effect of making a cut on PMEM or a more conservative initial interloper rejection.
The initial removal of interlopers was performed using the richness-dependent cut from Section 3. Interlopers were further rejected by a 3σ cut applied and iterated on for both the biweight and gapper methods. The interlopers found using this method are shown in red in Fig. A1. There are a number interloping galaxies with peculiar velocity differences greater than 4000 km s−1 that are not shown in Fig. A1. To examine our interloper rejection we stacked all of the clusters together in Fig. A2. This figure shows an overall good separation of interloper galaxies from the central cluster component, though the accuracy for individual clusters will vary given the spectroscopic sampling. There are several clusters with non-rejected members that appear to have large velocity offsets from the main galaxy population (151, 205, 6483, etc.). While these members would skew a single velocity dispersion statistic of the cluster, bootstrapping provides for a more robust velocity dispersion estimate with confidence intervals that accurately represent the probability distribution of σG.
Membership probability as determined by the redMaPPer algorithm was considered for interloper rejection but after stacking the galaxies from all of the clusters for different PMEM limits (shown in Fig. A3), we observed little difference in the shape of the stacked histograms. Furthermore, we stacked all of the galaxies from the outlier population in Fig. A4 for the same PMEM limits that once again made little difference in the shape of the histograms. The similarity in the shapes of the stacked histograms suggests that applying any PMEM limit to our interloper rejection would not measurably alter our velocity dispersions. Indeed, we find little change in the overall σG–λ relation when applying a PMEM cut other than a reduction in the number of clusters that meet our criterion of having 15 spectroscopic members for fitting the velocity dispersion, which is shown in Fig. A5. To be specific, cluster 648 enters the outlier population and cluster 1839 exits the outlier population.
Another potential method of interloper rejection is a cut on distance from the redMaPPer assigned centre, R/R(λ). However, we found this to be an ineffective way of limiting the outlier population. Fig. A6 shows a strong correlation between R/R(λ) and PMEM that is to be expected as PMEM is dependent upon R. For this reason, a cut on R/R(λ) yields a similar result to a cut on PMEM. This method of interloper rejection also does not account for miscentred clusters for which the R values assigned to member galaxies are not representative of the galaxies position in relation to the cluster.


Gallery of all clusters studied with corresponding σG bootstrap distributions. The cluster MEM_MATCH_ID is listed in the top left of each subplot, outlier clusters are denoted with a red coloured ID and an asterisk. For the peculiar velocity (vpec) plots member galaxies are shown in blue, interloping galaxies are shown in red. For the σG distributions the black line shows our reported σG for that cluster and the grey bar covers the σG confidence interval for that cluster.
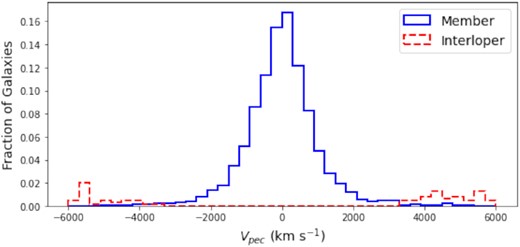
Histogram of the fraction of all clusters stacked together in peculiar velocity bins. The solid blue line represents galaxies included in the velocity dispersion calculations, the dashed red line shows the interloping galaxies. A large fraction of the interloping galaxies have absolute peculiar velocities larger than 6000 km s−1 and thus are not shown.

Histogram of the fractions of galaxies from all clusters stacked together in peculiar velocity bins for all member galaxies (solid blue), galaxies with PMEM > 0.5 (dashed red), and galaxies with PMEM > 0.8 (dotted green). Because of the similarity in the shape of the three histograms with differing PMEM limits we decided not to add a PMEM limit to our member selection process.
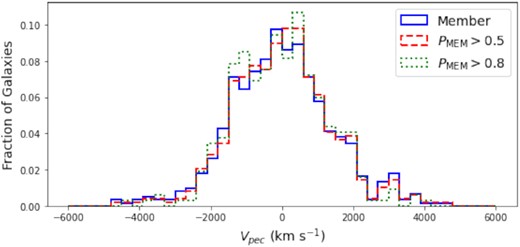
Histogram of the fractions of galaxies from outlier clusters stacked together in peculiar velocity bins for all member galaxies (solid blue, μ = −1 km s−1, σ = 1437 km s−1), galaxies with PMEM > 0.5 (dashed red, μ = 25 km s−1, σ = 1391 km s−1), and galaxies with PMEM > 0.8 (dotted green, μ = −25 km s−1, σ = 1304 km s−1). These distributions are extremely similar, and limiting our sample based on PMEM does not reduce or eliminate the outlier population.
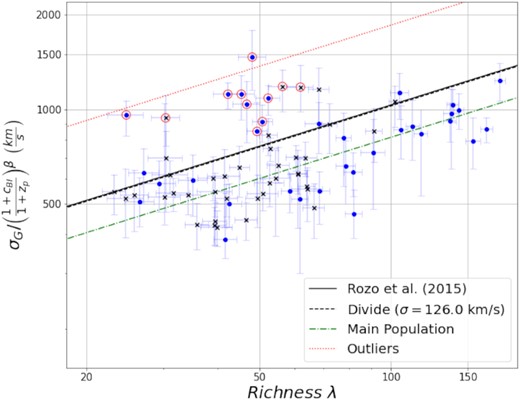
Fig. 3 for members selected using PMEM > 0.8. While this appears to limit the outlier population it, is primarily due to many of the outlier clusters having fewer than 15 members with PMEM > 0.8.
Member galaxy peculiar velocity shown against R/Rλ with PMEM on the colour axis. The dependence of PMEM on R/Rλ is apparent with high PMEM galaxies on average having low R/Rλ.

APPENDIX B: DES Y3 VELOCITY DISPERSION SAMPLE
Table B1 gives the catalogue of redshift and velocity dispersion measurements for the clusters in our sample. Listed are the redMaPPer MEM_MATCH_ID, number of members used for estimating the velocity dispersion, number of putative redMaPPer members cut, redMaPPer redshift, redMaPPer central galaxy redshift if available, the biweight location, the redMaPPer richness, the velocity dispersion estimated with the gapper method, and the velocity dispersion estimated with the biweight scale. Outlier clusters are denoted with superscript a.
Catalogue of cluster measurements. Column (1) lists the redMaPPer MEM_MATCH_ID, columns (2) and (3) list the RA and Dec., respectively, column (4) lists the number of members used for estimating the velocity dispersion, column (5) lists the number of putative redMaPPer members cut, column (6) lists the redMaPPer redshift, column (7) lists the redMaPPer central galaxy redshift if available, column (8) lists the biweight location, column (9) lists the redMaPPer richness, column (10) lists the velocity dispersion estimated with the gapper method, and column (11) lists the velocity dispersion estimated with the biweight scale.
| MEM_MATCH_ID | RA (J2000) | Dec. (J2000) | Nmembers | Ncut | zλ | zcentre | zBI | λ | σG (km s−1) | σBI (km s−1) |
|---|---|---|---|---|---|---|---|---|---|---|
| (1) | (2) | (3) | (4) | (5) | (6) | (7) | (8) | (9) | (10) | (11) |
| 6 | 04 11 11 | −48 19 40 | 22 | 2 | 0.413 | – | 0.423 | 178 ± 5 | |$1351_{-200}^{+185}$| | |$1375_{-158}^{+158}$| |
| 11 | 04 16 09 | −24 04 03 | 81 | 23 | 0.391 | – | 0.399 | 166 ± 5 | |$933_{-71}^{+69}$| | |$967_{-75}^{+70}$| |
| 19 | 00 40 50 | −44 07 53 | 42 | 3 | 0.361 | – | 0.350 | 143 ± 4 | |$1136_{-127}^{+123}$| | |$1147_{-115}^{+124}$| |
| 32 | 02 31 41 | −04 52 57 | 60 | 9 | 0.192 | 0.185 | 0.187 | 102 ± 3 | |$1065_{-147}^{+107}$| | |$1069_{-157}^{+116}$| |
| 37 | 02 43 39 | −48 33 39 | 22 | 0 | 0.496 | – | 0.499 | 139 ± 4 | |$1187_{-140}^{+134}$| | |$1254_{-140}^{+138}$| |
| 51 | 03 04 17 | −44 01 32 | 20 | 3 | 0.454 | – | 0.458 | 138 ± 6 | |$1185_{-325}^{+351}$| | |$1211_{-283}^{+445}$| |
| 52 | 23 06 54 | −65 05 17 | 31 | 2 | 0.521 | 0.528 | 0.530 | 137 ± 5 | |$1061_{-141}^{+144}$| | |$1091_{-153}^{+160}$| |
| 54 | 23 35 08 | −45 44 21 | 21 | 3 | 0.550 | 0.547 | 0.547 | 154 ± 6 | |$971_{-157}^{+163}$| | |$1041_{-283}^{+220}$| |
| 64 | 21 59 59 | −62 45 14 | 16 | 0 | 0.386 | – | 0.392 | 117 ± 4 | |$947_{-306}^{+176}$| | |$821_{-214}^{+240}$| |
| 71 | 02 30 55 | +02 47 20 | 19 | 1 | 0.239 | – | 0.244 | 112 ± 4 | |$928_{-162}^{+179}$| | |$993_{-197}^{+194}$| |
| 81 | 01 23 11 | −48 21 23 | 16 | 3 | 0.639 | – | 0.656 | 137 ± 5 | |$1274_{-407}^{+329}$| | |$1224_{-355}^{+350}$| |
| 86 | 01 52 42 | +01 00 25 | 22 | 3 | 0.232 | 0.230 | 0.231 | 105 ± 4 | |$883_{-168}^{+169}$| | |$932_{-298}^{+215}$| |
| 90 | 02 56 31 | +00 06 03 | 18 | 1 | 0.370 | 0.371 | 0.363 | 105 ± 5 | |$1220_{-210}^{+170}$| | |$1185_{-234}^{+199}$| |
| 151 | 04 17 23 | −47 48 48 | 17 | 0 | 0.590 | – | 0.581 | 112 ± 4 | |$1687_{-850}^{+391}$| | |$1162_{-213}^{+587}$| |
| 184 | 02 48 08 | −02 16 37 | 18 | 1 | 0.237 | 0.234 | 0.237 | 93 ± 4 | |$850_{-139}^{+133}$| | |$893_{-148}^{+157}$| |
| 205 | 01 27 17 | +00 20 41 | 18 | 4 | 0.375 | 0.380 | 0.378 | 107 ± 4 | |$851_{-235}^{+792}$| | |$792_{-238}^{+263}$| |
| 225 | 00 34 28 | +02 25 23 | 17 | 1 | 0.392 | – | 0.386 | 100 ± 5 | |$982_{-197}^{+186}$| | |$1077_{-195}^{+215}$| |
| 303 | 22 22 51 | −48 34 35 | 20 | 2 | 0.666 | – | 0.653 | 91 ± 4 | |$956_{-180}^{+172}$| | |$1039_{-152}^{+133}$| |
| 321 | 01 08 03 | +02 51 60 | 17 | 1 | 0.326 | – | 0.322 | 78 ± 3 | |$817_{-260}^{+162}$| | |$722_{-232}^{+219}$| |
| 340 | 22 33 16 | −53 39 09 | 16 | 0 | 0.430 | – | 0.439 | 93 ± 5 | |$631_{-90}^{+91}$| | |$674_{-91}^{+87}$| |
| 381 | 00 44 28 | +01 50 11 | 17 | 2 | 0.371 | – | 0.357 | 82 ± 4 | |$699_{-91}^{+90}$| | |$765_{-91}^{+90}$| |
| 398 | 04 06 55 | −48 04 57 | 15 | 0 | 0.732 | – | 0.738 | 115 ± 6 | |$976_{-179}^{+152}$| | |$1071_{-144}^{+123}$| |
| 408 | 01 01 39 | +02 36 55 | 19 | 2 | 0.320 | 0.328 | 0.327 | 79 ± 4 | |$738_{-146}^{+124}$| | |$728_{-123}^{+139}$| |
| 414 | 00 08 10 | +02 01 13 | 20 | 3 | 0.367 | 0.365 | 0.366 | 82 ± 4 | |$474_{-78}^{+84}$| | |$532_{-82}^{+96}$| |
| 425 | 02 01 47 | −02 11 54 | 23 | 2 | 0.187 | 0.193 | 0.196 | 72 ± 3 | |$887_{-160}^{+141}$| | |$925_{-179}^{+168}$| |
| 500 | 00 17 38 | +00 52 42 | 21 | 5 | 0.210 | 0.212 | 0.213 | 62 ± 3 | |$656_{-173}^{+283}$| | |$745_{-241}^{+1142}$| |
| 513 | 00 23 01 | +00 09 17 | 38 | 4 | 0.154 | 0.158 | 0.158 | 64 ± 3 | |$561_{-68}^{+62}$| | |$575_{-66}^{+62}$| |
| 516 | 01 53 34 | −01 18 09 | 29 | 1 | 0.244 | 0.244 | 0.243 | 91 ± 6 | |$650_{-128}^{+252}$| | |$640_{-136}^{+213}$| |
| 550 | 01 22 03 | +00 20 04 | 30 | 4 | 0.176 | 0.175 | 0.175 | 61 ± 3 | |$616_{-184}^{+116}$| | |$585_{-142}^{+119}$| |
| 551 | 02 14 40 | −04 33 35 | 63 | 7 | 0.141 | – | 0.140 | 60 ± 3 | |$722_{-59}^{+60}$| | |$737_{-69}^{+63}$| |
| 566 | 01 56 38 | +00 50 47 | 25 | 2 | 0.221 | – | 0.218 | 59 ± 3 | |$559_{-81}^{+76}$| | |$561_{-89}^{+82}$| |
| 584 | 02 06 23 | −01 18 31 | 21 | 3 | 0.193 | 0.198 | 0.196 | 53 ± 2 | |$759_{-69}^{+65}$| | |$795_{-71}^{+66}$| |
| 607 | 02 12 27 | −05 37 35 | 19 | 4 | 0.309 | 0.300 | 0.299 | 69 ± 4 | |$605_{-130}^{+180}$| | |$601_{-110}^{+259}$| |
| 613 | 03 34 07 | −46 59 02 | 18 | 0 | 0.480 | – | 0.486 | 53 ± 3 | |$909_{-267}^{+229}$| | |$1065_{-294}^{+221}$| |
| 640 | 00 34 23 | +00 51 26 | 30 | 1 | 0.188 | 0.192 | 0.190 | 64 ± 4 | |$720_{-95}^{+364}$| | |$750_{-91}^{+119}$| |
| 648 | 02 02 02 | +03 44 51 | 19 | 0 | 0.164 | – | 0.164 | 68 ± 4 | |$1063_{-212}^{+176}$| | |$1031_{-187}^{+196}$| |
| 658 | 05 42 50 | −41 00 00 | 19 | 2 | 0.654 | – | 0.640 | 101 ± 6 | |$1184_{-202}^{+182}$| | |$1167_{-235}^{+204}$| |
| 745 | 02 45 52 | +00 42 16 | 36 | 2 | 0.178 | 0.180 | 0.181 | 61 ± 3 | |$553_{-106}^{+75}$| | |$537_{-104}^{+83}$| |
| 761 | 21 46 06 | −48 46 53 | 19 | 1 | 0.625 | – | 0.623 | 79 ± 5 | |$744_{-138}^{+131}$| | |$777_{-164}^{+145}$| |
| 812 | 02 10 08 | +02 54 27 | 24 | 0 | 0.148 | 0.152 | 0.148 | 52 ± 3 | |$819_{-110}^{+106}$| | |$846_{-103}^{+99}$| |
| 844 | 01 31 26 | −04 44 59 | 16 | 1 | 0.217 | 0.217 | 0.217 | 50 ± 2 | |$726_{-124}^{+113}$| | |$749_{-131}^{+124}$| |
| 992 | 21 35 40 | +00 09 57 | 23 | 8 | 0.118 | – | 0.119 | 55 ± 3 | |$648_{-82}^{+175}$| | |$689_{-84}^{+91}$| |
| 1046 | 01 58 26 | −01 46 39 | 16 | 1 | 0.157 | 0.163 | 0.163 | 64 ± 3 | |$616_{-123}^{+125}$| | |$679_{-154}^{+125}$| |
| 1148 | 01 06 33 | −02 27 02 | 16 | 1 | 0.191 | 0.186 | 0.189 | 30 ± 3 | |$613_{-85}^{+74}$| | |$650_{-83}^{+76}$| |
| 1322 | 03 40 07 | −28 50 38 | 30 | 4 | 0.338 | 0.336 | 0.337 | 68 ± 5 | |$804_{-186}^{+125}$| | |$776_{-170}^{+138}$| |
| 1437 | 04 56 28 | −51 16 35 | 16 | 1 | 0.565 | 0.562 | 0.562 | 80 ± 6 | |$773_{-228}^{+203}$| | |$778_{-421}^{+231}$| |
| 1486 | 21 25 46 | +00 55 52 | 30 | 4 | 0.127 | 0.135 | 0.136 | 54 ± 4 | |$653_{-96}^{+94}$| | |$659_{-110}^{+105}$| |
| 1547 | 02 25 45 | −03 12 33 | 31 | 3 | 0.141 | 0.142 | 0.141 | 53 ± 4 | |$565_{-101}^{+85}$| | |$535_{-132}^{+110}$| |
| 1581a | 02 15 28 | −04 40 41 | 33 | 10 | 0.352 | 0.348 | 0.352 | 51 ± 3 | |$1057_{-124}^{+125}$| | |$1084_{-141}^{+140}$| |
| 1657 | 01 39 16 | −03 38 04 | 23 | 5 | 0.115 | – | 0.115 | 49 ± 3 | |$492_{-86}^{+424}$| | |$527_{-87}^{+84}$| |
| 1688a | 01 31 20 | −13 28 15 | 21 | 3 | 0.214 | – | 0.210 | 27 ± 3 | |$1199_{-424}^{+245}$| | |$1032_{-209}^{+329}$| |
| 1700 | 02 47 03 | +04 23 21 | 23 | 1 | 0.137 | – | 0.140 | 45 ± 2 | |$625_{-114}^{+112}$| | |$656_{-129}^{+105}$| |
| 1769 | 03 36 51 | −28 04 44 | 43 | 11 | 0.120 | 0.105 | 0.105 | 51 ± 4 | |$533_{-48}^{+49}$| | |$541_{-46}^{+45}$| |
| 1792 | 00 20 16 | +00 04 46 | 21 | 0 | 0.201 | 0.212 | 0.211 | 63 ± 4 | |$822_{-114}^{+111}$| | |$851_{-140}^{+141}$| |
| 1838a | 22 14 52 | +01 44 39 | 19 | 3 | 0.691 | 0.683 | 0.689 | 74 ± 4 | |$2446_{-252}^{+278}$| | |$2699_{-280}^{+251}$| |
| 1839a | 01 06 50 | +01 03 56 | 25 | 5 | 0.253 | – | 0.254 | 49 ± 3 | |$1058_{-174}^{+165}$| | |$1067_{-221}^{+221}$| |
| 1971 | 01 02 45 | +01 07 60 | 26 | 1 | 0.149 | – | 0.144 | 42 ± 2 | |$502_{-55}^{+52}$| | |$518_{-52}^{+51}$| |
| 2077 | 03 10 32 | −46 47 02 | 20 | 1 | 0.708 | – | 0.706 | 67 ± 4 | |$614_{-96}^{+93}$| | |$656_{-88}^{+92}$| |
| 2189 | 01 48 28 | −04 07 47 | 27 | 1 | 0.108 | 0.086 | 0.087 | 47 ± 3 | |$464_{-55}^{+50}$| | |$481_{-58}^{+51}$| |
| 2417 | 01 52 06 | +01 32 39 | 15 | 3 | 0.217 | – | 0.215 | 46 ± 3 | |$456_{-236}^{+652}$| | |$346_{-152}^{+202}$| |
| 2432 | 00 32 18 | +01 00 38 | 17 | 1 | 0.381 | 0.390 | 0.387 | 52 ± 3 | |$705_{-287}^{+134}$| | |$493_{-71}^{+272}$| |
| 2462a | 03 34 15 | −28 26 49 | 45 | 15 | 0.651 | 0.657 | 0.660 | 56 ± 4 | |$1608_{-344}^{+179}$| | |$1557_{-291}^{+204}$| |
| 2655 | 00 45 50 | +00 51 01 | 23 | 9 | 0.110 | 0.111 | 0.110 | 41 ± 4 | |$700_{-173}^{+739}$| | |$652_{-130}^{+620}$| |
| 2755 | 01 31 33 | +00 33 22 | 29 | 13 | 0.103 | 0.079 | 0.080 | 39 ± 2 | |$480_{-65}^{+62}$| | |$480_{-57}^{+61}$| |
| 2776 | 02 43 12 | −01 01 12 | 28 | 6 | 0.240 | 0.239 | 0.240 | 43 ± 3 | |$619_{-80}^{+74}$| | |$636_{-84}^{+76}$| |
| 2787 | 21 30 27 | +00 00 24 | 21 | 1 | 0.133 | 0.137 | 0.135 | 39 ± 3 | |$568_{-118}^{+80}$| | |$543_{-81}^{+89}$| |
| 2868a | 03 33 59 | −28 38 11 | 31 | 13 | 0.657 | 0.664 | 0.663 | 62 ± 4 | |$1537_{-319}^{+261}$| | |$1632_{-373}^{+299}$| |
| 2972a | 02 16 36 | −04 27 05 | 46 | 7 | 0.443 | 0.448 | 0.448 | 52 ± 3 | |$1593_{-198}^{+182}$| | |$1649_{-220}^{+196}$| |
| 3030 | 02 15 30 | −05 32 55 | 18 | 8 | 0.287 | 0.290 | 0.290 | 42 ± 3 | |$542_{-162}^{+150}$| | |$624_{-213}^{+185}$| |
| 3274 | 01 56 54 | −04 24 26 | 19 | 5 | 0.136 | 0.134 | 0.135 | 39 ± 3 | |$614_{-80}^{+87}$| | |$674_{-86}^{+86}$| |
| 3567 | 00 44 37 | +00 55 20 | 18 | 2 | 0.202 | 0.201 | 0.197 | 34 ± 2 | |$542_{-57}^{+62}$| | |$577_{-70}^{+61}$| |
| 3610 | 03 29 31 | −28 20 09 | 28 | 8 | 0.678 | 0.001 | 0.680 | 63 ± 6 | |$1435_{-755}^{+298}$| | |$1551_{-890}^{+322}$| |
| 3617 | 02 28 29 | −04 43 43 | 16 | 6 | 0.611 | 0.612 | 0.611 | 40 ± 3 | |$460_{-124}^{+96}$| | |$535_{-99}^{+93}$| |
| 3977 | 03 32 27 | −27 29 39 | 28 | 6 | 0.158 | 0.148 | 0.147 | 36 ± 2 | |$424_{-52}^{+55}$| | |$450_{-55}^{+56}$| |
| 4076 | 02 49 12 | +00 48 49 | 20 | 1 | 0.269 | 0.272 | 0.271 | 38 ± 3 | |$645_{-141}^{+139}$| | |$658_{-139}^{+141}$| |
| 4346 | 00 21 42 | +00 52 32 | 28 | 14 | 0.108 | 0.105 | 0.106 | 40 ± 3 | |$413_{-59}^{+56}$| | |$454_{-56}^{+55}$| |
| 4550a | 02 23 58 | −04 35 05 | 28 | 21 | 0.492 | 0.494 | 0.497 | 45 ± 3 | |$1518_{-226}^{+216}$| | |$1517_{-210}^{+223}$| |
| 4576 | 02 13 56 | −01 31 19 | 22 | 0 | 0.169 | 0.173 | 0.176 | 39 ± 4 | |$547_{-92}^{+80}$| | |$516_{-151}^{+119}$| |
| 4784a | 00 34 42 | −43 50 39 | 36 | 17 | 0.542 | 0.553 | 0.545 | 48 ± 3 | |$1622_{-237}^{+225}$| | |$1700_{-222}^{+241}$| |
| 4992 | 02 45 01 | −03 05 54 | 16 | 5 | 0.161 | 0.162 | 0.162 | 37 ± 3 | |$531_{-111}^{+111}$| | |$555_{-124}^{+118}$| |
| 5072a | 02 17 35 | −05 13 30 | 42 | 33 | 0.643 | 0.648 | 0.643 | 47 ± 3 | |$1538_{-242}^{+202}$| | |$1625_{-223}^{+223}$| |
| 5177 | 02 23 33 | −07 13 40 | 18 | 2 | 0.274 | 0.279 | 0.280 | 36 ± 3 | |$307_{-202}^{+264}$| | |$315_{-206}^{+73}$| |
| 5329a | 02 23 51 | −05 36 40 | 33 | 8 | 0.490 | 0.498 | 0.500 | 42 ± 3 | |$1495_{-175}^{+150}$| | |$1450_{-161}^{+168}$| |
| 5338 | 02 03 02 | −04 59 38 | 21 | 0 | 0.494 | 0.512 | 0.509 | 39 ± 3 | |$587_{-79}^{+71}$| | |$608_{-73}^{+64}$| |
| 5740a | 02 16 12 | −04 14 22 | 36 | 6 | 0.154 | 0.153 | 0.153 | 30 ± 2 | |$850_{-151}^{+260}$| | |$815_{-284}^{+259}$| |
| 5951 | 00 47 31 | +00 52 57 | 16 | 3 | 0.117 | 0.117 | 0.119 | 30 ± 2 | |$871_{-396}^{+208}$| | |$643_{-156}^{+339}$| |
| 6435 | 01 44 54 | −02 17 05 | 16 | 5 | 0.235 | 0.237 | 0.237 | 38 ± 3 | |$500_{-220}^{+136}$| | |$524_{-216}^{+156}$| |
| 6477 | 00 46 24 | +00 00 09 | 30 | 3 | 0.117 | 0.116 | 0.114 | 30 ± 3 | |$533_{-61}^{+67}$| | |$564_{-56}^{+57}$| |
| 6483 | 00 36 45 | −44 10 50 | 40 | 19 | 0.870 | 0.871 | 0.870 | 64 ± 5 | |$915_{-171}^{+824}$| | |$887_{-125}^{+812}$| |
| 6548 | 02 01 17 | −01 24 31 | 23 | 0 | 0.212 | 0.209 | 0.209 | 35 ± 3 | |$640_{-109}^{+102}$| | |$639_{-140}^{+132}$| |
| 6590 | 01 04 59 | −02 42 02 | 20 | 1 | 0.195 | 0.192 | 0.189 | 32 ± 3 | |$558_{-69}^{+64}$| | |$598_{-65}^{+73}$| |
| 6916a | 00 03 49 | +02 02 56 | 22 | 5 | 0.109 | – | 0.096 | 38 ± 3 | |$1206_{-245}^{+201}$| | |$1140_{-242}^{+248}$| |
| 6926 | 02 28 30 | +00 30 36 | 23 | 13 | 0.733 | – | 0.721 | 50 ± 4 | |$526_{-113}^{+128}$| | |$531_{-91}^{+241}$| |
| 7101 | 02 35 12 | −01 30 47 | 21 | 2 | 0.170 | 0.173 | 0.173 | 31 ± 3 | |$624_{-90}^{+74}$| | |$638_{-145}^{+88}$| |
| 7496 | 00 35 40 | +01 37 42 | 20 | 1 | 0.102 | – | 0.080 | 30 ± 3 | |$540_{-125}^{+93}$| | |$522_{-86}^{+98}$| |
| 7716 | 01 59 31 | +00 06 16 | 24 | 1 | 0.155 | 0.156 | 0.156 | 23 ± 1 | |$517_{-69}^{+63}$| | |$517_{-61}^{+59}$| |
| 8183 | 02 25 12 | −06 22 59 | 22 | 7 | 0.209 | 0.204 | 0.204 | 27 ± 2 | |$620_{-103}^{+100}$| | |$668_{-127}^{+102}$| |
| 8505 | 01 32 47 | +01 15 46 | 20 | 5 | 0.123 | 0.126 | 0.125 | 26 ± 2 | |$550_{-132}^{+497}$| | |$525_{-104}^{+173}$| |
| 8619 | 02 02 10 | −03 11 15 | 15 | 2 | 0.153 | 0.154 | 0.153 | 30 ± 2 | |$491_{-96}^{+91}$| | |$542_{-107}^{+89}$| |
| 8971 | 02 01 46 | −01 40 13 | 17 | 0 | 0.205 | 0.209 | 0.208 | 27 ± 2 | |$531_{-75}^{+95}$| | |$578_{-103}^{+119}$| |
| 9071 | 02 25 49 | −05 53 46 | 17 | 6 | 0.243 | 0.233 | 0.232 | 30 ± 2 | |$694_{-185}^{+160}$| | |$784_{-183}^{+137}$| |
| 9447 | 02 11 03 | −04 53 38 | 15 | 7 | 0.137 | 0.138 | 0.138 | 23 ± 2 | |$468_{-114}^{+171}$| | |$473_{-118}^{+245}$| |
| 9760 | 00 32 11 | +00 39 60 | 19 | 3 | 0.206 | 0.215 | 0.215 | 29 ± 3 | |$585_{-89}^{+81}$| | |$593_{-102}^{+89}$| |
| 9907a | 02 15 36 | −04 00 41 | 27 | 9 | 0.373 | 0.383 | 0.376 | 33 ± 3 | |$1193_{-196}^{+167}$| | |$1180_{-144}^{+159}$| |
| 10871 | 01 12 04 | +00 43 52 | 27 | 1 | 0.174 | 0.179 | 0.179 | 30 ± 3 | |$678_{-205}^{+124}$| | |$648_{-199}^{+152}$| |
| 11412 | 02 24 29 | −04 49 14 | 23 | 6 | 0.485 | 0.495 | 0.495 | 30 ± 3 | |$435_{-77}^{+80}$| | |$441_{-118}^{+98}$| |
| 11778 | 02 10 18 | −03 09 55 | 17 | 3 | 0.246 | 0.245 | 0.244 | 31 ± 3 | |$495_{-94}^{+95}$| | |$528_{-152}^{+122}$| |
| 12252a | 02 19 56 | −05 28 03 | 18 | 7 | 0.278 | 0.279 | 0.278 | 22 ± 2 | |$771_{-160}^{+143}$| | |$773_{-179}^{+170}$| |
| 12503 | 03 29 27 | −27 31 26 | 29 | 3 | 0.236 | 0.219 | 0.218 | 30 ± 3 | |$485_{-65}^{+66}$| | |$487_{-74}^{+71}$| |
| 12581 | 00 38 48 | −43 49 13 | 16 | 15 | 0.413 | 0.403 | 0.401 | 29 ± 2 | |$785_{-181}^{+151}$| | |$830_{-231}^{+171}$| |
| 13611 | 01 34 54 | +00 39 53 | 19 | 2 | 0.103 | 0.084 | 0.082 | 22 ± 2 | |$535_{-99}^{+74}$| | |$511_{-74}^{+81}$| |
| 15103 | 02 23 43 | −05 02 01 | 23 | 19 | 0.869 | 0.859 | 0.854 | 60 ± 6 | |$1272_{-307}^{+235}$| | |$1423_{-273}^{+241}$| |
| 16524 | 02 33 53 | +00 04 40 | 16 | 3 | 0.184 | 0.186 | 0.186 | 21 ± 2 | |$302_{-54}^{+51}$| | |$310_{-49}^{+44}$| |
| 17208a | 02 22 05 | −04 33 00 | 20 | 8 | 0.317 | 0.319 | 0.317 | 25 ± 2 | |$1052_{-117}^{+106}$| | |$1111_{-133}^{+143}$| |
| 17296a | 02 30 25 | +00 37 43 | 18 | 8 | 0.824 | – | 0.863 | 44 ± 5 | |$1218_{-278}^{+235}$| | |$1337_{-230}^{+253}$| |
| 17358 | 23 35 28 | +01 02 48 | 26 | 4 | 0.106 | 0.084 | 0.084 | 25 ± 2 | |$518_{-74}^{+71}$| | |$536_{-74}^{+67}$| |
| 20628 | 22 56 28 | +00 32 54 | 18 | 2 | 0.111 | 0.110 | 0.110 | 20 ± 2 | |$351_{-49}^{+48}$| | |$366_{-61}^{+56}$| |
| 21364 | 03 30 06 | −28 01 56 | 15 | 6 | 0.344 | 0.337 | 0.339 | 23 ± 2 | |$474_{-56}^{+43}$| | |$483_{-72}^{+52}$| |
| 21804 | 22 04 43 | +01 13 12 | 15 | 5 | 0.564 | 0.554 | 0.552 | 29 ± 3 | |$1196_{-770}^{+248}$| | |$1483_{-369}^{+182}$| |
| 24258 | 22 35 12 | −01 08 50 | 23 | 2 | 0.109 | 0.090 | 0.090 | 26 ± 3 | |$400_{-123}^{+79}$| | |$387_{-128}^{+96}$| |
| 24911a | 03 27 59 | −29 06 35 | 22 | 5 | 0.622 | – | 0.606 | 30 ± 3 | |$1683_{-215}^{+210}$| | |$1771_{-264}^{+209}$| |
| 29626 | 02 23 11 | −04 12 52 | 18 | 5 | 0.628 | 0.625 | 0.630 | 22 ± 2 | |$928_{-369}^{+281}$| | |$1147_{-387}^{+248}$| |
| 35015a | 02 18 08 | −05 46 02 | 19 | 12 | 0.690 | 0.692 | 0.689 | 25 ± 3 | |$1501_{-337}^{+284}$| | |$1369_{-366}^{+392}$| |
| 35668a | 02 18 24 | −05 25 01 | 25 | 10 | 0.652 | 0.648 | 0.642 | 22 ± 3 | |$954_{-121}^{+119}$| | |$1014_{-123}^{+116}$| |
| 38983a | 03 29 04 | −29 05 50 | 22 | 15 | 0.723 | 0.720 | 0.711 | 24 ± 3 | |$1030_{-164}^{+174}$| | |$1126_{-169}^{+163}$| |
| 41716a | 02 17 54 | −05 27 06 | 16 | 13 | 0.679 | 0.691 | 0.692 | 25 ± 3 | |$939_{-241}^{+209}$| | |$934_{-271}^{+224}$| |
aIndicates outlier clusters.
