


ABSTRACT
Residual foreground contamination by thermal Sunyaev–Zeldovich (tSZ) effect from galaxy clusters in cosmic microwave background (CMB) maps propagates into the reconstructed CMB lensing field, and thus biases the intrinsic cross-correlation between CMB lensing and large-scale structure (LSS). Through stacking analysis, we show that residual tSZ contamination causes an increment of lensing convergence in the central part of the clusters and a decrement of lensing convergence in the cluster outskirts. We quantify the impact of residual tSZ contamination on cross-correlations between the Planck 2018 CMB lensing convergence maps and the Sloan Digital Sky Survey-IV galaxy density data through cross-power spectrum computation. In contrast with the Planck 2018 tSZ-deprojected smica lensing map, our analysis using the tSZ-contaminated smica lensing map measures an |$\sim\!2.5{{\ \rm per\,cent}}$| negative bias at multipoles ℓ ≲ 500 and transits to an |$\sim\!9{{\ \rm per\,cent}}$| positive bias at ℓ ≳ 1500, which validates earlier theoretical predictions of the overall shape of such tSZ-induced spurious cross-correlation. The tSZ-induced lensing convergence field in Planck CMB data is detected with more than 1σ significance at ℓ ≲ 500 and more than 14σ significance at ℓ ≳ 1500, yielding an overall 14.8σ detection. We also show that masking galaxy clusters in CMB data is not sufficient to eliminate the spurious lensing signal, still detecting a non-negligible bias with 5.5σ significance on cross-correlations with galaxy density fields. Our results emphasize how essential it is to deproject the tSZ effect from CMB maps at the component separation stage and adopt tSZ-free CMB lensing maps for cross-correlations with LSS data.
1 INTRODUCTION
When travelling along the line of sight, the cosmic microwave background (CMB) photons are deflected by the gravitational potential gradients induced by the large-scale structure (LSS) of the Universe. This is known as the weak gravitational lensing effect (e.g. Lewis & Challinor 2006), which distorts the CMB temperature and polarization power spectra, generates spurious CMB B-mode polarization, and induces non-Gaussianities through higher point correlation functions of the lensed CMB field. The CMB lensing effect can be modelled through the integrated lensing potential along the line of sight, and is routinely reconstructed from CMB maps by means of quadratic estimators (e.g. Blanchard & Schneider 1987; Cole & Efstathiou 1989; Hu & Okamoto 2002; Carron & Lewis 2017).
The CMB lensing deflection field indirectly traces the underlying dark matter distribution in the sky through the imprint of the LSS gravitational potential gradients on the CMB. As a gravitational effect, the lensing distortions of CMB temperature and polarization anisotropies enable to probe dark matter, neutrino masses, and dark energy in an unbiased way (e.g. Planck Collaboration VIII 2020).
Meanwhile, optical galaxy surveys, such as the Baryon Oscillation Spectroscopic Survey (BOSS)/Sloan Digital Sky Survey (SDSS)-III (Dawson et al. 2013), the Dark Energy Survey (DES Collaboration 2018, 2019), and future LSS surveys by the Vera C. Rubin Observatory (LSST Science Collaboration 2009) and the ESA’s Euclid satellite (Laureijs et al. 2011), directly trace the matter distribution in the Universe, but through a baryonic (or galaxy) bias.
Cross-correlations between CMB lensing maps and optical surveys of galaxy density distribution enable to probe the underlying dark matter while benefiting from mitigated instrumental noise and systematics, which are uncorrelated between two independent data sets. Cross-correlations also offer the advantage of calibrating the galaxy bias of a given tracer (Sherwin et al. 2012; Das, Errard & Spergel 2013; Allison et al. 2015), which relate the overdensities of the distribution of galaxies to those of the underlying dark matter distribution.
For these reasons, many cross-correlation studies between CMB and galaxy surveys are being routinely carried out. Singh, Mandelbaum & Brownstein (2017) cross-correlated the Planck 2015 CMB lensing convergence map with BOSS galaxy catalogues to detect the lensing convergence signal around galaxies out to |$100\ h^{-1}\,{\mathrm{Mpc}}$| and measure the galaxy bias. Singh et al. (2020) then constrained the amplitude of dark matter fluctuations, σ8, and the matter density, Ωm, in a follow-up paper. Giusarma et al. (2018) cross-correlated the Planck 2015 CMB lensing maps with SDSS galaxy density maps to measure the scale-dependence of the galaxy bias and constrain neutrino masses. Omori et al. (2019) cross-correlated the combined CMB lensing map from South Pole Telescope (SPT) and Planck data with the DES galaxy density map to detect the galaxy–CMB lensing cross-correlation signal and constrain cosmological parameters. Marques & Bernui (2020) cross-correlated the combined galaxy clustering catalogue from SDSS, South Galactic Cap u-band Sky Survey, and Wide-field Infrared Survey Explorer data with the Planck 2018 CMB lensing map, in order to estimate the linear growth of density fluctuations. Sun et al. (2022) cross-correlated galaxy groups from the DESI Legacy Imaging Survey with the Planck 2018 CMB lensing to constrain the density bias of galaxy groups over various redshifts, mass, and richness.
However, CMB lensing maps may suffer from a spurious lensing signal inherited from the non-Gaussian foreground contamination of the CMB temperature maps by the LSS, such as the residual thermal Sunyaev–Zeldovich (tSZ) emission caused by the hot electron gas in galaxy clusters that scatter off the CMB photons (Sunyaev & Zeldovich 1972). Since lensing field estimators are designed to pick up non-Gaussian features in CMB temperature anisotropies (e.g. Hu & Okamoto 2002), any residual non-Gaussian tSZ contamination in CMB maps at the location of galaxy clusters will induce a spurious lensing convergence signal on top of the true CMB lensing convergence field, which may bias the cross-power spectrum between CMB lensing maps and external LSS tracers.
van Engelen et al. (2014) explored and quantified the bias on the CMB lensing power spectrum induced by tSZ contamination. Through simulations and analytical models, they predicted a negative bias at large angular scales and a positive bias at small angular scales. Large-scale deficit was also observed several times in the cross-power spectrum between galaxy surveys and tSZ-contaminated Planck CMB lensing maps (e.g. Giannantonio et al. 2016; Pullen et al. 2016). With simulated CMB lensing maps, Madhavacheril & Hill (2018) demonstrated that the tSZ effect contributes to the most significant bias on CMB lensing–galaxy density cross-correlations, and advocated the use of a tSZ-deprojected map of CMB temperature anisotropies (Remazeilles, Delabrouille & Cardoso 2011) for the reconstruction of the CMB lensing field and its cross-correlation with LSS tracers. By cross-correlating DES galaxy density catalogues with a combined CMB lensing map from Planck and SPT data, Baxter et al. (2019) estimated from a simulation that the tSZ contamination in the CMB lensing map can introduce a large bias on their cross-correlation. Schaan & Ferraro (2019) and Sailer, Schaan & Ferraro (2020) highlighted large biases induced by various extragalactic foregrounds on CMB lensing–galaxy density cross-correlations from simulations of future CMB (Simons Observatory) and LSS (LSST) surveys, and advocated for the use of shear-only and bias-hardening lensing estimators to mitigate these biases in CMB lensing reconstruction. The aforementioned studies, which partly rely on semi-analytic models and simulations, all predict a typical scale-dependent transitional bias on CMB lensing–galaxy cross-correlations caused by the residual tSZ-induced lensing convergence field.
The tSZ contamination of temperature-based CMB lensing maps can thus no longer be ignored, especially given the high sensitivity and resolution of future CMB and LSS surveys. It is essential that we quantify the residual tSZ contamination in existing CMB lensing data sets, understand the induced bias on CMB lensing–LSS cross-correlations, and adopt tSZ-free CMB maps for lensing reconstruction and cross-correlations with LSS whenever possible.
In a previous paper (Chen, Remazeilles & Dickinson 2018), we studied the impact of the tSZ foreground contamination of the Planck 2015 CMB temperature maps by cross-correlation with SDSS, and discussed how tSZ residuals can propagate to the reconstructed CMB lensing map. As a follow-up, in this paper we focus on investigating the impact of tSZ contamination in Planck CMB lensing maps through cluster stacking analysis and cross-correlation with SDSS galaxy densities. We use the latest Planck 2018 lensing data set (Planck Collaboration VIII 2020), where both tSZ-contaminated and tSZ-free lensing products are available for comparison. The difference between these two Planck lensing products allows us for the first time to get the spurious lensing convergence field induced by residual tSZ foreground contamination directly from the data, and to study its impact on cross-correlations with LSS data from SDSS.
This paper is organized as follows. Section 2 outlines the theoretical framework for this work. Section 3 describes the data sets used in our analysis. Section 4 shows the results of stacking analysis in map space. Section 5 presents the results from the cross-power spectrum analysis. Section 6 summarizes the results and draws the conclusions.
2 THEORETICAL FRAMEWORK
As evident from equation (3), quadratic estimators rely on the breaking of the statistical isotropy of the primary CMB anisotropies by the lensing distortion, i.e. |$\langle T_{\rm CMB}(\mathbf {l})\, T_{\rm CMB}(\mathbf {L-l})\rangle \ne 0$| for |$\mathbf {L}\ne 0$|. Hence, the estimated lensing fields |$\widehat{\Phi }$| and |$\widehat{\kappa }$| may inherit from residual contamination by non-Gaussian foreground signals which are left in CMB temperature maps after component separation, such as the residual tSZ emission in Planck CMB maps in the direction of galaxy clusters (see e.g. Chen et al. 2018).
While masking galaxy clusters in CMB temperature maps prior to lensing reconstruction might help mitigating such spurious tSZ-induced lensing signal, it can introduce another bias to the lensing field estimate because of the effective spatial correlation between the extragalactic-source mask and the expected peaks of the CMB lensing convergence field (Fabbian et al. 2021).
3 DATA SETS
In this section, we describe the set of CMB lensing products (Section 3.1) and LSS data (Sections 3.2 and 3.3) used in our cross-correlation analysis.
3.1 Planck lensing maps
We use three variations of CMB lensing products from the Planck 2018 data release1 (Planck Collaboration VIII 2020):
The tSZ-contaminated Plancksmica CMB lensing convergence map, κSMICA.
The tSZ-masked Planck CMB lensing convergence map, κCluster-masked, derived from the smica CMB temperature map in which tSZ clusters have been masked out.
A tSZ-free version of the Planck CMB lensing convergence map, κSMICA-noSZ, derived from the so-called smica-nosz CMB temperature map in which the tSZ effect has been deprojected according to equation (12).
We use the temperature-only lensing estimate from each product, since polarization is irrelevant to our analysis.
The Planck 2018 release gives the lensing products as the convergence field κℓm defined by equation (5) with a maximum multipole of ℓmax = 4096. For all three variations, we map the convergence κℓm on the sphere through a healpix pixelization scheme (Górski et al. 2005) with Nside = 2048 (pixel size of ∼1.7 arcmin). The κ map is convolved with a Gaussian beam window of 5 arcmin full width at half-maximum in order to be consistent with the angular resolution of the Planck satellite.
In addition to equation (13), we also consider the difference between the tSZ-masked Planck lensing κCluster-masked map and the tSZ-deprojected Planck lensing κSMICA-noSZ map, in order to assess whether masking tSZ clusters in the CMB map prior to lensing reconstruction still leaves a residual tSZ-induced lensing bias on CMB lensing–galaxy cross-correlations.
For the Planck 2018 lensing products, a combination of masks has been used: the smica-based confidence mask, a |$70{{\ \rm per\,cent}}$| Galactic mask, and Planck point-source masks at 143 and 217 GHz. For the tSZ-masked Planck lensing κCluster-masked map, an additional mask is applied to remove the resolved tSZ clusters detected at signal-to-noise ratio (SNR) >5 in the Planck 2015 SZ catalogue (Planck Collaboration XXVII 2016), leaving a total fraction of observed sky of fsky = 0.67.
3.2 SDSS catalogue
We use the same LSS data set in our analysis as in Chen et al. (2018), produced from the main photometric galaxy (MphG) catalogue given by SDSS-IV survey data release 13 (Albareti et al. 2017). The MphG catalogue provides galaxy magnitudes within five optical filter bands u, g, r, i, and z. We use the r-band magnitude as our reference for sample selection due to its better sensitivity and calibration accuracy. Faint sources with magnitude below the completeness level (r > 22.2) are excluded from our sample since they can introduce uncorrelated background noise during cross-correlation by smearing the true signal. Also discarded are the top |$1{{\ \rm per\,cent}}$| brightest sources with magnitude r < 17, in order to avoid this small amount of bright sources dominating the statistical results. With our selection criteria, a total of ∼133 million galaxies (|$\sim\!64{{\ \rm per\,cent}}$| of the full MphG catalogue) are included in our sample, covering a sky area of 14 555 square degrees.
3.3 Planck tSZ maps
In addition to SDSS galaxy density data, we consider Planck tSZ maps as another independent tracer of the LSS. The Planck tSZ maps trace galaxy clusters which contribute to part of the lensing potential, and thereby Planck tSZ maps must be correlated with Planck CMB lensing maps. Therefore, it is also important to quantify the bias on CMB lensing–tSZ cross-correlations caused by the spurious tSZ foreground-induced lensing field. Since the galaxy clusters of the Planck tSZ maps host some of the galaxies probed by SDSS, the bias on CMB lensing–tSZ cross-correlations is expected to have the same overall shape across multipoles than that of the bias on CMB lensing–galaxy cross-correlations.
We make use of the Plancknilc tSZ Compton-y map (Planck Collaboration XXII 2016) and another tSZ Compton-y map of confirmed clusters simulated from the Planck 2015 SZ catalogue (Planck Collaboration XXVII 2016). The former, which we note y, traces the hot gas of electrons in the entire sky, i.e. in all galaxy clusters and diffuse filaments, but is quite noisy, while the latter, which we note ysim, traces only the compact galaxy clusters of the Planck SZ catalogue detected at |$\rm {SNR}\ \gt\ 4.5$|.
The Plancknilc y-map has an angular resolution of 10 arcmin. Therefore, for cross-correlations involving the Plancknilc y-map we smooth the Planck CMB lensing convergence maps to the same 10 arcmin resolution.
3.4 Simulations
In order to interpret the observed correlation excess and/or deficit between CMB lensing and LSS surveys caused by tSZ residuals in CMB maps and obtain sample uncertainties, we also simulate a set of Monte Carlo (MC) CMB lensing maps.
We first compute a theoretical CMB power spectrum from camb (Challinor & Lewis 2011; Howlett et al. 2012) based on the Planck 2018 Lambda cold dark matter model (Planck Collaboration VI 2020), and generate 1000 Gaussian realizations of pure CMB temperature maps from this theoretical spectrum using the synfast facility in healpix (Górski et al. 2005). In addition, we generate 1000 MC CMB temperature maps with artificial tSZ contamination by adding to the pure CMB maps the tSZ catalogue map described in Section 3.3 which we scale to 143 GHz using the tSZ SED (see Chen et al. 2018).
We then lens both the pure and tSZ-contaminated MC CMB maps with a lensing potential field using the LensIt code2 (Carron & Lewis 2017). The code makes use of camb to compute a lensing potential power spectrum |$C_{\ell }^{\phi \phi }$|, and uses the synalm facility in healpix to generate a set of spherical harmonic coefficients ϕℓm, corresponding to the lensing potential. The ϕℓm is then transformed into a spin-1 deflection field |$d_{\ell m} = \sqrt{\ell (\ell +1)}\phi _{\ell m}$| to lens the unlensed MC CMB temperature maps in our case.
Finally, we reconstruct the lensing convergence field from the lensed MC CMB maps using the Planck 2018 lensing pipeline3 (Planck Collaboration VIII 2020). For each lensed CMB map, the pipeline first computes the lensing gradient estimator, which is then normalized by the expected normalization in the fiducial cosmology to calculate the lensing potential ϕℓm. The lensing convergence field κℓm is calculated from ϕℓm through equation (5) and transformed to a sky map using the alm2map facility in healpix. Finally, the convergence maps are smoothed to 5 arcmin to be consistent with the Planck 2018 lensing maps. In summary, we have two sets of MC simulated lensing convergence maps, generated from 1000 pure CMB and artificially tSZ-contaminated CMB temperature maps, respectively.
4 STACKING ANALYSIS
In this section, we stack the tSZ-induced lensing convergence field κSZ (equations 9 & 13) and the SDSS density contrast map δg (equation 14) at the locations of SZ galaxy clusters according to the Planck 2015 SZ catalogue (Planck Collaboration XXVII 2016). We visually inspect the stacked maps and compute the stacking profiles for a first sight of correlation.
4.1 Map stacking
In order to demonstrate the correlation between the tSZ-induced lensing field and the SDSS galaxies, we stack the residual tSZ lensing convergence map, κSZ, defined in equation (13) at the locations of the galaxy clusters of the Planck 2015 SZ catalogue (Planck Collaboration XXVII 2016). We extract from the κSZ map 3° × 3° patches of the sky with 120 × 120 pixels of 1.5 arcmin pixel size centred around each cluster of the catalogue. We then average all the patches to get the stacked residual tSZ-induced lensing field shown in the upper-left panel of Fig. 1. Clear positive temperature fluctuations are detected at the centre of the SZ cluster locations shown as the central red spot. It is surrounded by negative temperature fluctuations shown as the outer blue rings. The stacked κSZ map demonstrates that residual tSZ emission in the CMB map induces an increment of lensing convergence at small scales in the centre of the clusters, and a decrement of lensing convergence at larger scales in the outskirts of the clusters.
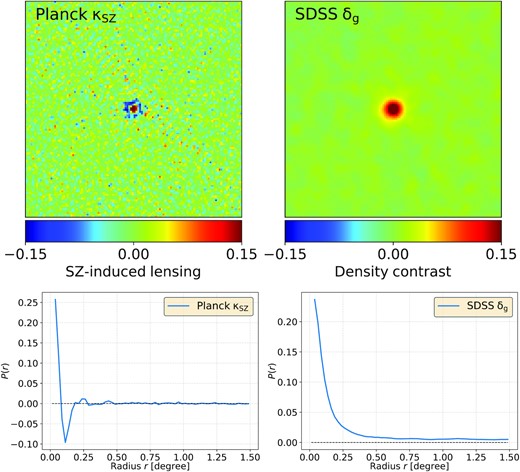
Upper panels: The stacked maps of κSZ (left-hand panel) and δg (right-hand panel) at the centre locations of galaxy clusters from the Planck 2015 SZ catalogue (Planck Collaboration XXVII 2016). Each map is 3° × 3° with an angular resolution of 5 arcmin. Lower panels: The radial profile of the stacked maps as a function of radius from the centre. In each row, left-hand panel: The residual tSZ-induced lensing convergence; right-hand panel: The SDSS galaxy density contrast. Residual tSZ contamination in the CMB temperature map causes an increment of lensing convergence in the central part of the clusters and a decrement of lensing convergence in the outskirts of the clusters.
Similarly, we stack the SDSS density contrast map at the locations of SZ clusters as shown in the upper-right panel of Fig. 1. A positive overdensity is detected (red spot) at cluster locations. By comparing the two upper panels in Fig. 1, our stacking results visually demonstrate that the tSZ-induced lensing convergence field is correlated with LSS. A positive correlation is expected at small scales centred at the clusters, and an anticorrelation is expected at larger scales due to the negative lensing field at the boundary of clusters. This peculiar correlation signature is shown for the first time on maps.
4.2 Radial profile
The calculated radial profiles are shown in the lower panels of Fig. 1 for the tSZ-induced lensing convergence field (left-hand panel) and the SDSS density contrast map (right-hand panel). The radial profile of the stacked κSZ map (lower-left panel) shows an average of positive amplitude within an ∼0.1° distance from the SZ galaxy centres. Further than ∼0.1°, the average amplitude drops to negative and flattens out beyond the cluster scale at r ≳ 0.5°. The profile reflects the positive red spot surrounded by the negative blue ring in the stacked map as seen in the upper-left panel. In comparison, the radial profile of the stacked SDSS map (lower-right panel) is always positive as seen from the red spot in the stacked SDSS map in the upper-right panel.
The radial profiles further highlight the peculiar correlation between tSZ-induced lensing convergence field and LSS data in the direction of galaxy clusters. In particular, the characteristic transition of sign is addressed by comparing the two radial profiles in the lower panels of Fig. 1. This new result obtained from Planck and SDSS maps stacking corroborates previous literature using model simulations and power spectrum analyses (van Engelen et al. 2014; Madhavacheril & Hill 2018), which predicted a scale-dependent transitional shape of the tSZ-induced bias in the CMB lensing–galaxy cross-power spectrum.
5 CROSS-POWER SPECTRUM ANALYSIS
In this section, we compute cross-correlations between LSS data and Planck CMB lensing maps in order to detect the bias caused by the spurious lensing field induced by tSZ residuals in CMB data. The same set of masks as in Chen et al. (2018) is applied to our maps before computing the cross-spectrum: a Galactic mask excluding pixels at Galactic latitude |b| < 30° to mitigate Galactic foreground contamination in Planck CMB lensing maps and an SDSS mask to exclude the unobserved sky region from SDSS. The combined mask is apodized by a 80 arcmin beam to smooth out the sharp transition at the boundary and thereby avoid artefacts arising from spherical harmonic transforms when computing angular power spectra. Afterwards, pixels of the apodized mask with a value below the threshold of 0.5 are set to zero. This mask leaves a total fraction of sky coverage of |$f_{\rm sky} = 27{{\ \rm per\,cent}}$|.
We use the estimator polspice (Szapudi, Prunet & Colombi 2001; Chon et al. 2004; Challinor & Chon 2005) for calculating angular cross-power spectra and correcting for the effects of mask, pixel window function, and beam window function. We compute the cross-power spectra up to a maximum multipole value of ℓmax = 4096 according to the Planck pixel resolution. Due to significant impact from mask and apodization, the first bins of 100 multipoles (ℓ = 2 − 100) are excluded from our analysis. The cross-power spectra are divided into 5 other bins of multipoles: 100 < ℓ < 500, 500 < ℓ < 1500, 1500 < ℓ < 2500, 2500 < ℓ < 3500, and 3500 < ℓ < 4000.
5.1 SZ-induced lensing bias on the κCMB × SDSS cross-power spectrum
The relative bias due to spurious correlations between the Planck residual tSZ-induced lensing field and the SDSS galaxy density field is plotted in Fig. 2 as red-coloured bandpowers. The cross-power spectrum shows the scale-dependent transitional shape of the tSZ-induced bias as anticipated from Fig. 1. Our result derived from Planck and SDSS data is found to be consistent with theoretical projections in Madhavacheril & Hill (2018) and van Engelen et al. (2014) using model simulations, with a negative correlation bias at low multipoles ℓ < 1500 and a positive correlation bias at high multipoles ℓ > 1500.
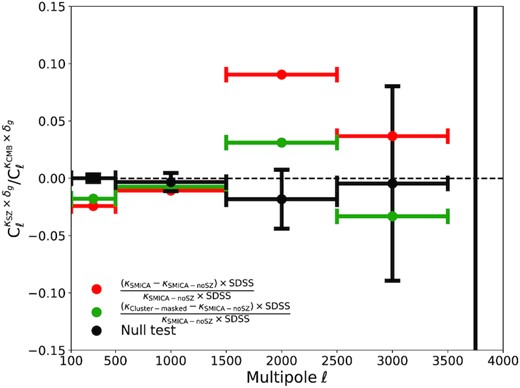
The cross-power spectrum |$C_{\ell }^{\kappa _{\rm SZ}\times \delta _\mathrm{g}}$| relative to |$C_{\ell }^{\kappa _{\rm CMB}\times \delta _\mathrm{g}}$|, replicating Fig. 4 in Madhavacheril & Hill (2018) using the Planck 2018 lensing data set (Planck Collaboration VIII 2020). The κSZ map in the red data set is from the difference between the tSZ-contaminated smica and tSZ-deprojected smica lensing maps. The κSZ map in the green data set is from the difference between the cluster-masked smica and SZ-deprojected smica lensing maps. In both cases, the κSZ map is cross-correlated with the SDSS galaxy density map. The horizontal bars indicate the multipole bin width. The black error bars give the average and 1σ sample variance computed from 1000 MC simulations with randomized SDSS galaxy locations.
Since the CMB lensing signal is cancelled out through the map difference in equation (13), the residual convergence map is dominated by the spurious lensing field κSZ induced by residual tSZ contamination in the tSZ-contaminated Plancksmica lensing map. In comparison, we also show results in which the κSZ map is computed from the difference between the Planck lensing convergence derived from the cluster-masked smica map and the one derived from the tSZ-deprojected smica-nosz map, i.e. |${\widetilde{\kappa }_{\rm SZ} = \kappa _{\rm Cluster-masked} -\kappa _{\rm SMICA-noSZ}}$| (see green-coloured bandpowers in Fig. 2). The spurious tSZ-induced lensing field obtained in this case is thus mitigated by cluster masking. In all cases, the κCMB in equation (17) is from the tSZ-deprojected smica lensing map. The quantity in equation (17) plotted in Fig. 2 thus gives the fractional bias in the CMB lensing–galaxy cross-spectrum induced by tSZ projections in each of the Planck CMB lensing maps. The data in black show the 1σ sample variance obtained by cross-correlating the two variations of smica lensing maps with 1000 MC LSS maps generated by randomizing SDSS galaxy locations.
Detection significance of the correlation bias on the Planck CMB lensing–SDSS galaxy cross-power spectrum due to Planck tSZ-induced lensing contamination over different multipole ranges. The SNR is based on Fig. 2. The SNR in the middle column is computed using the tSZ-contaminated lensing map, while the last column is from the cluster-masked lensing map.
| Multipole range | SNR | |
|---|---|---|
| tSZ-contaminated | Cluster-masked | |
| [100, 500] | 7.4 | 5.4 |
| [500, 1500] | 1.0 | 0.7 |
| [1500, 2500] | 12.0 | 4.1 |
| [2500, 3500] | 0.5 | 3.7 |
| [3500, 4000] | 3.5 | 2.7 |
| [100, 4000] | 14.6 | 7.4 |
| Multipole range | SNR | |
|---|---|---|
| tSZ-contaminated | Cluster-masked | |
| [100, 500] | 7.4 | 5.4 |
| [500, 1500] | 1.0 | 0.7 |
| [1500, 2500] | 12.0 | 4.1 |
| [2500, 3500] | 0.5 | 3.7 |
| [3500, 4000] | 3.5 | 2.7 |
| [100, 4000] | 14.6 | 7.4 |
In contrast with the tSZ-contaminated smica lensing map, the cross-spectrum bias (green in Fig. 2) caused by the use of the cluster-masked smica lensing map is reduced thanks to the masking of clusters where most of the tSZ emission comes from. Nevertheless, the cross-spectrum still gives a negative bias of |$1.8{{\ \rm per\,cent}}$| at large scales of ℓ ≲ 500 and transits to a positive bias of |$3.1{{\ \rm per\,cent}}$| at 1500 ≲ ℓ ≲ 2500. The detection significance of the bias in this case is quantified in the last column of Table 1. Compared with the MC fluctuation, the cross-spectrum still detects a 5.4σ significance at 100 < ℓ < 500 and a 4.1σ significance at 1500 < ℓ < 2500, yielding a total of 7.4σ detection. These results demonstrate that masking galaxy clusters in the CMB map prior to CMB lensing field estimation, a common approach in the literature (e.g. Baxter et al. 2019), is clearly not sufficient to eliminate the tSZ-induced lensing bias on the cross-correlation between CMB lensing and LSS data. Diffuse tSZ emission and undetected clusters seemingly cause a non-negligible lensing bias on CMB lensing–galaxy cross-correlations.
5.2 Cross-correlation between Planck residual SZ-induced lensing and SDSS galaxies
The left-hand panel of Fig. 3 shows the scale-dependent correlation between SDSS galaxies and the spurious tSZ-induced lensing field arising from either the smica tSZ-contaminated CMB lensing map (red) or the cluster-masked CMB lensing map (green). The 1σ sample variance (black) is computed by cross-correlating the κSZ map with 1000 MC maps of randomly located SDSS galaxies. For both the tSZ-contaminated and cluster-masked Planck lensing products, an excess anticorrelation with SDSS galaxies is observed at ℓ ≲ 500 and an excess positive correlation is observed at ℓ ≳ 1500, with the transition of sign happening between ℓ = 500 and ℓ = 1500. The spurious lensing field due to residual tSZ effect from the cluster-masked smica map (green) show relatively less (anti)correlation with SDSS galaxies compared to the tSZ-contaminated smica map (red), as expected. Nevertheless, masking tSZ clusters in CMB maps does not get rid of the spurious tSZ-induced lensing field, as a >1σ (anti)cross-correlation signal is still detected with the same typical multipole-dependent shape. This result again emphasizes the importance of using proper tSZ-deprojected CMB lensing maps in place of cluster masking for cross-correlation analysis with LSS data. The scale-dependent transitional correlation shown in Fig. 3 consolidates our results from map stacking in Fig. 1 and cross-power spectrum bias in Fig. 2.
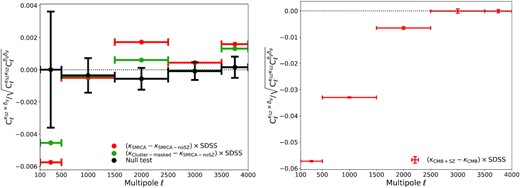
Left-hand panel: Cross-correlation coefficient across multipoles between the SDSS MphG map and the Planck residual tSZ-induced lensing convergence map κSZ. The κSZ map in the red data set is from the difference between the tSZ-contaminated smica and tSZ-deprojected smica lensing maps (κSMICA − κSMICA-noSZ). The green data set is from the difference between the cluster-masked smica and SZ-deprojected smica lensing maps (κCluster-masked − κSMICA-noSZ). The horizontal bars indicate the multipole bin width. The black error bars give the average and 1σ sample variance computed from 1000 MC simulations with randomized SDSS galaxy locations. Right-hand panel: Cross-correlation coefficients of the SDSS MphG map with 1000 MC lensing convergence difference maps (κCMB + SZ − κCMB) derived from pure lensed CMB realizations (κCMB) and artificial 100 per cent tSZ-contaminated lensed CMB realizations (κCMB + SZ). The data points indicate the mean of MC cross-correlation coefficients and the |$1\sigma$| uncertainty from MC sample variance.
Following the same procedure as in Section 5.1, we quantify the significance of the detection of the spurious cross-correlation signal between SDSS galaxies and the residual tSZ-induced lensing field in Fig. 3 using equation (18)–(19). The results for different multipole bins are listed in Table 2. The middle column shows results for the tSZ-contaminated Planck lensing map, corresponding to the red curve in the left panel of Fig. 3. The anticorrelation at large scales (ℓ < 500) is detected with 1.6σ significance, while the excess positive correlation at small scales (1500 < ℓ < 2500) is detected with highest significance at 14.6σ, thus giving an overall 14.8σ detection significance over the full range of multipoles from ℓ = 100 to ℓ = 4000. In comparison, the last column shows results for the cluster-masked Planck CMB lensing map. The SNR of the tSZ-induced cross-correlation in this case, although less significant, is yet giving a 5.5σ detection in total. These results again demonstrate that while masking galaxy clusters for CMB lensing maps helps mitigating the excess correlation with LSS data, it is still insufficient to get rid of such spurious correlations.
Detection significance of the excess correlation between the spurious tSZ lensing field in the Planck CMB lensing map and the SDSS galaxies over different ranges of multipoles. The S/N is based on the left panel of Fig. 3. The middle column shows the results from the tSZ-contaminated lensing map, while the last column shows those from the cluster-masked lensing map.
| Multipole Range | S/N | |
|---|---|---|
| tSZ-contaminated | Cluster-masked | |
| [100, 500] | 1.6 | 1.2 |
| [500, 1500] | 0.4 | 0.3 |
| [1500, 2500] | 14.6 | 5.1 |
| [2500, 3500] | 1.0 | 0.1 |
| [3500, 4000] | 1.9 | 1.6 |
| [100, 4000] | 14.8 | 5.5 |
| Multipole Range | S/N | |
|---|---|---|
| tSZ-contaminated | Cluster-masked | |
| [100, 500] | 1.6 | 1.2 |
| [500, 1500] | 0.4 | 0.3 |
| [1500, 2500] | 14.6 | 5.1 |
| [2500, 3500] | 1.0 | 0.1 |
| [3500, 4000] | 1.9 | 1.6 |
| [100, 4000] | 14.8 | 5.5 |
To further validate the source of the spurious cross-correlation signal from Planck lensing data, we cross-correlate the SDSS galaxy density map with 1000 MC simulations of tSZ-induced lensing convergence maps which we computed from the difference between artificial 100 per cent tSZ-contaminated CMB lensing convergence maps and pure CMB lensing convergence maps, as described in Section 3.4. The resulting cross-correlation coefficient across multipoles is shown in the right-hand panel of Fig. 3. The red data points show the mean and 1σ uncertainty of the MC cross-correlation coefficients. A clear negative excess is detected at angular scales with ℓ ≲ 2500, confirming that the observed anticorrelation using the Planck lensing data at large angular scales in the left-hand panel of Fig. 3 is indeed caused by the spurious lensing field induced by tSZ residuals which cross-correlates with SDSS galaxies. The amplitude of the negative excess from the MC simulation is more significant than that from the Planck lensing data in the left-hand panel. This is because the tSZ contamination in Planck data has already been partly suppressed through component separation, while the MC simulation includes the full tSZ emission. However, the expected transition to positive correlation as shown in the Planck data is not clear in the MC simulation. This is potentially due to the incompleteness of the Planck SZ catalogue used in the MC simulation, which does not include every galaxy clusters nor the diffuse tSZ emission all across the sky.
5.3 Cross-correlation between Planck residual SZ-induced lensing and Planck SZ maps
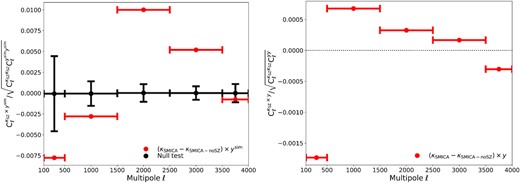
Left-hand panel: Cross-correlation coefficient across multipoles between the Planck SZ catalogue y-map and the Planck residual tSZ-induced lensing convergence map (κSZ = κSMICA − κSMICA-noSZ; red). The black data points give the mean and 1σ sample variance computed from 1000 MC simulations with randomized SZ cluster locations. Right-hand panel: Cross-correlation coefficient across multipoles between the Plancknilc thermal SZ y-map and the Planck residual tSZ-induced lensing convergence map κSZ. Note that the Plancknilc y-map has an angular resolution of 10 arcmin, so the Planck lensing convergence map has been smoothed accordingly.
In the right-hand panel of Fig. 4, we computed the cross-correlation between the tSZ-induced Planck lensing convergence map, κSZ, and the Plancknilc thermal SZ y-map (Planck Collaboration XXII 2016), which traces all the hot gas across the sky both from compact galaxy clusters and diffuse regions between clusters. The tSZ-induced Planck lensing convergence map κSZ was smoothed down to 10 arcmin prior to cross-correlation in order to match the angular resolution of the Planck thermal SZ y-map. The result of such cross-correlation is shown in the right-hand panel of Fig. 4. The amplitude of the correlation is quite smaller compared to that of the left-hand panel of Fig. 4 where the Planck SZ catalogue map was used in place of the Plancknilc thermal SZ y-map. This is due to the 10 arcmin beam smoothing effect in this case, and diffuse foreground and noise contamination in the Planck thermal SZ y-map. Nevertheless, the cross-correlation coefficient between the spurious tSZ-induced lensing map κSZ and the Planck thermal SZ y-map recovers the similar transitional correlation than that between κSZ and the SDSS galaxy density map.
6 CONCLUSIONS
In this paper, we conducted a systematic study on the impact of residual tSZ-induced lensing contamination on the cross-correlation between Planck CMB lensing maps and LSS tracers, such as SDSS galaxy density and Planck tSZ maps. Using the three Planck 2018 CMB lensing products in temperature (tSZ-contaminated, tSZ-masked, and tSZ-deprojected), we estimated the residual tSZ-induced lensing convergence field κSZ from either the difference map κSMICA − κSMICA-noSZ (for the tSZ-contaminated Planck CMB lensing map) or the difference map κCluster-masked − κSMICA-noSZ (for the cluster-masked Planck CMB lensing map).
Through cluster stacking analysis, we highlighted, for the first time on maps, the scale-dependent sign-changing correlation between the spurious tSZ-induced lensing convergence field and the SDSS galaxy density field (Fig. 1). The spurious lensing convergence field induced by residual tSZ contamination in CMB maps shows an increment of convergence in the central part of the clusters and a decrement of convergence in the cluster outskirts.
We also reported a detection of the tSZ-induced lensing bias in the cross-power spectrum between the tSZ-contaminated Planck CMB lensing map and the SDSS galaxy density map, causing a |$\sim\!2.5{{\ \rm per\,cent}}$| deficit of power at low multipoles and a |$\sim\!9{{\ \rm per\,cent}}$| excess of power at high multipoles (Fig. 2 and Table 1). We also showed that the tSZ-induced lensing bias on the CMB lensing–galaxy cross-power spectrum persists to a lower extent even after having masked out confirmed galaxy clusters in the Planck CMB temperature map prior to lensing reconstruction (Fig. 2 and Table 1).
Cross-correlations between Planck spurious tSZ-induced lensing convergence κSZ and SDSS galaxies show a transitional behaviour across the multipoles, with significant anticorrelation at large angular scales below ℓ ∼ 500, crossing zero at 500 ≲ ℓ ≲ 1500, and positive correlation at small angular scales above ℓ ∼ 1500 (Fig. 3). The spurious excess cross-correlation signal due to residual tSZ-induced lensing is detected at 14.8σ significance when integrating over the whole range of multipoles, and still persists to 5.5σ significance after cluster masking (Table 2).
As further evidence, we also cross-correlated the Planck residual tSZ-induced lensing map κSZ with tSZ galaxy clusters from both a catalogue map based on the Planck SZ catalogue and the Plancknilc y-map. The same transitional correlation signal is detected as in the case using the SDSS galaxies (Fig. 4).
Our results on Planck and SDSS data are consistent with theoretical projections from van Engelen et al. (2014) and numerical simulations from Madhavacheril & Hill (2018), but also with recent cross-correlation studies using different CMB and LSS data sets (e.g. Baxter et al. 2019).
Given that masking known galaxy clusters in the CMB temperature map prior to CMB lensing reconstruction still leaves a non-negligible tSZ-induced lensing bias on CMB lensing–LSS cross-correlations, we advocate for the use of CMB lensing maps derived from CMB temperature maps in which the tSZ effect has been fully deprojected for reliable cross-correlation studies. Spectral deprojection of tSZ effect through multifrequency component separation (e.g. Remazeilles et al. 2011) has the merit of eliminating any spurious extragalactic contribution to the CMB lensing field that arises from galaxy clusters, including unknown clusters and diffuse tSZ emission.
The tSZ-induced scale-dependent lensing bias can impact the constraints on cosmological parameters involving cross-correlations between CMB lensing and LSS, such as the amplitude σ8 of the matter power spectrum (e.g. Baxter et al. 2019; Omori et al. 2019; Singh et al. 2020) and the linear growth of structure, D(z), as a function of redshift (e.g. Giannantonio et al. 2016; Marques & Bernui 2020). In particular, Baxter et al. (2019) showed on simulations that the tSZ contamination of CMB lensing, if not properly taken into account in the cross-correlation analysis, could significantly bias the constraints in the Ωm − σ8 plane derived from the cross-correlation between SPT lensing data and DES galaxies. In addition, the multipole-dependent bias induced by tSZ on the CMB lensing–galaxy cross-power spectrum can lead to inaccurate measurements of the scale-dependent galaxy bias at different redshifts (e.g. Giusarma et al. 2018).
With upcoming CMB experiments (CMB-S4 Collaboration 2016; The Simons Observatory Collaboration 2019) and galaxy surveys (LSST Science Collaboration 2009; Laureijs et al. 2011) of finer resolution and larger sensitivity, we stress that future constraints on cosmological parameters will be even more sensitive to such cross-correlation biases induced by residual tSZ contamination in CMB lensing maps. As forecasted by Sailer et al. (2020), who computed the cross-correlation signal between the expected CMB lensing map from the Simons Observatory and expected LSS data from LSST, the tSZ-induced correlation excess will be larger than the statistical uncertainty in the CMB lensing–galaxy cross-power spectrum. Therefore, one must take extra care about the tSZ cluster residuals for future CMB lensing data, and constrained foreground cleaning algorithms (Remazeilles et al. 2011; Abylkairov et al. 2021) should be implemented wherever possible to eliminate extragalactic foreground contamination from CMB lensing observables.
ACKNOWLEDGEMENTS
We are grateful to Julien Carron for his crucial guidance on using the LensIt code and the Planck 2018 lensing pipeline. We thank Antón Baleato Lizancos and Anthony Challinor for their generous advice on the CMB lensing simulation and their help on the Quicklens code, which was initially used for our simulation. We also thank Clive Dickinson for his useful comments at the early stages of this work, and Simone Ferraro for constructive remarks on the latest version of the paper. We also thank the anonymous referee for their positive comments and suggestions. MR acknowledges support by the ERC Consolidator Grant CMBSPEC (No. 725456) as part of the European Union’s Horizon 2020 research and innovation program.
DATA AVAILABILITY
The Planck CMB lensing and SZ data underlying this article are available in the Planck Legacy Archive (https://pla.esac.esa.int). The SDSS galaxy data underlying this article are available in the SDSS III DR 13 data base (https://skyserver.sdss.org/dr13/en/home.aspx).
