


ABSTRACT
We present the results obtained from broad-band X-ray timing and spectral analysis of black hole (BH) candidate MAXI J1803–298 using an AstroSat observation on 2021 May 11–12. Four periodic absorption dips with a periodicity of 7.02 ± 0.18 h are detected in the light curve. AstroSat observe the source when it was undergoing a transition from hard-intermediate state to soft-intermediate state. Our timing analysis reveals the presence of a sharp Type-C quasi-periodic oscillation (QPO) in the power-density spectra (PDS) with an evolving QPO frequency ranging from 5.31 ± 0.02 to 7.61 ± 0.09 Hz. We investigate the energy dependence of the QPO and do not find this feature in the PDS above 30 keV. The combined 0.7–80 keV SXT and LAXPC spectra are fitted with a model consisting of thermal multi-colour blackbody emission and Comptonized emission components. We perform time-resolved spectroscopy by extracting spectra during the dip and non-dip phases of the observation. A neutral absorber is detected during the dip and non-dip phases though a signature of an ionized absorber is also present in the dip phases. The spectral and temporal parameters are found to evolve during our observation. We estimate the mass function of the system as f(M) = 2.1–7.2 M⊙ and the mass of the BH candidate in the range of MBH ∼ 3.5–12.5 M⊙.
1 INTRODUCTION
An X-ray binary (XRB) system consists of a compact object which is either a black hole (BH) or a neutron star and a normal companion star. Depending on the mass of the companion star, an XRB can be classified as low mass X-ray binary (LMXB) or high mass X-ray binary (HMXB). Generally, an LMXB contains an A or later type star, while an HMXB contains a giant O or B type star (White, Nagase & Parmar 1995; Tetarenko et al. 2016). An XRB can also be termed as a transient or persistent source, depending on its X-ray activity. A transient source spends most of the time in quiescence phase with X-ray luminosity, LX < 1032 erg s−1and show occasional outbursts when the X-ray intensity rises by about three orders of magnitude or more compared to the quiescence phase (Remillard & McClintock 2006). Instead, a persistent source is always active in X-rays with X-ray luminosity, LX > 1035 erg s−1 (Remillard & McClintock 2006).
A black hole X-ray binary (BHXB) shows rapid variability in spectral and temporal properties (van der Klis 1994; Méndez & van der Klis 1997). The spectrum of a BHXB can be approximated by a multi-colour blackbody and a power-law tail. The multi-colour blackbody component is understood to be originated in a standard geometrically thin and optically thick disc (Shakura & Sunyaev 1973) while the power-law tail is believed to originate in a hot electron cloud known as Compton cloud or corona (Haardt & Maraschi 1993; Titarchuk 1994; Chakrabarti & Titarchuk 1995; Done, Gierliński & Kubota 2007). The soft thermal photons originated in the disc undergo inverse-Compton scattering in the Compton cloud and produce hard Comptonized power-law tail (Sunyaev & Titarchuk 1980, 1985).
In BHXBs, the fast-variability in X-ray emission is generally seen in the power-density spectra (PDS) of the source. The PDS are characterized with the so-called band-limited noise with a flat profile in the ν − pν spectrum with a break frequency (van der Klis 1994). The noise profile of PDS can be described by one or multiple Lorentzian functions (Nowak 2000; Belloni, Psaltis & van der Klis 2002). A BHXB also exhibits peaked noise or quasi-periodic oscillation (QPO) in the PDS. The low frequency QPO is generally observed in the range of 0.1–30 Hz. Depending on the Q-factor (Q=ν/Δν, ν and Δν are centroid frequency and full width at half-maximum; FWHM), the rms amplitude of the QPO and BN, a low frequency QPO (LFQPO) can be classified as Type-A, Type-B, or Type-C (Casella, Belloni & Stella 2005, and references therein).
A correlation between the spectral and timing properties of a BHXB is observed in the hardness-intensity diagram (HID; Homan et al. 2001; Homan & Belloni 2005), accretion rate ratio-intensity diagram (ARRID; Mondal, Debnath & Chakrabarti 2014; Jana et al. 2016), rms-intensity diagram (RID; Muñoz-Darias, Motta & Belloni 2011), or hardness ratio-rms diagram (HRD; Belloni et al. 2005). An outbursting BHXB also shows different spectral states during the outburst, which is evident from the different branches of the HID, ARRID, RID, or HRD. Generally, an outbursting BHXB evolves through low-hard state (LHS), hard-intermediate state (HIMS), soft-intermediate state (SIMS), and high soft state (HSS) during the outburst (Belloni et al. 2005; Remillard & McClintock 2006; Nandi et al. 2012). A detail study on the spectral state evolution has been made by several group for different outbursting BHXBs (Remillard & McClintock 2006; Tetarenko et al. 2016; Alabarta et al. 2020; Chatterjee et al. 2020).
Recently, the MAXI/GSC discovered the new X-ray transient MAXI J1803–298 when the source showed an X-ray outburst on 2021 May 1 (Serino et al. 2021). The source was subsequently observed with several other X-ray missions, e.g. Swift (Gropp et al. 2021), NICER (Bult et al. 2021; Gendreau et al. 2021), AstroSat (Jana et al. 2021b), NuSTAR (Xu & Harrison 2021), INTEGRAL (Chenevez et al. 2021), and Insight-HXMT (Wang et al. 2021). Following the discovery, optical (Buckley et al. 2021; Hosokawa et al. 2021) and radio (Espinasse et al. 2021) observations of the source were also carried out during the X-ray outburst. NICER, NuSTAR, and AstroSat observations revealed the presence of periodic absorption dips with a periodicity of ∼7 h in the light curves of MAXI J1803–298 (Homan et al. 2021; Xu & Harrison 2021; Jana et al. 2021b). QPOs were also detected in the PDS of MAXI J1803–298 (Chand et al. 2021; Ubach et al. 2021; Wang et al. 2021). During MAXI/GSC observations, state transition of the source from the LHS to HSS was observed (Shidatsu et al. 2021). The Swift/XRT observations showed the evidence of disc wind in the source (Miller & Reynolds 2021). A preliminary spectral analysis suggested that the source is a BHXB (Jana et al. 2021b; Shidatsu et al. 2021; Xu & Harrison 2021).
In this paper, we present the results obtained from the AstroSat target of opportunity (TOO) observation of MAXI J1803–298 during the recent X-ray outburst. Here, we study the spectral and timing properties of the source in detail to understand the accretion dynamics. Along with the AstroSat observation, we also used NuSTAR observation for the study of periodicity and dips in the source light curve. The paper is organised in the following way. In Section 2, we present the observation, data reduction and data analysis process. In Section 3, we present the results from a detailed spectral and timing studies of the source. We discuss our findings in Section 4 and summarized the work in Section 5.
2 OBSERVATIONS AND DATA ANALYSIS
Following the discovery, MAXI J1803–298 was observed with AstroSat on two epochs i.e. on 2021 May 11–12 and 2021 July 24–26 for exposures of ∼50 ks each. NuSTAR observed the source on 2021 May 5 for an exposure of ∼27 ks. The log of the observation is presented in Table 1.
Observation log.
| Observation ID | Start date | End date | Exposure (ks) |
|---|---|---|---|
| Start time | End time | LAXPC/SXT | |
| T04|$\_$|006T01|$\_$|9000004370 | 2021-05-11 | 2021-05-12 | 50/27.8 |
| 12:05:30 | 13:03:01 | ||
| T04|$\_$|028T01|$\_$|9000004584 | 2021-07-24 | 2021-07-26 | 50/27.8 |
| 15:48:09 | 00:59:02 | ||
| 90702316002* | 2021-05-05 | 2021-05-06 | 27* |
| 16:46:09 | 10:26:09 |
Note. *NuSTAR observation.
2.1 AstroSat
AstroSat is the first Indian multi-wavelength astronomical satellite launched by Indian Space Research Organization on 2015 September 28 (Agrawal 2006). It provides a broad-band coverage from optical to hard X-ray bands for exploring the nature of the cosmic sources. There are five sets of instruments such as Soft X-ray Telescope (SXT; Singh et al. 2017), Large Area X-ray Proportional Counters (Agrawal et al. 2017; Antia et al. 2017), Cadmium Zinc Telluride Imager (CZTI; Rao et al. 2017), a Scanning Sky Monitor (Ramadevi et al. 2018), and Ultraviolet Imaging Telescope (Tandon et al. 2017), onboard the satellite. In the present work, we did not use data from the CZTI as the source was relatively faint for the detector.
The SXT is a soft X-ray focusing telescope consisting of a CCD detector. It is sensitive in 0.3–8 keV energy range. The effective area and energy resolution of the instrument are 128 cm−2 and 5–6 per cent at 1.5 keV and 22 cm−2 and 2.5 per cent at 6 keV, respectively. MAXI J1803–298 was observed with SXT in the photon counting (PC) mode at a time resolution of 2.4 s. The level-1 data were processed using standard SXT pipeline software AS1SXTLevel2-1.4b1 to obtain cleaned event files from each orbit of observation. Thereafter, each orbit data are merged into a single cleaned event file using the sxtevtmergertool2 task. For time-resolved spectroscopy, we divided the event files into 10 segments using the XSELECT package. As the source was bright in soft X-rays (count rate of >40 count/sec), the SXT data are affected by photon pile-up.3 We chose an annular region with a fixed outer radius of 10 arcmin and a variable inner radius. The pile-up was checked from the spectral distortion.4 We found that the pile-up was removed when the inner radius of 8 arcmin is considered in our analysis. We used background spectra and response matrix files that were supplied by the SXT instrument team.5 The auxiliary response file (ARF) is generated by the sxtARFModule tools.
AstroSat has three LAXPC units that are sensitive to the X-ray photons in 3–80 keV energy range, with a total effective area of 8000 cm−2 at 15 keV. The timing and spectral resolutions of the LAXPC are 10μS and 12 per cent at 22 keV, respectively. We used only event mode data from LAXPC20 unit in our analysis. We did not use data from LAXPC10 and LAXPC30 due to high background and gain issues with the instruments (Antia et al. 2017, 2021). We used standard data analysis tools LAXPCsoftware6 (laxpcsoft; version 2020 August 4) to extract light curves and spectra. The background estimation was done based on the blank sky observations, closest to the time of observation of the source of interest, as described in Antia et al. (2017). In order to construct the response matrix, three on-board radioactive sources, covering different energies in the range of LAXPC detectors, were used (see Antia et al. 2017, for details). The spectral responses were generated carefully by appropriately modeling and accounting for known 30 keV fluorescence photons produced due to Xe-K shell interaction of incident X-rays. We applied barycentric correction on the background subtracted light curves using as1bary tool. The LAXPC light curve is also divided into 10 segments for studying the source properties during dip and non-dip phases. The energy resolved light curves were generated using the tools provided by LAXPCsoftware. The second AstroSat observation was carried out when the source was in quiescent phase. Therefore, the LAXPC data are background dominated above ∼10 keV. Though we generated light curves and spectra from this observation, it was difficult to perform a detailed timing and spectral analysis of the data due to low source flux.
2.2 NuSTAR
NuSTAR is a hard X-ray focusing telescope, consisting of two identical modules: FPMA and FPMB (Harrison et al. 2013). NuSTAR observed MAXI J1803–298 on 2021 May 5 for a exposure of ∼27 ks (see Table 1). We reprocessed the raw data with the NuSTAR Data Analysis Software (NuSTARDAS, version 1.4.1). Cleaned event files were generated and calibrated by using the standard filtering criteria in the nupipeline task and the latest calibration data files available in the NuSTAR calibration data base (CALDB).7 The source and background products were extracted by considering circular regions with radii 60 and 90 arcsec, respectively. The light curves were extracted using the nuproduct task. For the present work, we only used NuSTAR light curve to study the periodicty and dips.
3 ANALYSIS AND RESULTS
3.1 Outburst profile
MAXI J1803–298 was observed extensively with several X-ray missions following its discovery on 2021 May 1. The source was in the outbursting phase for about 3 months. The outburst profile of the source is shown in Fig. 1. Top and middle panels of Fig. 1 show the 2–10 keV MAXI/GSC and 15–50 keV Swift/BAT light curves, respectively. The bottom panel of Fig. 1 shows the variation of the hardness ratio (HR1) of the source during the outburst. The HR1 is defined as the ratio between the count rates in 4–10 and 2–4 keV ranges of MAXI/GSC. Symbols with different colours represent different spectral states of the source.
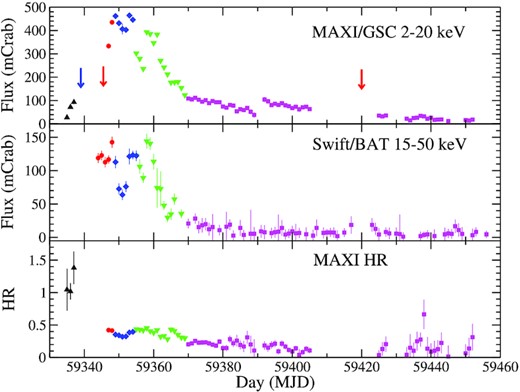
Top: The 2–20 keV MAXI/GSC light curve of MAXI J1803–298 covering the recent X-ray outburst. Middle: The 15–50 keV Swift/BAT light curve for the duration shown in the top panel. Bottom: The hardness ratio (HR1 = ratio between the count rates in 4–10 keV and 2–4 keV ranges). The black triangles, red circles, blue diamonds, green down-triangles, and purple squares represent the data points from the LHS (rising), IMS (ris.), HSS, IMS (decl.), and LHS (decl.), respectively. The red and blue arrows mark the AstroSat and NuSTAR observations of the source, respectively.
In the beginning of the outburst, the source intensity increased rapidly. The intensity in 2–10 keV range reached its peak on 2021 May 15 (MJD 59349) and then decreased until 2021 May 18 (MJD 59352). The 15–50 keV BAT flux reached its peak (∼142 mCrab) on 2021 May 14 (MJD 59348) and then decreased to a local minimum value of ∼63 mCrab on 2021 May 17 (MJD 59351). However, the 2–20 keV X-ray light curve showed another peak on 2021 May 19 (MJD 59353). After that, the 2–20 keV flux decreased to a minimum on 2021 May 23 (MJD 59357), followed by a temporary increase next day. The source intensity then monotonically decreased until 2021 June 3 (MJD 59368). The 15–50 keV BAT flux also showed similar variation. Beyond 2021 June 4 (MJD 59369), both 2–20 keV GSC flux and 15–50 keV BAT flux decreased slowly. A minor flare like event was observed around 2021 June 27 (MJD 59392). After that, the X-ray intensity decreased gradually and the source moved to the quiescent state.
Based on the variation of X-ray intensity and HR1 during the outburst, it appears that the source transited through three canonical spectral states. The source evolved through the LHS (rising) → HIMS (ris.) → IMS (ris.) → HSS → IMS (decl.) → LHS (decl.). In the beginning of the outburst, the source was in the LHS (ris.). It moved into the HSS through the IMS (ris.) and then entered the HSS on 2021 May 15 (MJD 59349) when the 2–20 keV flux was maximum. The source, then, moved into the IMS (decl.) in the decay phase when the X-ray intensity rapidly decreased until 2021 June 3 (MJD 59368). After this, the source was in the LHS (decl.) before moving to the quiescent state.
3.2 Absorption dips and periodicity
AstroSat observed MAXI J1803–298 on 2021 May 11–12 and 2021 July 24–26 for a net exposure of 100 ks. The red arrows in the top panel of Fig. 1 mark the AstroSat observations. The first observation was carried out when the source was in the rising phase of its outburst, while the second observation was made when the source was in the quiescent state. The background subtracted 3–80 keV light curve of the source from the first observation is shown in the top panel of Fig. 2. The variation of HR2 (6–30 keV/3–6 keV count rates) is shown in the bottom panel of Fig. 2. Four absorption dips, marked as D1, D2, D3, & D4, are clearly visible in the LAXPC light curve. The dip regions are marked with red circles while the blue circles mark the non-dip regions. Beside the four dips, we divided the non-dips regions into six segments (marked as N1, N2, N3, N4, N5, & N6). The last two segments (N5 & N6) were treated separately as N5 & N6 showed different trend of X-ray intensity. The X-ray intensity increased during the N5, while it was constant during N6. Higher values of hardness ratio (HR2) are seen during the dip regions (see bottom panel of Fig. 2). This indicates that the soft X-ray photons in 3–6 keV range were primarily affected at the dip phases in comparison to the hard X-ray photons in 6–30 keV range. Fig. 3 shows the 3–78 keV light curve obtained from the NuSTAR observation. The dips are also visible in the NuSTAR light curve.
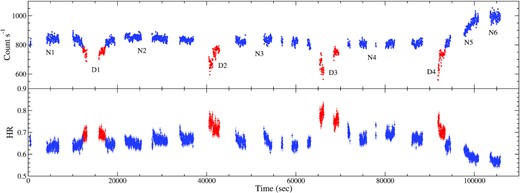
Top: The 3–80 keV LAXPC light curve of the source from the AstroSat observation on 2021 May 11. Bottom: The variation of hardness ratio (HR2 = 6–30 keV counts/3–6 keV count rates). The blue and red points indicate the data from the non-dip and dip phases, respectively.
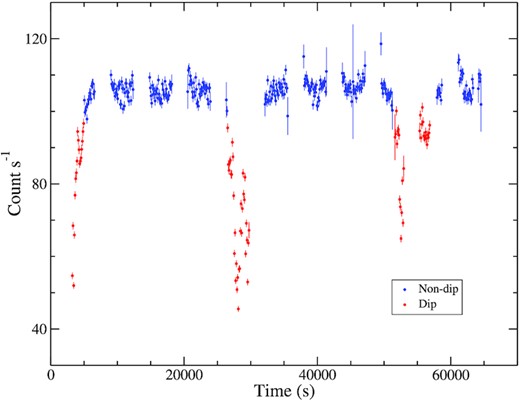
The 3–78 keV light curve of MAXI J1803–298 from the NuSTAR observation on 2021 May 5. The blue and red points indicate data from the non-dip and dip phases, respectively.
The dips in the light curve (top panel of Figs 2 and 3) appear to be periodic. To determine the periodicity, we applied LS periodogram method to calculate the periodicity in the light curves at different energy bands, e.g. 3–80, 3–6, 6–30, 30–80, 3–78 keV (for NuSTAR) ranges (Lomb 1976; Scargle 1982; VanderPlas 2018) using the scargle routine of the Starlink software.8 We searched all the light curves for periodic signals between 40 and 100 000 s. Fig. 4 shows the LS periodograms of light curves in different energy bands. The black, red, and green solid lines represent the periodograms of 3–6, 6–30, and 3–80 keV LAXPC light curves, respectively. The grey dashed line represents the periodogram obtained from the 30–80 keV range light curve. The blue line represents the periodogram of NuSTAR observation in 3–78 keV energy range.
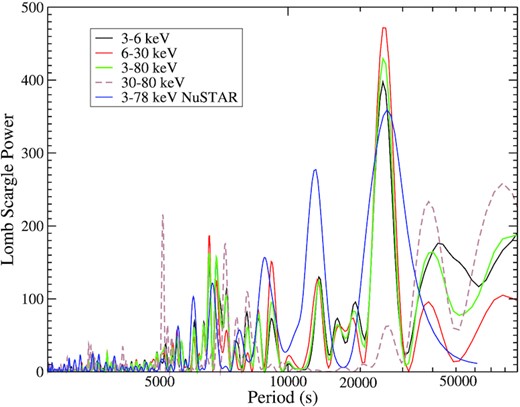
LS periodogram analysis. The black, red, green, and grey lines represent the LS periodograms obtained from the light curves in 3–6, 6–30, 3–80, and 30–80 keV ranges, respectively. The blue solid line represents the 3–78 keV NuSTAR light curve. A clear periodicity at ∼25 200 s is detected in all light curves except for the 30–80 keV LAXPC light curve.
We obtained the periodicity as 25187 ± 711 s (7.00 ± 0.20 h), 25499 ± 1333 s (7.08 ± 0.37 h), and 25267 ± 635 s (7.02 ± 0.18 h) in 3–6, 6–30, and 3–80 keV LAXPC light curves, respectively. The 3–78 keV NuSTAR light curve shows the presence of a periodicity of 25830 ± 3626 s (7.18 ± 0.92 h). Different energy band indicates a different periodicity. However, all the periodicities are consistent within the uncertainties. The discrepancy aroused due to the data gap in the light curve. The data gap due to the orbital motion of the satellite also did not allow us to estimate the exact duration of the dips. From visual inspection, the duration of the dips is ∼5000 s. We did not obtain any clear periodicity from the 30–80 keV LAXPC light curve, indicating the photons above 30 keV were not affected during the dip phases. The detailed result of periodogram analysis is given in Table 2. We also calculated the false alarm probability (FAP) of the main peak in the LS periodogram considering 1000 trials (VanderPlas 2018) using astropy package9.The FAP value is estimated to be 0.00–0.01 with 95 per cent confidence. The observed periodicity at 25187, 25499, 25267, and 25830 s and were detected with a significance level of 95 per cent in the light curves in 3–6, 6–30, 3–80, and 3–78 keV (NuSTAR observation) ranges, respectively.
Result of LS periodogram analysis.
| Instrument | Energy band | Periodicity | LS power |
|---|---|---|---|
| (keV) | (s) | ||
| AstroSat/LAXPC | 3–6 | 25187 ± 711 | 397 |
| AstroSat/LAXPC | 6–30 | 25499 ± 1333 | 472 |
| AstroSat/LAXPC | 30–80 | – | – |
| AstroSat/LAXPC | 3–80 | 25267 ± 635 | 429 |
| NuSTAR | 3–78 | 25830 ± 3626 | 359 |
Note. Errors are quoted at 1σ.
The second AstroSat observation was carried out when the source was in the LHS/quiescent state with 2–20 keV flux ≲ 30 mCrab, about one order lower than the first AstroSat observation. The LAXPC data during this observation were background dominated above ∼10 keV. As the source was at a low flux level and LAXPC data were background dominated, we did not detect any dip in the light curve even in soft X-rays.
3.3 Power-density spectra
We divided the entire LAXPC light curve from first AstroSat observation into ten segments. For each segment, we generated light curves at a binning time of 0.01 s in 3–80, 3–6, 6–12, 12–20, 20–30, 30–50, and 50–80 keV ranges. The PDS are generated by applying the Fast Fourier Transformation technique on the background subtracted LAXPC light curves using powspec task of FTOOLS for each segment. The light curves are divided into 8192 intervals and the Poisson noise subtracted PDS are generated for each interval. The final PDS are generated by averaging all the PDS from each interval. We re-binned the PDS in a geometrical series by using the normalization factor of 1.05. The final PDS are normalized to give the rms spectra in the unit of (rms/mean)2Hz−1 (Belloni & Hasinger 1990; Miyamoto et al. 1991; van der Klis 1997). The 0.01 s light curves allowed us to search for QPO in the PDS up to the Nyquist frequency of 50 Hz.
We fitted all the PDS with a single or multiple Lorentzian functions, depending on the nature of the broad-band noise (BN) and QPO. We calculated the fractional rms amplitude for BN and QPO for each PDS by integrating the power in the range of 0.01–50 Hz (van der Klis 2004). We repeated this exercise for the light curves in different energy ranges for each segment. Using these rms values for different energy bands, we constructed rms spectra for each segment and showed in Fig. 5 for all segments. The rms was found to be maximum (peak) in 6–12 keV energy bands and then decreased with increasing energy. The detailed results of the PDS analysis is tabulated in Table 3.
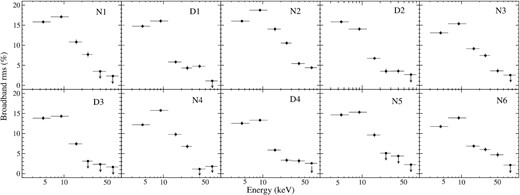
Broad-band RMS Spectra of MAXI J1803–298 during non-dip and dip regions of the light curve. The data points with down arrows indicate detection of upper limit.
Results obtained from the timing analysis of first AstroSat observation of MAXI J1803–298.
| Phase | Count Rate | QPOf | Q-factorf | rmsf | QPOh | Q-factorh | rmsh | BN rms |
|---|---|---|---|---|---|---|---|---|
| (Count s−1) | (Hz) | (per cent) | (Hz) | (per cent) | (per cent) | |||
| N1 | 728 ± 6 | 6.00 ± 0.02 | 8.44 ± 0.07 | 7.21 ± 0.05 | 2.94 ± 0.05 | 2.19 ± 0.10 | 4.15 ± 0.09 | 12.27 ± 0.21 |
| D1 | 666 ± 6 | 5.92 ± 0.02 | 10.08 ± 0.05 | 6.72 ± 0.05 | 2.96 ± 0.08 | 2.62 ± 0.12 | 3.33 ± 0.21 | 12.07 ± 0.24 |
| N2 | 727 ± 6 | 5.75 ± 0.02 | 7.05 ± 0.12 | 7.49 ± 0.07 | 2.81 ± 0.05 | 2.38 ± 0.13 | 2.79 ± 0.05 | 12.47 ± 0.19 |
| D2 | 623 ± 6 | 5.94 ± 0.03 | 9.60 ± 0.51 | 6.42 ± 0.04 | 2.89 ± 0.10 | 2.72 ± 0.14 | 3.13 ± 0.18 | 11.82 ± 0.18 |
| N3 | 718 ± 6 | 5.66 ± 0.02 | 6.20 ± 0.13 | 6.42 ± 0.12 | 2.74 ± 0.03 | 2.46 ± 0.11 | 2.93 ± 0.05 | 11.98 ± 0.15 |
| D3 | 603 ± 6 | 5.39 ± 0.02 | 10.04 ± 0.06 | 6.34 ± 0.04 | 2.67 ± 0.16 | 3.10 ± 0.17 | 2.59 ± 0.37 | 11.71 ± 0.22 |
| N4 | 699 ± 6 | 5.31 ± 0.02 | 6.99 ± 0.12 | 5.90 ± 0.13 | 2.47 ± 0.04 | 2.21 ± 0.11 | 2.79 ± 0.07 | 11.79 ± 0.15 |
| D4 | 793 ± 6 | 6.28 ± 0.03 | 8.38 ± 0.08 | 4.92 ± 0.06 | 2.99 ± 0.12 | 2.65 ± 0.16 | 3.08 ± 0.18 | 10.85 ± 0.20 |
| N5 | 876 ± 7 | 6.78 ± 0.08 | 6.09 ± 0.21 | 6.13 ± 0.26 | 3.36 ± 0.23 | 2.02 ± 0.32 | 3.94 ± 0.07 | 9.46 ± 0.18 |
| N6 | 992 ± 7 | 7.61 ± 0.09 | 5.98 ± 0.22 | 2.86 ± 0.11 | – | – | – | 8.41 ± 0.18 |
Note. The parameters corresponding to the fundamental component are indicated with superscript ‘f’ and those corresponding to the sub-harmonic component are marked with ‘h’.
3.4 QPO frequency
Figs 6 and 7 show representative PDS in different energy bands for non-dip (N1) and dip (D1) regions, respectively. The PDS obtained from the 3–80 keV light curves showed a sharp QPO at around 6 Hz in every segment. On investigating the energy resolved PDS, we did not observe any variation of the QPO frequency with energy. The QPOs are observed in the energy ranges up to 30 keV for non-dip regions. However, in dip regions, QPOs were present in the PDS obtained from light curves up to 20 keV. Along with the primary QPO, a sub-harmonic was also observed in the PDS from light curves in 3–6 and 6–12 keV ranges. Fig. 8 shows the energy dependent QPO frequency for each segment. Table A1 presents the results from the energy-dependent timing analysis.
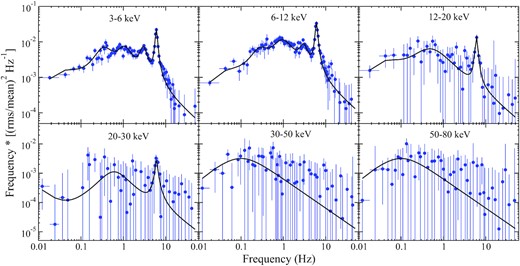
Representative PDS for non-dip (N1) region in different energy bands. The black solid lines represent the best-fit Lorentzian function.
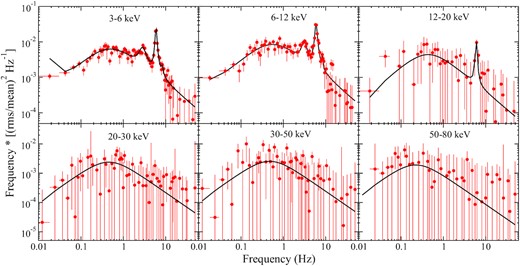
Representative PDS for dip phase (D1) in different energy bands. The black solid lines represent the best-fit Lorentzian function.
Change is QPO frequency with energy. Different colour and symbols represent the observations from different segments.
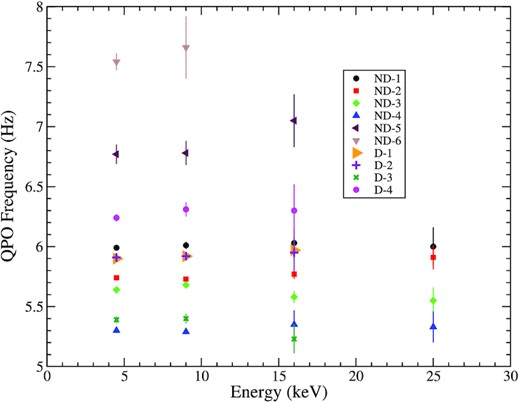
We studied evolution of the low frequency QPO during our observation. We detected a 6.00 ± 0.02 Hz QPO in the PDS of 3–30 keV range light curve from the non-dip region N1. The QPO frequency monotonically decreased to 5.31 ± 0.02 Hz till non-dip region N4. After that, the QPO frequency increased rapidly, reaching 7.61 ± 0.96 Hz during the region N6. Similar evolution of the QPO frequency were also seen in 3–6, −12, 12–20, and 20–30 keV ranges. The evolution of the QPO frequency with time is shown in Fig. 9.
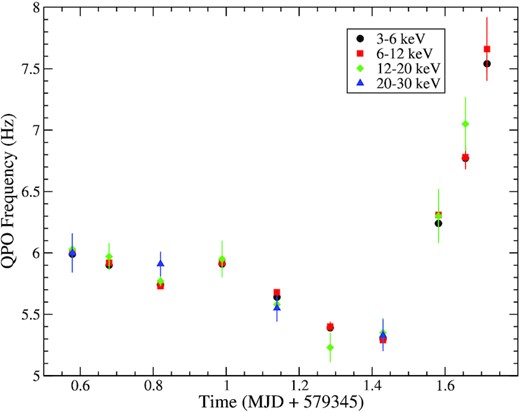
Evolution of energy-dependent QPO with time during first AstroSat observation of MAXI J1803–298. The black circles, red squares, green diamonds, and blue triangles represent the QPO frequency in 3–6, 6–12, 12–20, and 20–30 keV energy bands, respectively.
Fig. 10 shows the variation of QPO frequency as a function of mean count rate for different energy bands. In this plot, we treated the dip and non-dip regions separately, as the mean count rate of the dip regions was less compared to the non-dip regions. We fitted the data points with linear regression, using y = mx + c. The fitted parameters (slope m and intercepts c) are mentioned in the inset of each panel of Fig. 10. We found that the mean count rate is strongly correlated with the QPO frequency for the non-dip regions. However, the correlation is weak for the dip regions. Fig. 11 shows the QPO frequency as a function of hardness ratio. Here, we defined HR as the ratio between the mean count rates in 6–30 and 3–6 keV energy ranges. The QPO frequency is observed to be strongly anti-correlated with the HR.
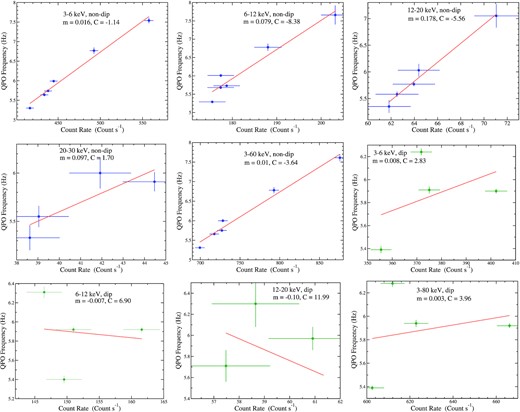
Variation of mean count rate with QPO frequency during dip and non-dip regions are shown. The blue and green points represent non-dip and dip regions, respectively. The solid line represents the linear fit with y = mx + c. The value of the slope (m) and intercept (c) are mentioned in the inset of each panel.
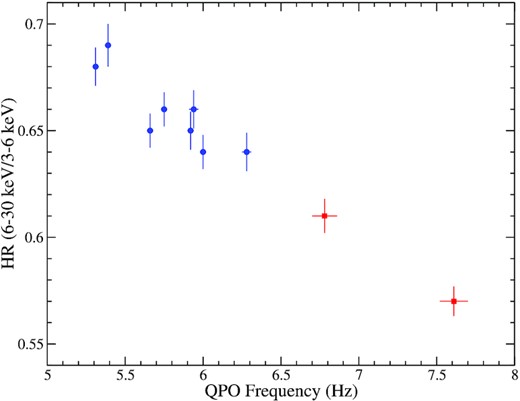
QPO frequency is plotted as a function of hardness ratio (HR). Here, we defined HR as the ratio of mean count rate in 6–30 and 3–6 keV energy range. The blue and red points represent the data from the HIMS and SIMS, respectively.
3.5 Spectral analysis
Following the procedure described in Section 2, we extracted spectra from the SXT and LAXPC data during the dip and non-dip segments separately. The spectral analysis was carried out in 0.7–80 keV range using combined SXT and LAXPC spectra. HEASEARC’s spectral analysis software package xspecXSPEC v12.10 was used in spectral fitting (Arnaud 1996). In the beginning, we tried to fit SXT and LAXPC spectra of each segment with absorbed power-law model. For the absorption, we used tbabs model with wilm abundance (Wilms, Allen & McCray 2000) and verner cross-section (Verner et al. 1996).
This model did not give us an acceptable fit with positive residuals below 4 and 6–8 keV energy ranges. This allowed us to add a multi-colour blackbody component, diskbb (Mitsuda et al. 1984; Makishima et al. 1986) and a Gaussian function at ∼6.4 keV to incorporate the Fe Kα line. We applied gain correction with fixed slope of 1 to flatten the SXT residuals at 1.8 and 2.2 keV using gain fit command. A systematic of 3 per cent was added in the simultaneous fitting (Antia et al. 2021). This model in xspec reads as: tbabs*(diskbb+powerlaw+Gaussian). This combined three components model gave us an acceptable fit with χ2 = 661 for 643 degrees of freedom, for the non-dip segment N1. We applied this model while fitting spectra from other non-dip segments and found that except for N6, spectra from all other regions fitted well. Though the absorption component was included in the model, additional negative residuals in soft X-rays (<2 keV) allowed us to add a partial absorption component pcfabs. However, this model did not give us a good fit as the absorption feature was still visible in the residuals. Hence, we replaced the pcfabs component with the ionized absorber (zxipcf) component in the model. This give us an acceptable fit with χ2 = 702 for 639 for the segment N6.
We also applied the above three components model for the dips phases. However, the spectral fitting was not statistically acceptable with poor χ2. Negative residuals at soft X-rays, as in case of non-dip segment N6, allowed us to add a neutral partial absorption component pcfabs with above model. However, it did not give us an acceptable fit. Hence, we used ionized absorber zxipcf by replacing the pcfabs component in the model. This model fitted well the spectra of all dip phases.
In our analysis, we used physical Comptonization model nthcomp (Zdziarski, Johnson & Magdziarz 1996; Życki, Done & Smith 1999), replacing phenomenological powerlaw model. We linked the seed photon temperature (kTbb) of the nthcomp model with the inner disc temperature (kTin) of the diskbb model. The nthcomp model also allowed us to estimate the hot electron plasma temperature (kTe) from the spectral fitting. Our final model reads as: tbabs*(diskbb+nthcomp+Gaussian) for N1, N2, N3, N4, & N5; and tbabs*zxipcf*(diskbb+nthcomp+Gaussian) for the dip phases & N6, respectively. Fig. 12 shows the representative spectra along with the best-fitted model components from the non-dip (N1; left hand) and dip (D1; right hand) phases. Corresponding residuals are shown in the bottom panel of each spectrum. We show the confidence contour between the photon index (Γ) and neutral column density (NH,1) for N1 in the left hand of Fig. 13, whereas in the right hand, we show the confidence contour between the ionized column density (NH,2) and neutral column density (NH,1) for D1. The results obtained from the spectral analysis are tabulated in Table A2.
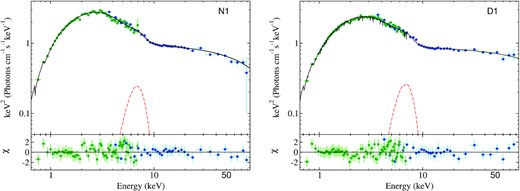
Representative energy spectra for the non-dip (N1, left hand) and dip phases (D1, right hand) are shown along with best-fitted model components. Corresponding residuals are shown in the bottom panel. The green and blue data points indicate the SXT and LAXPC data, respectively. The black solid and red dashed lines represent the best-fit model and Fe Kα line, respectively.
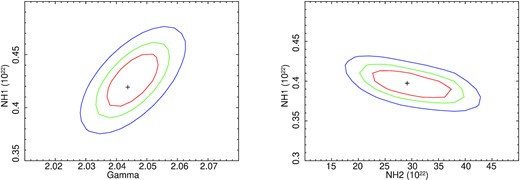
Left hand: Confidence contours between the photon index (Γ) and neutral column density (NH,1) for the non-dip segment N1. Right: Confidence contour between the ionized column density (NH,2) and neutral column density (NH,1) for the dip segment D1.
3.6 Spectral properties
We obtained a good fit to the spectra from both dip and non-dip segments. The hydrogen column density of the neutral absorber was obtained to be in the range of NH,1 ∼ 0.39–0.46 × 1022 cm−2, which is marginally higher than the Galactic hydrogen column density, NH,Gal ∼ 0.25 × 1022 cm−2 in the direction of the source (HI4PI Collaboration 2016). The hydrogen column density of the ionized absorber was obtained to be NH,2 ∼ 28 × 1022 cm−2, during the dip phases. The partial covering factor and the ionization parameter of the ionized absorber were obtained to be CF ∼ 0.5 and ξ ∼ 103.7 erg cm s−1 , respectively. The ionized column density during the non-dip segment N6 was obtained to be lower than that during the dip phases, with NH,2 ∼ 7.6 × 1022 cm−2.
The optical depth was estimated to be, τ ∼ 2 during segments from N1 to D4, which increased to ∼2.2 during the segment N6. Although, within the uncertainties, the optical depth was estimated to be constant. During our analysis, we obtained the width (σ) of the Fe Kα line to be σ ∼ 1–1.3 keV with the equivalent width of EW∼0.5–0.7 keV. We also calculated the thermal emission fraction as, fdisc = Fdisc/Ftot, where Fdisc and Ftot are the unabsorbed thermal flux and unabsorbed total flux in 0.1–100 keV range. We found that the fdisc ∼ 0.4 during segments N1 to D4 which then increased to ∼0.48 during N6. The evolution of the spectral parameters are shown in Fig. 14. The variation of (a) inner disc temperature (Tin) in keV, (b) inner disc radius (Rin) in km, (iii) photon index (Γ), (iv) Compton cloud temperature (kTe) in keV, and (v) thermal emission fraction (fdisc) are shown in top to bottom panels of Fig 14.
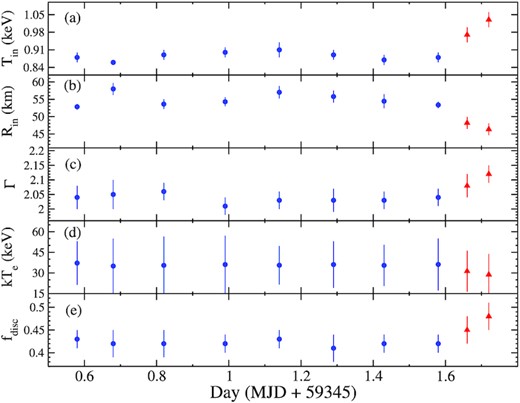
Variation of the spectral parameters: (a) inner disc temperature (Tin) in keV, (b) inner disc radius (Rin) in km, (iii) photon index (Γ), (iv) Compton cloud temperature (kTe) in keV, and (v) thermal emission fraction (fdisc) are shown from top to bottom panels, respectively. The blue circles and red triangles represent the data from the HIMS and SIMS, respectively. Rin is calculated assuming the distance d = 8 kpc and inclination angle i = 60°.
4 DISCUSSION
We studied the timing and spectral properties of MAXI J1803–298 in 0.7–80 keV energy range, using the SXT and LAXPC data from the AstroSat observations during the recent X-ray outburst. For the timing studies, we used the LAXPC data in different energy bands. For the spectral studies, we used the combined data in 0.7–7 and 3–80 keV ranges from the SXT and LAXPC instruments.
4.1 Absorption dips
We found four periodic absorption dips with a periodicity P = 7.02 ± 0.18 h, in the 3–80 keV LAXPC light curve. Although, different energy bands yield different periods (see Table 2), they are consistent within uncertainties. NuSTAR observation show the periodicity of 7.18 ± 0.92 h in the 3–78 keV energy range, which is consistent with the findings from the 3–80 keV LAXPC light curve. As the average source flux during the dip was ∼7.9 × 10⁻⁹ erg s−1 (in 3–80 keV range), about ∼10 per cent less than the flux during the non-dip phases, these dips in the light curve can not be due to the eclipse of the X-ray source by the binary companion. Usually, the absorption dips are observed at the orbital period of the system and understood to be caused due to the obscuration by the material in the bulge (thickened material) of the outer accretion disc (Frank, King & Lasota 1987). The bulge is known to be formed due to the interaction of the outer accretion disc with the in-flowing stream of gas from the companion star (e.g. Walter et al. 1982; White & Swank 1982). The period of the absorption dips are identified as the orbital period of the system, following other X-ray dippers (Zurita et al. 2008; Kuulkers et al. 2013).
In our analysis, we found that the hard X-ray photons (>6 keV) were less affected due to absorption during the dip phases (see Fig. 2). The spectral analysis showed that a neutral absorber with column density, NH,1 ∼ 0.4 × 1022 cm−2 was present during dip and non-dip phases. An additional ionized absorber was detected during the dip phases, indicating that the dips are associated with the obscuration due to bulge at the outer accretion disc. The ionized absorber had about ∼70 times higher column density (NH,2 ∼ 28 × 1022 cm−2) compared to the neutral absorber.
Here, nH, ΔR, and LX represent the hydrogen number density, length of the absorber, and incident X-ray luminosity, respectively. In BHXRBs, a typical ionized absorber is found to be located at R ∼ 104 − 6 km, when ΔR/R is assumed to be 1 (e.g.; Shidatsu et al. 2014). Assuming the absorber to be located at the outer disc in MAXI J1803–298, the location of the absorber is R ∼ 4.2–4.8 × 10⁵ km (see Section 4.2). We can estimate the X-ray luminosity (LX) during the dip phase by assuming ΔR/R=1, and the ionized absorber is located at the outer disc. The luminosity is estimated to be LX ∼ 6–8 × 1037 erg s−1. The observed value is consistent with the luminosity of typical BHRXB during the outburst phase. From this, the source is found to be accreting with 6 − 10 per cent of Eddington luminosity.
4.2 Estimation of the binary parameters
The presence of periodic absorption dips allows us to derive the orbital period of the system. The presence of dips also suggests the binary to be a high-inclination system, i.e. i > 60°. The dips in the light curve which are not due to eclipse of the X-ray source, allow us to constrain the upper limit on the inclination i.e. i < 75° (Frank et al. 1987).
In LMXBs, most of the optical emission comes from the outer region of the accretion disc, mainly due to X-ray irradiation (van Paradijs & McClintock 1994; Shahbaz et al. 1996; van Paradijs 1996; Tetarenko et al. 2021). MAXI J1803–298 was observed in the optical wavebands with the Robert Stobie Spectrograph on the Southern African Large Telescope, Gran Telescopio Canarias, and Very Large Telescope. The optical spectra from these observations are found to be consistent with the spectra of LMXBs (Buckley et al. 2021; Mata Sánchez et al. 2022). During the outburst, a double-eaked H α line was observed. Between 2021 May 5 and 2021 July 2, the peak-to-peak separation of H α line is observed to be ∼500–700 km s−1(Mata Sánchez et al. 2022). Assuming that the H α line is arising from the outer accretion disc, we have a conservative estimation of rotational velocity of the outer disc as, vdsin i ∼ 500–700 km s−1.
We now estimate the radial velocity of the donor star (K2) based on the relation, vd/K2 ≈ 1.1–1.25 (Orosz et al. 1994; Orosz & Bailyn 1995; Shaw et al. 2016). From this, the radial velocity is estimated to be, K2 ≈ 430–730 km s−1, assuming i = 60°– 75°. We further estimated the mass function of the system as f(M) = 2.4–11.7 M⊙ using equation (3). From the FWHM of H α line, Mata Sánchez et al. (2022) estimated the radial velocity as, K2 = 410–620 km s−1 at 95 per cent confidence. Using this, the mass function is estimated to be, f(M) = 2.1–7.2 M⊙.
Using equations (5) and (6), the mass and the radius of the donor star are estimated to be, M2 = 0.77 ± 0.02 M⊙ and R2 ∼ 0.77 ± 0.02 M⊙.
We estimated the mass and radius of the donor star as M2 = 0.77 ± 0.05 M⊙ and R2 = 0.78 ± 0.04 R⊙, respectively which are consistent with the above findings. Using the same relation, Kuulkers et al. (2013) estimated the mass and radius of the companion in a BHXB MAXI J1659–152. Warner (1995) derived the mass-period relation for the CV as M2 = 0.065 P5/4. From this, the mass of the companion star would be M2 ∼ 0.74 ± 0.03 M⊙, which is consistent with the above findings. From the above estimation of the mass, radius, and density, the companion star could be a K-type star if it is a main-sequence star (Keenan & McNeil 1989; Pecaut & Mamajek 2013). This means that MAXI J1803–298 is an LMXB as suggested from the optical observations (Hosokawa et al. 2021).
We tried to estimate the mass of the BH from the estimated mass function and mass of the companion star. The mass function is estimated to be f(M) = 2.1–7.2 M⊙. From this, the mass of the BH is estimated to be, MBH ∼ 3.5–12.5 M⊙, for the inclination angle i = 60°– 75° and mass of the donor star as M2 = 0.77 ± 0.05 M⊙. Mata Sánchez et al. (2022) also estimated the mass of BH as MBH ∼ 3–10 M⊙, assuming i > 65 and 0.01 < q < 0.2. This is consistent with our estimation.
One can estimate the Roche lobe for the primary by replacing ‘q’ with ‘q−1’. The Roche lobe for the primary is estimated to be R1, L ∼ (6.3–7.2) × 105 km. Now, assuming, the outer radius of the accretion disc (Rout) as 2/3 of RL, the outer radius of the accretion disc is estimated to be Rout ∼ 4.2–4.8 × 10⁵ km.
4.3 Spectral state transition
An outburst is believed to be triggered by the sudden enhancement of the viscosity at the outer edge of the disc (Ebisawa, Titarchuk & Chakrabarti 1996; Bhowmick et al. 2021) or disc instability (e.g. Lasota 2001). At the beginning of the outburst, the source is believed to be in the LHS when the disc is truncated at a large distance with a dominance of Comptonized emission (Remillard & McClintock 2006). As the outburst progresses, the disc moves towards the BH, causing the disc emission to dominate over the Comptonized emission and the source moves through the HIMS, SIMS, and HSS. In the declining phase, the source evolves through the SIMS, HIMS, and LHS and the disc moves outwards.
During the present outburst of MAXI J1803–298, the source was in the LHS when the outburst started. Then, it moved through the IMS and HSS before entering to the declining phase. Throughout the outburst, the HR was found to be constant. This did not allow us to infer the spectral state classification explicitly. A detail study of the spectral and timing properties in a daily basis is required which is out of scope of the present work.
During the first AstroSat observation, the evolution of the timing and spectral parameters (presented in Section 3) indicates the changes in the accretion geometry during the observation period. From the spectral and timing properties, it is clear that AstroSat observed the source during the state transition from HIMS to SIMS. During the first eight segments (N1 to D4 in Fig. 2), the source was in the HIMS with nearly constant flux. An increasing flux (count rate) was observed during the segment N5 during which the source entered to the SIMS and remained there till the end of our observation. Additionally, the hardness ratio (HR1) decreased, indicating the dominance of the soft photons in the SIMS.
Evolving Type-C QPOs are known to be detected in the HIMS and LHS, whereas the sporadic Type-A or Type-B QPOs may be observed in the SIMS (Nandi et al. 2012). However, no QPOs are observed in the HSS (Belloni et al. 2005; Remillard & McClintock 2006). The oscillation of the Compton cloud is believed to be responsible for the QPOs (Molteni, Ryu & Chakrabarti 1996; Titarchuk, Lapidus & Muslimov 1998; Cabanac et al. 2010). It is well established that the Comptonized photons are responsible for the variabilities observed in the PDS and the light curves (Chakrabarti & Manickam 2000; van der Klis 2004). In general, strong variabilities are observed in the LHS with fractional rms amplitude of ∼20–40 per cent. In the HIMS and SIMS, the fractional rms amplitudes of ∼10–20 and ∼5–10 per cent are seen, respectively. In the HSS, however, weak variabilities with fractional rms amplitude of <5 per cent are observed (van der Klis 1994, 1997; Belloni et al. 2005). During our observation, we detected evolving Type-C QPOs with strong variabilities with fractional rms amplitude of |$\sim 15\!-\!20{{\ \rm per\ cent}}$|. This indicated that the observation was made during the intermediate state, i.e. HIMS & SIMS.
We also calculated the rms in different energy bands and constructed the rms spectra. The rms was observed to be maximum in 6–12 keV energy band with the rms |$\sim 15\!-\!20 {{\ \rm per\ cent}}$| and decreased in the higher energy bands. In general, flat and inverted rms spectra are observed in the LHS and HSS, respectively (Gierliński & Zdziarski 2005). In the intermediate states (HIMS and SIMS), the rms spectra are generally characterised with two slopes along with the peak appearing at certain energy band (Gierliński & Zdziarski 2005). The observed rms spectra (in present work) are similar to that generally observed in the intermediate state (Gierliński & Zdziarski 2005; Shaposhnikov et al. 2010; Rout et al. 2021).
The QPO frequency is found to vary in the range of 5.31 ± 0.02 − 6.28 ± 0.03 Hz during the segments from N1 to D4, which then increased to ∼7.61 ± 0.09 Hz during the segment N6. The Q-factor and rms (QPO rms and broad-band rms) also decreased during N5 and N6, indicating a different spectral state. The observed spectral properties also supported the state transition. The inner disc temperature was observed to be Tin ∼ 0.9 keV during the HIMS, while it increased to ∼1 keV during the SIMS. The photon index was also observed to become soft during the SIMS. The thermal emission fraction (fdisc) was observed to increase in the SIMS from 0.42 to 0.48.
4.4 Accretion geometry
It is suggested that the QPO frequency (νQPO) would vary with the Compton cloud boundary (X), as νQPO ∼ 1/X3/2 (Chakrabarti & Manickam 2000; Chakrabarti et al. 2008). Thus, the observed variation in the QPO frequency indicated an evolving Compton cloud. In the HIMS (segments N1 to D4), the QPO frequency varied in the range of 5.31 ± 0.02 − 6.28 ± 0.03 Hz. The QPO frequency increased in the SIMS (N5 & N6) to νQPO ∼ 7.61 ± 0.09 Hz, which indicated a contracting Compton corona. The evolution of the Compton cloud is also evident from the observed changes in the optical depth. The corona became more dense during the SIMS with an increasing optical depth. Beside the evolution of the Compton corona, the accretion disc was also observed to evolve. The inner disc radius (Rin) was observed to decrease in the SIMS to Rin ∼ 46 km from Rin ∼ 52–59 km in the HIMS. This indicated that the disc was moving towards to the BH as the outburst progressed.
The QPO frequencies were observed to be correlated with the count rate in the non-dip phases in different energy bands. The correlation of QPO frequency and count rate has been observed in other LMXB also (e.g. Reig et al. 2000; Bogensberger et al. 2020). As the outburst progressed, the flux (count rate) increased and simultaneously, the Compton corona contracts, resulting a higher QPO frequency (Chakrabarti, Mondal & Debnath 2015; Jana et al. 2016). Beside this, we did not observe the QPO frequency-count rate correlation for dip phases. This could be due to the absorption during the dip phases. The contracting corona also explains the observed anti-correlation between the QPO frequency and HR. The contracting corona would produce less Comptonized emission, compared to the soft-photons, which led to decreasing HR.
The disc wind is equatorial and generally observed in the thermal dominated state, i.e. in SIMS and HSS (Miller, Cackett & Reis 2009; Miller et al. 2012; Ponti et al. 2012). During the dip phases, an ionized absorber was observed which could be a bulge region at the outer edge of the disc (see Sec 3.2), which is not seen during the non-dip phases (N1 – N5). We observed an ionized absorber during the non-dip segment N6 which is clearly different than the absorber that was observed during the dip phases (different NH, ξ). This absorber could be associated with the disc wind. Miller & Reynolds (2021) also found evidences for disc wind in the XRT spectra of MAXI J1803–298 in the HSS. The evidence of the disc wind also observed on the optical spectra, which show P-cygni profile H α and He I6678 lines (Mata Sánchez et al. 2022).
During our AstroSat observation, we found a broad iron emission line (σ ∼ 1.2–1.3 keV). It is possible that more than one lines are blended forming a broad line. As there is evidence of ionized disc wind, ionized Fe lines (Fe H II line at 6.7 keV or Fe He II line at 6.96 keV) are expected to be observed in the spectrum. However, the spectral resolution of LAXPC did not allow us to resolve them.
5 SUMMARY
We studied a recently discovered BH candidate MAXI J1803–298 during its 2021 outburst using the data obtained from AstroSat. We studied the source using the combined data of SXT and LAXPC in the 0.7–80 keV range. Our key findings are given below.
AstroSat observed the presence of periodic dips in the 3–80 KeV LAXPC light curve with a periodicity of 7.02 ± 0.18 h. The absorption dips are proposed to be caused by the obscured materials of the bulge (thickened material) of the outer accretion disc.
We estimate the mass function of the binary as f(M) = 2.1–7.2 M⊙. From this, we estimated the mass of the BH which lies in the range of MBH ∼ 3.5–12.5 M⊙.
The dip and non-dip spectra are fitted with absorbed thermal and Comptonized components. The spectra during the dips are required an addition ionized absorption component. The ionized absorption component is characterized with a column density of NH,2 ∼ 28 × 1022 cm−2 and ionization parameter, ξ ∼ 103.7 erg cm s−1.
AstroSat observed the source during the state transition. The source was in the HIMS at initial phase of the observation. The source entered to the SIMS towards the end of our observation.
We find a sharp type-C QPO in every dip and non-dip segments in our observation. We also find that the QPO frequency evolved during our observation duration.
The spectral parameters are also found to evolve during the observation.
We find the evidence of evolving Compton corona and accretion disc during our observation.
Evidence of disc wind was observed in the spectra from the SIMS.
ACKNOWLEDGEMENTS
We thank the anonymous reviewer for his/her suggestions and comments that helped us to improve the quality of this manuscript. Work at Physical Research Laboratory, Ahmedabad, is funded by the Department of Space, Government of India. AJ acknowledge the support of the grant from the Ministry of Science and Technology of Taiwan with the grant number MOST 110-2811-M-007-500and MOST 111-2811-M-007-002. This research made use of the data obtained through ToO phase of AstroSat observations. The authors thank the SXT-POC of TIFR and the LAXPC team of IUCAA and TIFR for providing the data extraction software for the respective instruments. This research has made use of the NuSTAR Data Analysis Software (NuSTARDAS) jointly developed by the ASI Space Science Data Center (SSDC, Italy) and the California Institute of Technology (Caltech, USA).
DATA AVAILABILITY
We used the data of AstroSat observatories for this work.
Footnotes
REFERENCES
APPENDIX A: TABLE-A
Energy-dependent timing properties.
| ID | Energy | Mean count | QPOf | Q-factorf | rmsf | QPOh | Q-factorh | rmsh | BN rms |
|---|---|---|---|---|---|---|---|---|---|
| (keV) | (Counts s−1) | (Hz) | (per cent) | (Hz) | (per cent) | (per cent) | |||
| N1 | 3–6 | 445 ± 5 | 5.99 ± 0.02 | 8.87 ± 0.09 | 8.13 ± 0.07 | 2.94 ± 0.06 | 2.26 ± 0.10 | 3.55 ± 0.06 | 13.08 ± 1.09 |
| 6–12 | 177 ± 3 | 6.01 ± 0.03 | 8.39 ± 0.11 | 8.37 ± 0.08 | 2.90 ± 0.09 | 2.05 ± 0.11 | 4.46 ± 0.06 | 14.21 ± 1.14 | |
| 12–20 | 64 ± 2 | 6.03 ± 0.12 | 8.87 ± 0.05 | 6.41 ± 0.04 | 3.23 ± 1.12 | 3.76 ± 0.30 | 1.77 ± 0.90 | 8.54 ± 1.22 | |
| 20–30 | 57 ± 2 | 6.00 ± 0.16 | 6.17 ± 0.77 | 4.59 ± 0.19 | – | – | – | 3.10 ± 0.35 | |
| 30–50 | 51 ± 2 | – | – | – | – | – | – | 3.50 ± 0.42 | |
| 50–80 | 42 ± 2 | – | – | – | – | – | – | 2.33 ± 0.61 | |
| D1 | 3–6 | 402 ± 5 | 5.90 ± 0.02 | 11.42 ± 0.07 | 7.28 ± 0.50 | 2.98 ± 0.12 | 2.68 ± 0.12 | 2.68 ± 0.22 | 12.53 ± 1.01 |
| 6–12 | 170 ± 3 | 5.92 ± 0.03 | 8.45 ± 0.94 | 7.63 ± 0.47 | 3.08 ± 0.14 | 3.35 ± 0.59 | 3.48 ± 0.22 | 13.67 ± 1.15 | |
| 12–20 | 61 ± 2 | 5.97 ± 0.11 | 8.42 ± 0.33 | 2.59 ± 0.28 | – | – | – | 5.25 ± 0.45 | |
| 20–30 | 60 ± 2 | – | – | – | – | – | – | 4.33 ± 0.29 | |
| 30–50 | 54 ± 2 | – | – | – | – | – | – | 4.76 ± 0.39 | |
| 50–80 | 42 ± 2 | – | – | – | – | – | – | 1.12 ± 0.18 | |
| N2 | 3–6 | 438 ± 5 | 5.74 ± 0.02 | 7.40 ± 0.12 | 8.96 ± 0.12 | 2.80 ± 0.07 | 2.34 ± 0.11 | 2.72 ± 0.07 | 12.98 ± 0.95 |
| 6–12 | 179 ± 3 | 5.73 ± 0.02 | 6.76 ± 0.15 | 9.59 ± 0.11 | 2.81 ± 0.07 | 2.19 ± 0.13 | 3.74 ± 0.12 | 15.67 ± 1.08 | |
| 12–20 | 66 ± 2 | 5.77 ± 0.04 | 9.07 ± 0.11 | 7.06 ± 0.53 | 3.02 ± 0.11 | 2.34 ± 0.20 | 1.82 ± 0.32 | 11.97 ± 1.09 | |
| 20–30 | 61 ± 2 | 5.91 ± 0.10 | 10.53 ± 0.27 | 4.89 ± 0.21 | – | – | – | 9.34 ± 0.83 | |
| 30–50 | 55 ± 2 | – | – | – | – | – | – | 5.44 ± 0.19 | |
| 50–80 | 44 ± 2 | – | – | – | – | – | – | 4.41 ± 0.27 | |
| D2 | 3–6 | 375 ± 4 | 5.91 ± 0.03 | 9.89 ± 0.03 | 8.79 ± 0.04 | 2.87 ± 0.18 | 2.42 ± 0.10 | 2.37 ± 0.18 | 12.98 ± 1.14 |
| 6–12 | 166 ± 3 | 5.92 ± 0.03 | 10.19 ± 0.12 | 9.63 ± 0.09 | – | – | – | 10.21 ± 1.18 | |
| 12–20 | 57 ± 2 | 5.71 ± 0.15 | 11.49 ± 0.33 | 4.25 ± 0.26 | – | – | – | 5.23 ± 0.51 | |
| 20–30 | 55 ± 1 | – | – | – | – | – | – | 3.53 ± 0.41 | |
| 30–50 | 50 ± 2 | – | – | – | – | – | – | 3.56 ± 0.61 | |
| 50–80 | 39 ± 2 | – | – | – | – | – | – | 2.69 ± 0.14 | |
| N3 | 3–6 | 434 ± 5 | 5.64 ± 0.01 | 6.24 ± 0.18 | 6.79 ± 0.16 | 2.75 ± 0.04 | 2.66 ± 0.14 | 2.34 ± 0.08 | 10.94 ± 1.08 |
| 6–12 | 177 ± 3 | 5.68 ± 0.02 | 5.86 ± 0.22 | 7.16 ± 0.14 | 2.64 ± 0.07 | 1.99 ± 0.15 | 3.54 ± 0.10 | 13.12 ± 1.11 | |
| 12–20 | 68 ± 2 | 5.58 ± 0.05 | 5.43 ± 0.26 | 3.87 ± 0.15 | 3.23 ± 0.21 | 4.57 ± 0.29 | 1.97 ± 0.31 | 8.05 ± 0.95 | |
| 20–30 | 57 ± 1 | 5.55 ± 0.11 | 3.76 ± 0.32 | 3.37 ± 0.21 | – | – | – | 6.63 ± 0.24 | |
| 30–50 | 50 ± 2 | – | – | – | – | – | – | 3.62 ± 0.39 | |
| 50–80 | 39 ± 2 | – | – | – | – | – | – | 2.56 ± 0.12 | |
| D3 | 3–6 | 355 ± 4 | 5.39 ± 0.03 | 10.12 ± 0.07 | 6.83 ± 0.05 | 2.33 ± 0.18 | 1.73 ± 0.17 | 2.76 ± 0.25 | 11.69 ± 1.09 |
| 6–12 | 165 ± 3 | 5.40 ± 0.04 | 8.12 ± 0.11 | 7.54 ± 0.08 | 2.81 ± 0.07 | 7.34 ± 0.17 | 3.06 ± 0.19 | 11.76 ± 1.20 | |
| 12–20 | 61 ± 2 | 5.23 ± 0.12 | 9.58 ± 0.31 | 4.03 ± 0.23 | – | – | – | 6.23 ± 0.23 | |
| 20–30 | 55 ± 1 | – | – | – | – | – | – | 3.12 ± 0.21 | |
| 30–50 | 49 ± 2 | – | – | – | – | – | – | 2.33 ± 0.20 | |
| 50–80 | 36 ± 2 | – | – | – | – | – | – | 1.65 ± 0.13 | |
| N4 | 3–6 | 417 ± 5 | 5.30 ± 0.02 | 7.06 ± 0.05 | 5.43 ± 0.03 | 2.46 ± 0.06 | 2.45 ± 0.08 | 2.27 ± 0.10 | 10.64 ± 1.08 |
| 6–12 | 175 ± 3 | 5.29 ± 0.02 | 6.83 ± 0.06 | 7.71 ± 0.04 | 2.51 ± 0.13 | 1.93 ± 0.14 | 3.10 ± 0.22 | 13.59 ± 1.22 | |
| 12–20 | 69 ± 2 | 5.35 ± 0.12 | 6.40 ± 0.24 | 6.19 ± 0.20 | – | – | – | 7.57 ± 0.69 | |
| 20–30 | 58 ± 1 | 5.33 ± 0.13 | 5.14 ± 0.21 | 3.13 ± 0.34 | – | – | – | 6.00 ± 0.46 | |
| 30–50 | 50 ± 2 | – | – | – | – | – | – | 1.14 ± 0.21 | |
| 50–80 | 39 ± 2 | – | – | – | – | – | – | 1.80 ± 0.18 | |
| D4 | 3–6 | 372 ± 4 | 6.24 ± 0.03 | 8.43 ± 0.12 | 5.51 ± 0.08 | 3.05 ± 0.14 | 2.74 ± 0.21 | 2.80 ± 0.23 | 10.90 ± 1.16 |
| 6–12 | 161 ± 3 | 6.31 ± 0.06 | 8.37 ± 0.17 | 6.53 ± 0.11 | 2.97 ± 0.18 | 3.84 ± 0.29 | 3.25 ± 0.34 | 11.14 ± 1.18 | |
| 12–20 | 59 ± 2 | 6.30 ± 0.22 | 12.62 ± 0.75 | 2.26 ± 0.51 | – | – | – | 5.41 ± 0.43 | |
| 20–30 | 57 ± 1 | – | – | – | – | – | – | 3.34 ± 0.46 | |
| 30–50 | 49 ± 2 | – | – | – | – | – | – | 3.17 ± 0.55 | |
| 50–80 | 35 ± 2 | – | – | – | – | – | – | 2.56 ± 0.16 | |
| N5 | 3–6 | 492 ± 5 | 6.77 ± 0.08 | 6.10 ± 0.21 | 5.98 ± 0.13 | 3.16 ± 0.24 | 2.00 ± 0.31 | 3.30 ± 0.25 | 12.96 ± 1.10 |
| 6–12 | 188 ± 3 | 6.78 ± 0.10 | 4.81 ± 0.24 | 7.52 ± 0.14 | 3.71 ± 0.22 | 3.07 ± 0.35 | 4.34 ± 0.32 | 12.56 ± 1.15 | |
| 12–20 | 71 ± 2 | 7.05 ± 0.22 | 5.12 ± 0.87 | 5.50 ± 0.53 | – | – | – | 7.89 ± 0.78 | |
| 20–30 | 61 ± 1 | – | – | – | – | – | – | 5.10 ± 0.15 | |
| 30–50 | 55 ± 2 | – | – | – | – | – | – | 4.39 ± 0.32 | |
| 50–80 | 41 ± 2 | – | – | – | – | – | – | 2.23 ± 0.18 | |
| N6 | 3–6 | 558 ± 5 | 7.54 ± 0.07 | 9.46 ± 0.22 | 8.10 ± 0.14 | – | – | – | 8.50 ± 0.91 |
| 6–12 | 203 ± 3 | 7.66 ± 0.26 | 3.92 ± 0.49 | 9.65 ± 0.27 | – | – | – | 9.92 ± 1.17 | |
| 12–20 | 69 ± 2 | – | – | – | – | – | – | 9.98 ± 0.42 | |
| 20–30 | 60 ± 2 | – | – | – | – | – | – | 6.01 ± 0.32 | |
| 30–50 | 56 ± 2 | – | – | – | – | – | – | 4.69 ± 0.48 | |
| 50–80 | 46 ± 2 | – | – | – | – | – | – | 2.13 ± 0.15 |
Note. The parameters corresponding to the fundamental component are indicated with superscript ‘f’ and those corresponding to the sub-harmonic component with ‘h’.
Spectral analysis result.
| ID | Date | NH,1 | NH,2 | log ξ | CF | Tin | Ndbb | Γ | kTe |
|---|---|---|---|---|---|---|---|---|---|
| (Day*) | (1022 cm−2) | (1022 cm−2) | log (erg cm s−1 ) | (keV) | (keV) | ||||
| (1) | (2) | (3) | (4) | (5) | (6) | (7) | (8) | (9) | (10) |
| τ | Nnth | σ | EW | LN | Ftot | fdisc | χ2/degrees | ||
| (10−2 ph cm−2 s−1) | (keV) | (keV) | (10−2 ph cm−2 s−1) | (10−9 erg cm−2 s−1) | of freedom | ||||
| (11) | (12) | (13) | (14) | (15) | (16) | (17) | (18) | ||
| N1 | 0.58 | |$0.41^{+0.02}_{-0.01}$| | – | – | – | |$0.88^{+0.02}_{-0.02}$| | |$1236^{+95}_{-78}$| | |$2.04^{+0.04}_{-0.03}$| | |$37^{+22}_{-10}$| |
| |$1.98^{+0.54}_{-0.64}$| | |$0.49^{+0.04}_{-0.04}$| | |$1.24^{+0.21}_{-0.16}$| | |$0.54^{+0.01}_{-0.02}$| | |$3.58^{+0.89}_{-0.64}$| | |$9.18^{+0.08}_{-0.09}$| | |$0.43^{+0.02}_{-0.02}$| | 659/644 | ||
| D1 | 0.68 | |$0.40^{+0.02}_{-0.02}$| | |$28.78^{+8.76}_{-6.21}$| | |$3.78^{+0.63}_{-0.34}$| | |$0.43^{+0.02}_{-0.03}$| | |$0.86^{+0.01}_{-0.01}$| | |$1488^{+66}_{-116}$| | |$2.05^{+0.04}_{-0.05}$| | |$35^{+15}_{-22}$| |
| |$2.04^{+1.09}_{-0.49}$| | |$0.33^{+0.03}_{-0.04}$| | |$1.26^{+0.15}_{-0.19}$| | |$0.62^{+0.02}_{-0.01}$| | |$5.07^{+0.94}_{-1.45}$| | |$8.71^{+0.07}_{-0.10}$| | |$0.42^{+0.02}_{-0.03}$| | 683/654 | ||
| N2 | 0.82 | |$0.45^{+0.01}_{-0.03}$| | – | – | – | |$0.89^{+0.02}_{-0.02}$| | |$1272^{+92}_{-45}$| | |$2.06^{+0.04}_{-0.02}$| | |$35^{+17}_{-24}$| |
| |$2.01^{+1.44}_{-0.45}$| | |$0.38^{+0.02}_{-0.05}$| | |$1.18^{+0.12}_{-0.25}$| | |$0.71^{+0.01}_{-0.01}$| | |$4.27^{+0.96}_{-0.68}$| | |$9.07^{+0.11}_{-0.13}$| | |$0.42^{+0.02}_{-0.03}$| | 672/633 | ||
| D2 | 0.99 | |$0.39^{+0.03}_{-0.02}$| | |$27.99^{+6.21}_{-8.12}$| | |$3.73^{+0.58}_{-0.43}$| | |$0.45^{+0.03}_{-0.03}$| | |$0.90^{+0.01}_{-0.02}$| | |$1305^{+53}_{-71}$| | |$2.01^{+0.03}_{-0.03}$| | |$36^{+26}_{-15}$| |
| |$2.06^{+0.97}_{-0.71}$| | |$0.31^{+0.03}_{-0.02}$| | |$1.21^{+0.16}_{-0.21}$| | |$0.48^{+0.01}_{-0.02}$| | |$3.77^{+1.06}_{-0.54}$| | |$7.75^{+0.09}_{-0.12}$| | |$0.42^{+0.01}_{-0.03}$| | 648/630 | ||
| N3 | 1.14 | |$0.45^{+0.02}_{-0.04}$| | – | – | – | |$0.91^{+0.04}_{-0.02}$| | |$1439^{+103}_{-83}$| | |$2.03^{+0.03}_{-0.04}$| | |$36^{+11}_{-16}$| |
| |$2.04^{+1.08}_{-0.41}$| | |$0.39^{+0.04}_{-0.03}$| | |$1.23^{+0.13}_{-0.18}$| | |$0.60^{+0.02}_{-0.03}$| | |$4.76^{+0.91}_{-1.15}$| | |$9.07^{+0.11}_{-0.08}$| | |$0.43^{+0.02}_{-0.02}$| | 689/659 | ||
| D3 | 1.29 | |$0.40^{+0.02}_{-0.03}$| | |$28.94^{+5.23}_{-10.73}$| | |$3.78^{+0.64}_{-0.49}$| | |$0.55^{+0.02}_{-0.04}$| | |$0.89^{+0.02}_{-0.01}$| | |$1378^{+98}_{-77}$| | |$2.03^{+0.03}_{-0.05}$| | |$36^{+14}_{-19}$| |
| |$2.03^{+1.25}_{-0.59}$| | |$0.27^{+0.04}_{-0.05}$| | |$1.20^{+0.15}_{-0.11}$| | |$0.57^{+0.02}_{-0.02}$| | |$4.08^{+0.75}_{-0.92}$| | |$7.32^{+0.12}_{-0.09}$| | |$0.41^{+0.03}_{-0.02}$| | 714/701 | ||
| N4 | 1.43 | |$0.39^{+0.03}_{-0.01}$| | – | – | – | |$0.87^{+0.01}_{-0.03}$| | |$1312^{+112}_{91}$| | |$2.03^{+0.04}_{-0.02}$| | |$36^{+19}_{-12}$| |
| |$2.04^{+0.70}_{-0.60}$| | |$0.46^{+0.03}_{-0.03}$| | |$1.20^{+0.15}_{-0.15}$| | |$0.65^{+0.01}_{-0.01}$| | |$4.67^{+0.84}_{-1.17}$| | |$9.19^{+0.15}_{-0.12}$| | |$0.42^{+0.01}_{-0.02}$| | 701/642 | ||
| D4 | 1.58 | |$0.42^{+0.02}_{-0.02}$| | |$28.07^{+7.22}_{-9.31}$| | |$3.74^{+0.54}_{-0.59}$| | |$0.45^{+0.03}_{-0.04}$| | |$0.88^{+0.02}_{-0.02}$| | |$1213^{+78}_{-109}$| | |$2.04^{+0.02}_{-0.03}$| | |$36^{+21}_{-17}$| |
| |$2.00^{+1.20}_{-0.58}$| | |$0.33^{+0.02}_{-0.03}$| | |$1.08^{+0.17}_{-0.12}$| | |$0.61^{+0.01}_{-0.01}$| | |$4.41^{+0.78}_{-0.96}$| | |$8.15^{+0.15}_{-0.09}$| | |$0.42^{+0.02}_{-0.02}$| | 655/627 | ||
| N5 | 1.66 | |$0.40^{+0.02}_{-0.02}$| | – | – | – | |$0.97^{+0.02}_{-0.04}$| | |$1028^{+65}_{-88}$| | |$2.08^{+0.03}_{-0.04}$| | |$31^{+21}_{-10}$| |
| |$2.19^{+0.72}_{-0.73}$| | |$0.43^{+0.05}_{-0.05}$| | |$1.27^{+0.08}_{-0.20}$| | |$0.51^{+0.01}_{-0.02}$| | |$3.63^{+0.54}_{-0.82}$| | |$10.62^{+0.10}_{-0.14}$| | |$0.45^{+0.03}_{-0.02}$| | 703/665 | ||
| N6 | 1.72 | |$0.46^{+0.01}_{-0.03}$| | |$7.61^{+2.23}_{-1.23}$| | |$3.67^{+0.71}_{-0.33}$| | |$0.53^{+0.02}_{-0.05}$| | |$1.03^{+0.03}_{-0.02}$| | |$951^{+81}_{-63}$| | |$2.12^{+0.02}_{-0.03}$| | |$29^{+18}_{-11}$| |
| |$2.21^{+0.92}_{-0.68}$| | |$0.46^{+0.04}_{-0.03}$| | |$1.16^{+0.21}_{-0.15}$| | |$0.48^{+0.02}_{-0.01}$| | |$3.86^{+1.05}_{-0.77}$| | |$11.75^{+0.11}_{-0.16}$| | |$0.48^{+0.02}_{-0.03}$| | 702/639 |
Note. *Day 0 = MJD 59345. Errors are quoted at 1σ.
