-
PDF
- Split View
-
Views
-
Cite
Cite
P Cristofari, A Marcowith, M Renaud, V V Dwarkadas, V Tatischeff, G Giacinti, E Peretti, H Sol, The first days of Type II-P core collapse supernovae in the gamma-ray range, Monthly Notices of the Royal Astronomical Society, Volume 511, Issue 3, April 2022, Pages 3321–3329, https://doi.org/10.1093/mnras/stac217
Close - Share Icon Share
ABSTRACT
Type II-P supernovæ (SNe), the most common core-collapse SNe type, result from the explosions of red supergiant stars. Their detection in the radio domain testifies of the presence of relativistic electrons, and shows that they are potentially efficient energetic particle accelerators. If hadrons can also be accelerated, these energetic particles are expected to interact with the surrounding medium to produce a gamma-ray signal even in the multi–TeV range. The intensity of this signal depends on various factors, but an essential one is the density of the circumstellar medium. Such a signal should however be limited by electron–positron pair production arising from the interaction of the gamma-ray photons with optical photons emitted by the supernova photosphere, which can potentially degrade the gamma-ray signal by over ten orders of magnitude in the first days/weeks following the explosion. We calculate the gamma-gamma opacity from a detailed modelling of the time evolution of the forward shock and supernova photosphere, taking a full account of the non-isotropy of the photon interactions. We discuss the time-dependent gamma-ray TeV emission from Type II-P SNe as a function of the stellar progenitor radius and mass-loss rate, as well as the explosion energy and mass of the ejected material. We evaluate the detectability of the SNe with the next generation of Cherenkov telescopes. We find that, while most extragalactic events may be undetectable, Type II-P SNe exploding in our Galaxy or in the Magellanic Clouds should be detected by gamma-ray observatories such as the upcoming Cherenkov Telescope Array.
1 INTRODUCTION
Core collapse supernovae (CCSNe) result from the explosive deaths of massive stars with masses |$\gtrsim 10\, \mathrm{ M}_{\odot }$| (Heger et al. 2003). The explosion produces a fast shock propagating out into the circumstellar medium, and a second ‘reverse’ shock expanding back into the ejecta. SNe are expected to radiate over the entire multi-wavelength spectrum, and for now have been observed at all except at the very highest energies. In the very–high–energy range, CCSNe are important because they have been invoked as being capable of accelerating particles up to, or even above, the PeV range (see e.g. Tatischeff 2009; Bell et al. 2013; Marcowith et al. 2014; Murase, Thompson & Ofek 2014; Schure & Bell 2014; Cardillo, Amato & Blasi 2015; Giacinti & Bell 2015; Zirakashvili & Ptuskin 2016; Petropoulou et al. 2017; Bykov et al. 2018a; Marcowith et al. 2018; Murase et al. 2019; Fang et al. 2019) and reviews by Bykov et al. (2018b), Tamborra & Murase (2018).
Besides, the PeV range is an important milestone in cosmic ray (CR) physics. The spectrum of CRs measured at the Earth follows a remarkable power law in energy, with mild deviation, up to the knee domain, at ∼ 1–3 PeV, where a major spectral deviation occurs. The sources producing the bulk of CRs are expected to accelerate particles up to the PeV range, and to lie within the Galaxy (Cristofari, Blasi & Amato 2020a). The hunt for pevatrons is now a well-identified key target of the astroparticle community (see e.g. Blasi 2019; Cherenkov Telescope Array Consortium et al. 2019; Gabici et al. 2019; Cristofari 2021, for reviews on the topic).
The possibility that CCSNe could accelerate PeV particles is a strong motivation for their study. The acceleration of PeV particles should directly lead to the production of a potentially detectable amount of gamma-rays from the GeV to the multi–TeV range (Kirk, Duffy & Ball 1995), due to the interaction of accelerated protons with interstellar medium (ISM) nuclei, through the production of pions. This possibility has been discussed in various works (Dwarkadas 2013; Marcowith et al. 2018; Fang et al. 2019; Murase et al. 2019), and recent studies based on Fermi-LAT data have reported marginally-to-moderately significant variable high-energy emission towards the peculiar H-rich superluminous SN iPTF14hls (Yuan et al. 2018), the nearby Type IIP event SN 2004dj (Xi et al. 2020), and in the direction of the SN candidates AT2019bvr and AT2018iwp, with a flux increase within 6 months after the discovery date (Prokhorov, Moraghan & Vink 2021). Future instruments optimised in the TeV and multi–TeV range (Cherenkov Telescope Array Consortium et al. 2019) might then be capable of detecting extragalactic CCSNe.
A primary limiting factor for the detection of CCSNe in the TeV range is the distance, which determines the flux reaching the observer. The flux is further expected to decrease inversely with time (Tatischeff 2009). The γ-ray signal should also be degraded by the interaction of gamma-rays with the low-energy photons from the SN photosphere (Gould & Schréder 1966, 1967) during the first stages of the stellar outer envelope expansion, resulting in the production of electron–positron pairs. This two-photon annihilation process has been discussed in various astrophysical contexts, generally under the assumption of isotropy (Aharonian, Khangulyan & Costamante 2008; Tatischeff 2009; Murase et al. 2014; Wang, Huang & Li 2019). None of these calculations took into account the anisotropy inherent in the problem, or the time of flight of the photons from the photosphere. The calculations carried out by Cristofari et al. (2020b), and outlined below, include some important improvements that considerably increase the accuracy, and enhance the validity, of the solutions: The time retardation effects of the SN photosphere, the Doppler effect over the frequency space, the full anisotropic calculation of the two-photon annihilation process, and a detailed modelling of the time evolution of both the forward shock and the SN photosphere. This more careful treatment of the problem, which takes into account the diverging evolution of the radius of the SN photosphere and the forward shock, can produce results that substantially differ from the isotropic assumption, as illustrated in Cristofari et al. (2020b) in the case of SN 1993J.
SN 1993J was discovered and well-monitored from the optical to radio range since the first days after its explosion in the Galaxy M81 (NGC 3031) (Ripero et al. 1993). It was classified as a Type IIb SN (Maund et al. 2004) due to the initial detection of H in the spectrum that later disappeared. The progenitor star was found to be in the range 13–20 M⊙ (Van Dyk et al. 2005; Marcaide et al. 2009). The close distance, and the high inferred mass-loss rate, makes it an appealing candidate for the detection of an extragalactic SN in the gamma-ray range.
Type IIb SNe occur at a relatively low rate, comprising ≲ 5 per cent of the total core-collapse SNe (Smartt 2009). The bulk of CCSNe expand in a lower density surrounding medium. The largest fraction of CCSNe are the Type II-P SNe, accounting for typically ∼40–50 per cent of CCSNe. Here, the ‘P’ stands for plateau, since these SNe show a plateau in their optical light curve lasting for several months. The high frequency means that the likelihood of a Type II-P SN being detected in an optical survey of nearby SNe is much higher. In this paper, we therefore, focus our attention on the expected gamma-ray signal from Type II-P SNe in the ∼30 d following the explosion of the SN where the unabsorbed flux is expected to be the highest (Tatischeff 2009; Marcowith et al. 2018).
As we will show in this paper, the predicted flux is very sensitive to the SN parameters. Those affecting the gamma-ray flux can vary over a wide range, which can lead to large variations in the flux itself. It is therefore important to study the expected flux over a plausible range of parameters. We explore the parameter space of SN quantities that can possibly affect the gamma-ray signal: The total explosion energy of the SN, the ejecta mass, the mass-loss rate of the wind, and radius and temperature of the progenitor star. Their individual and collective effects on the absorption of the gamma-ray signal are investigated. The calculation of the time-dependent opacity is carried out in a manner analogous to the one presented in Cristofari et al. (2020b).
The lay-out of the paper is as follows: In Section 2, we describe the dynamics of the SN photosphere and SN shock, in Section 3, we describe the calculation of the gamma-ray signal including the gamma-ray attenuation by the two-photon annihilation process, in Section 4, we present our results as a function of the parameters describing the stellar progenitor and the SN explosion, and we conclude in Section 5.
2 EVOLUTION OF THE SUPERNOVA SHOCK AND PHOTOSPHERE
Fig. 1 shows the evolution of the photospheric temperature and luminosity. The latter quantity is calculated as |$L_{\rm ph} = 4 \pi r_{\rm ph}^2 \sigma _{\rm SB} T_{\rm ph}^4$|, where σSB is the Stefan–Boltzmann constant.
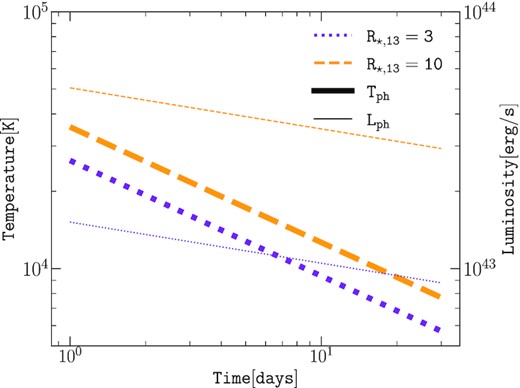
Time evolution of the photospheric temperature (thick lines) and luminosity (thin lines) in the case of R⋆ = 3 × 1013 cm (violet dotted) and R⋆ = 1014 cm (orange dashed).ESN = 1051 erg, Mej = 4 M⊙.
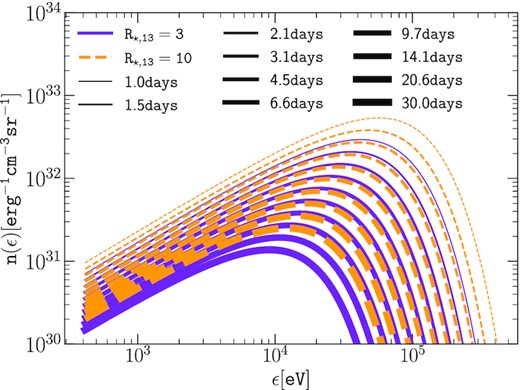
Spectral energy distribution of the low energy photons (equation 4) emitted by the photosphere for R⋆ = 3 × 1013 cm (violet solid) and R⋆ = 1014 cm (orange dashed). The increased thickness follows the time evolution.
Only the acceleration of particles at the forward shock is considered here, so that the effects of the reverse shock are not presently included (Ellison, Decourchelle & Ballet 2005; Telezhinsky, Dwarkadas & Pohl 2012; Leahy & Williams 2017). Indeed, the reverse shock is typically propagating through higher densities, with a lower velocity so that the maximum energy is lower (Telezhinsky et al. 2012). In case particle acceleration at the reverse shock would produce gamma-rays: The lower velocity of the shock tends to reduce the maximum energy of accelerated particles, but the higher density in which the shock is propagating can lead to an enhanced production of gamma-rays but also stronger losses through pp collisions. Therefore, all in all any acceleration at the reverse shock would increase the total gamma-ray signal and this makes our approach a lower limit on the estimate of gamma-rays from Type II-P.
Equation (5) describes the shock evolution provided that n > 5, with n the slope of the density profile of the envelope of the exploding star. For a typical Type II-P SNe, n = 10, ζ = 1.03, ξ = 0.477, s = 2, and α = 4.56. The corresponding shock velocity is given by the derivative vsh = dRsh/dt.
Deviations from the value n = 10 have been proposed for outer SN ejecta in RSGs, such as Matzner & McKee (1999) fixing it at n = 11.73.
We illustrate in Fig. 3 the evolution of rph and Rsh during the first 30 d after the SN explosion, for typical values of the mass-loss rate |$\dot{M}_{\rm w}=10^{-6}$| M⊙ yr−1 and ejecta mass Mej = 2, 4, and 10 M⊙.
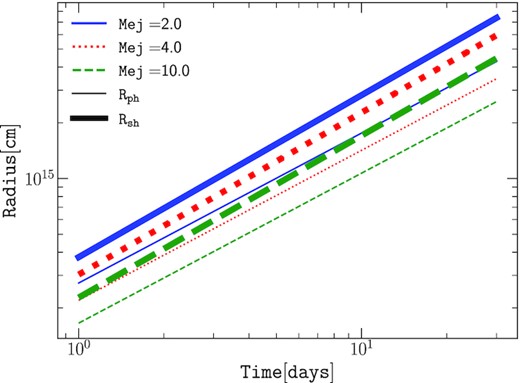
Time evolution of the shock (thick) and photospheric (thin) radii, for an ejecta mass Mej = 2, 4, 10 M⊙ (blue solid, red dotted, and green dashed, respectively), and a mass-loss rate |$\dot{M}_{\rm w}=10^{-6}$| M⊙ yr−1.
3 GAMMA-RAY EMISSION
3.1 Unattenuated gamma-ray flux
3.2 Pair production gamma-ray attenuated flux
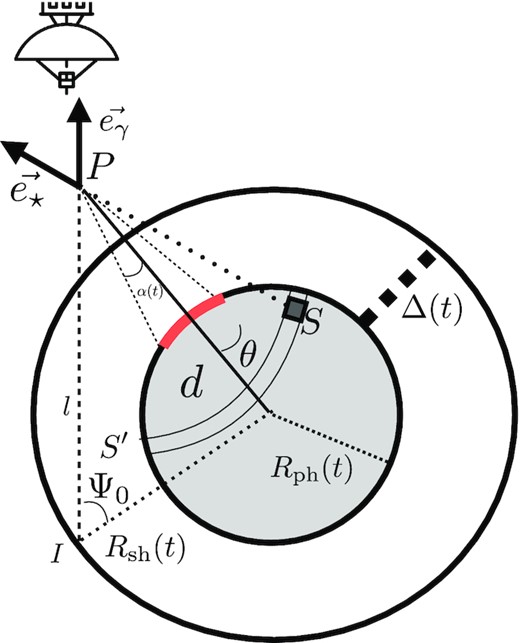
2D diagram of the physical problem. The photosphere (grey inner disc) emits photons at (S) which interacts at (P) with gamma-ray photons emitted at (I). The area marked by the thick red line represents the region of origin of low-energy photons which can interact with a gamma-ray emitted at (I) (see the text). The red (thick) region of the photosphere illustrates that only a fraction of the photosphere, emitting photons at times t1 will interact with gamma-rays in P at a time t0.
4 RESULTS AND DISCUSSION
The model for the gamma-ray emission of a typical Type II-P CCSN adopted here depends on a few physical parameters: the total explosion energy ESN, the mass-loss rate of the pre–SN wind |$\dot{M}_{\rm w}$|, the wind terminal velocity vw, the ejecta mass Mej and the radius of the progenitor star R⋆. The influence of these parameters on the gamma-ray signal is discussed next.
RSG stars can have mass-loss rates from about 10−8to 10|$^{-4} \,\mathrm{ M}_{\odot }$| yr−1 (Mauron & Josselin 2011). However, it had often been noted that the progenitors of II-Ps appeared to arise from RSG stars that were lower than about 20 |$\mathrm{ M}_{\odot }$|. This was first quantified by Smartt (2009) using optically identified SNe. Dwarkadas (2014) reached a similar conclusion using the X-ray light curves of SNe. A larger data set allowed Smartt (2015) to consolidate their early arguments. In general, it appears that while RSG stars may have higher mass-loss rates, Type II-P SNe appear to arise from the lower end of the RSG mass function. And since the mass-loss rates are directly proportional to the RSG mass (Mauron & Josselin 2011), the II-Ps generally expand in a medium with lower mass-loss rates. Therefore, we have assumed that II-P SNe expand in a medium with mass-loss rates |$\dot{M}_{\rm w}=10^{-8}, 10^{-7}, 10^{-6}$|, and 10−5 M⊙ yr−1 respectively. We discuss the possibility of higher mass loss rates in section 5.
In Figs 5 and 6, we explore the parameter space and illustrate our results. Fig. 5 also includes a comparison to prior results. For display purposes, we only show the gamma-ray fluxes obtained under the approximation of an homogeneous source (Wang et al. 2019) for fluxes integrated above 100 GeV, where the difference is the greatest. We start by showing, for a fixed ejecta mass Mej = 4 M⊙, the effect of various mass-loss rates. The total explosion energy is kept equal to ESN = 1051 erg. As written in equation (10), the unabsorbed gamma-ray flux is expected to scale as |$\dot{M}_{\rm w}^2$|. However, the scaling of the gamma-gamma opacity with the mass-loss rate is not straightforward. If rph and Tph are not functions of |$\dot{M}_{\rm w}$|, Rsh, it is scaling as |$\propto \dot{M}_{\rm w}^{-0.125}$| (assuming n = 10). The integrated flux for photons of energy greater than 100 GeV and 1 TeV are shown. Considering photons of energy greater than 500 GeV or 5 TeV lead to a gamma-ray signal of somewhat similar shape to the one above 1 TeV. The plots illustrate the importance of the gamma-gamma attenuation at early time (in the first 10–20 d), as expected, when the photosphere and the shock are the closest, and the photosphere luminosity is the highest. The attenuation is potentially reaching 20 orders of magnitude, and the signal progressively returns to the unattenuated curve.
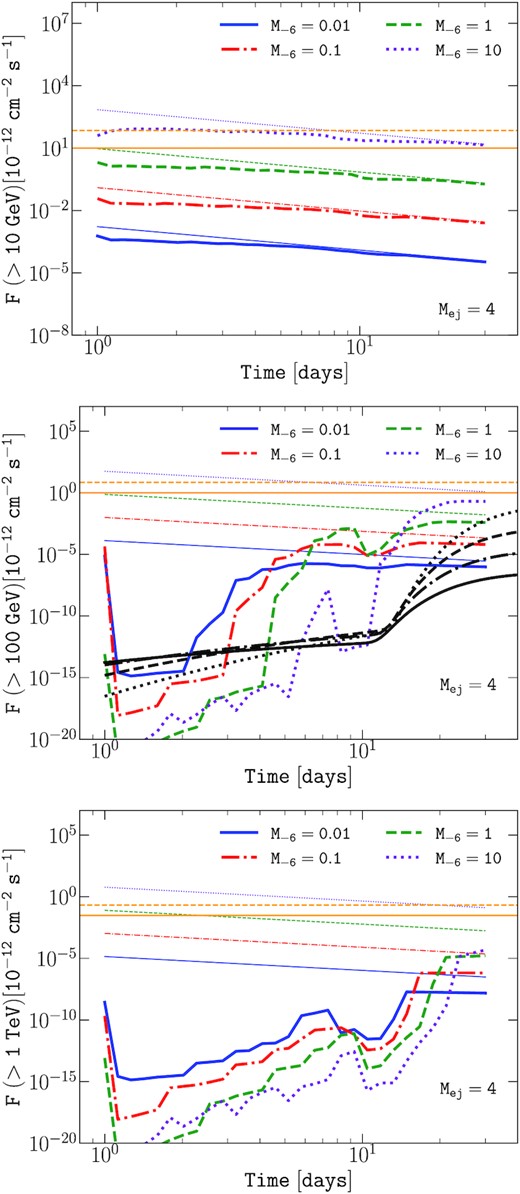
Time evolution of the integrated photon flux above 10 GeV (top), 100 GeV (middle), and 1 TeV (bottom). The source distance is D = 1 Mpc, the ejecta mass is Mej = 4 M⊙, the progenitor radius is R⋆ = 3 × 1013 cm. The mass-loss rate of the wind is |$\dot{M}_{\rm w}=10^{-8}, 10^{-7}, 10^{-6}$|, and 10−5 M⊙ yr−1, is shown as solid (blue), dot–dashed (red), dashed (green), and dotted (violet) lines, respectively. The corresponding unattenuated fluxes are shown as thin lines. The typical sensitivity of CTA for 50 h (solid orange horizontal line) and 2 h (dashed orange horizontal line) is shown as a guiding-eye for the reader (Fioretti, Bulgarelli & Schüssler 2016). On the middle panel, we additionally plot (black lines) the corresponding gamma-ray fluxes obtained under the approximation of an homogeneous source as in Wang et al. (2019).
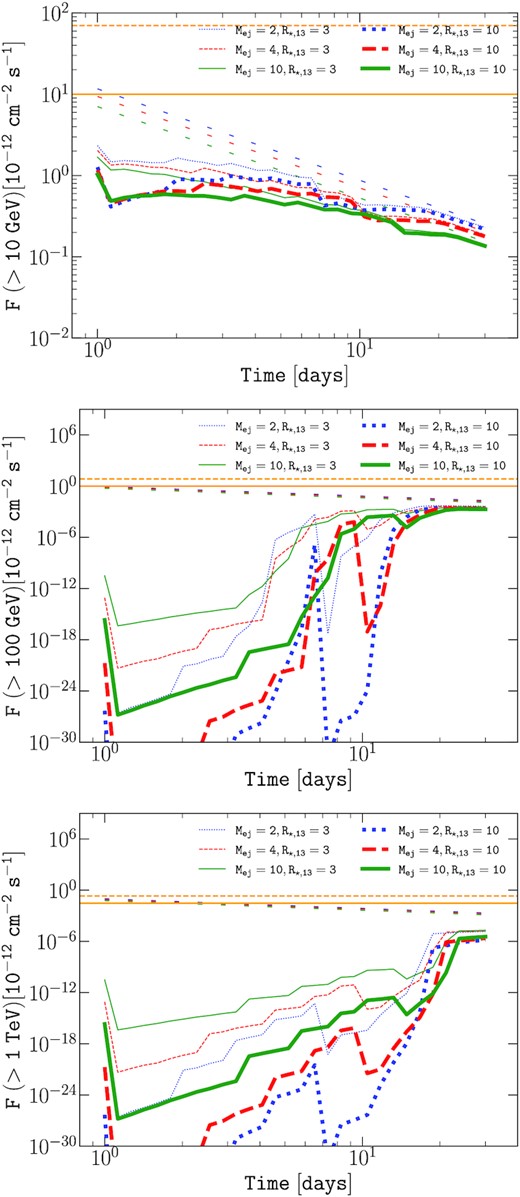
Time evolution of the integrated photon flux above 10 GeV (top), 100 GeV (middle), and 1 TeV (bottom). The source distance is D = 1 Mpc, the mass-loss rate of the RSG wind is |$\dot{M}_{\rm w}=10^{-6}$| M⊙ yr−1. The results for an ejecta mass Mej = 2, 4, and 10 M⊙ are shown as dotted (blue), dashed (red), solid (green) for a progenitor radius R⋆ = 3 × 1013 cm (thin) and R⋆ = 1014 cm (thick) lines. The corresponding unattenuated fluxes are shown as loosely dotted lines. The typical sensitivity of CTA for 50 h (solid orange horizontal line) and 2 h (dashed orange horizontal line) is shown as a guiding-eye for the reader (Fioretti et al. 2016).
Figs 5 and 6 also exhibit a second dip in the attenuation, at ≈10−15 d, visible on all plots, and especially for the flux above 100 GeV for the |$\dot{M}_{\rm w}=10^{-5}$| M⊙ yr−1 case (violet dotted line). This feature can be explained as follows.
The importance of the gamma-gamma process depends essentially on the number density of photons (gamma-ray photons and low energy photons) in interaction, as well as their energy because of the threshold to pair production. Let us for now only consider one sphere emitting photons, for example the photosphere, of radius Rph(t). To reach a point (P) located at a given distance h from the photosphere, the first photons emitted at a time t0 at which the photosphere radius was Rph(t0) will travel during a time t1 = h/c. At later time, more photons keep arriving at (P), emitted at different times t0* (and travelling for shorter time t1*) since the photosphere radius is expanding, and therefore, more photons emitted at various times can reach the point (P). This results, in (P), in an increasing number of photons (and thus an increasing luminosity from photons from the photosphere) as α(t) increases (see Fig. 4), until α reaches a maximum value αmax(t) (corresponding to a photon emitted at the minimum |$t_0^{\star }$|). Therefore, at any distance from the photosphere, the number of photons is increasing until reaching a maximum value: The closer points see a quicker increase, and the farther points see a delayed and slower increase.
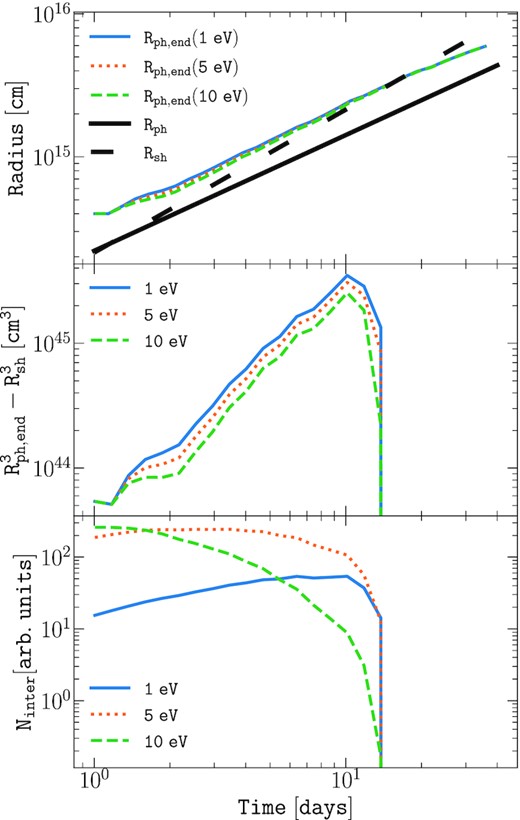
Time evolution of Rph, end(top panel), of the interaction volume |$R_{\rm ph,end}^3- R_{\rm sh}^3$| (middle panel), and of the associated number of photons Ninter inside the interaction volume (bottom panel), for photons of energy 1, 5, and 10 eV (blue solid, yellow dotted, and green dashed): ESN = 1051 erg, Mej = 4 M⊙, |$\dot{M}=10^{-6}$| M⊙ yr−1, and R⋆ = 1014 cm.
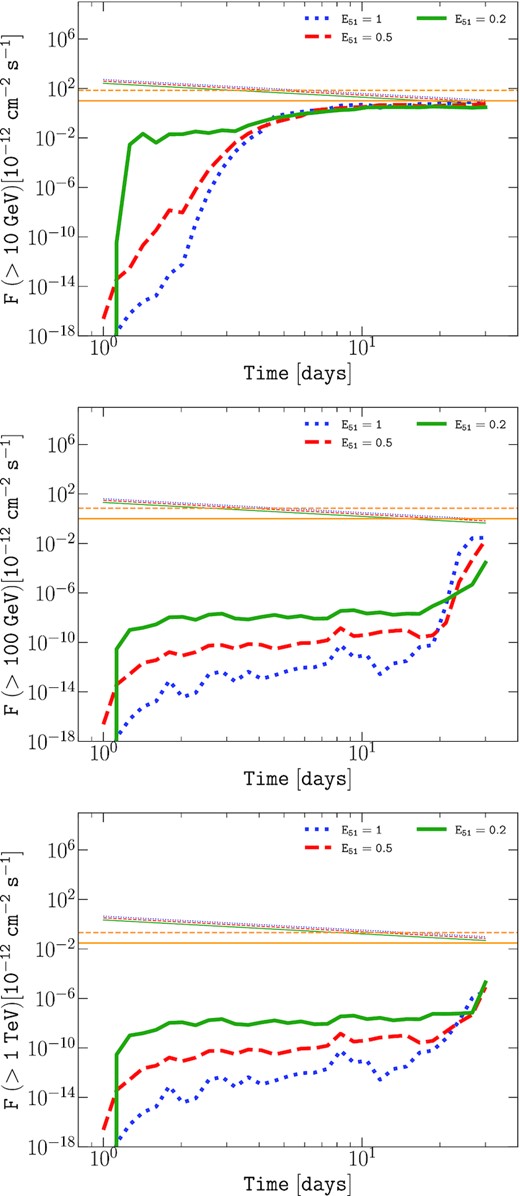
Time evolution of the integrated photon flux above 10 GeV (top), 100 GeV (middle), and 1 TeV (bottom). The mass-loss rate of the RSG wind is |$\dot{M}_{\rm w}=10^{-5}$| M⊙ yr−1, the radius of the progenitor is R⋆ = 3 × 1013 cm and the ejecta mass Mej = 10 M⊙. The total explosion energy of ESN = 1051, 0.5 × 1051, and 0.2 × 1051 erg correspond to the green solid, blue dotted, and red dashed curves, respectively. The typical sensitivity of CTA for 50 h (solid orange horizontal line) and 2 h (dashed orange horizontal line) is shown as a guiding-eye for the reader (Fioretti et al. 2016).
In Fig. 6, we illustrate the effect of a change of temperature (and thus luminosity) of the photosphere by considering two different radii of the progenitor star R⋆ = 3 × 10¹³ and 1014 cm. The temporal evolution of the temperature and luminosity is shown in Fig. 1 and the evolution of the black–body distribution is illustrated in Fig. 2. The resulting gamma-ray signal is shown in Fig. 6, illustrating that the increased temperature and luminosity lead to an enhancement of the attenuation (visible for all ejecta mass considered). Moreover, the second attenuation dip featured at ∼10 d discussed above is more pronounced as the photosphere luminosity increases (i.e. as the energy available in the overlapping interaction volume Vinter increases). In addition, the effect of the ejecta mass is shown, showing that increasing ejecta mass tends to lower the level of the attenuation (the effect is especially visible for higher temperatures of the photosphere).
Recent works (see e.g. Barker et al. 2021) mentioned that for high mass-loss rates, the explosion energy of SNe arising from stars of mass ≲ 20 |$\mathrm{ M}_{\odot }$| can be less than 1051 erg. Interestingly, it is possible to understand the effect of a lower total explosion energy by looking at equations (2), (3), and (8). The temperature is very weakly dependent on the total explosion energy ESN. The photospheric radius and shock radius scale with ESN in the same way |$\propto E_{\rm SN}^{0.41}$|. This dependency is therefore analogous to the dependency on the mass of the ejecta Mej: rph and Rsh both roughly scale as |$\propto M_{\rm ej}^{-0.25}$|, and thus is affecting the shock radius and photospheric in the same proportion. In other words, for instance, the effect of decreasing ESN by a factor of 3, would roughly decrease rph and Rsh by a factor ≈(1/3)0.41 ≈ 0.65, equivalent to an increase of the ejecta mass by a factor ≈0.65−1/0.25 ≈ 5.6. The dependence of the absorption on ESN is illustrated in Fig. 8.
5 CONCLUSIONS
We have estimated the gamma-ray signal emerging from typical Type II-P CCSNe in the first month after the SN explosion, taking into account non-isotropic time-dependent attenuation due to pair production. After a few tens of days the gamma-ray emission is similar to the unabsorbed solution. Our results can be summarized as follows.
For typical extragalactic CCSNe, the gamma-ray signal, after inclusion of the two-photon annihilation process, is expected to be significantly lower than the typical sensitivity of Cherenkov instruments for objects located at 1 Mpc. This indicates that mostly nearby Type II-P SNe, typically exploding in our Galaxy or in the Magellanic Clouds, are expected to be detectable by next generation instruments, such as CTA, although a detailed calculation using the last CTA sensitivity is necessary before providing a more precise limit. Type II-P SNe make up the major fraction of CCSNe. It is worth noting at this stage that our calculation of the pair production does not account for the possibility to produce saturated pair cascades, i.e. to produce several generations of electron–positron pairs in the radiation field produced by the previous generation. Together with the possibility of gamma-ray emission at the reverse shock, these different generation of pairs can add up some gamma-ray emission, especially in the GeV range. So our calculation has to be seen as conservative. The pair cascade process issue will be addressed in a future work. Finally, Type II-P SNe are generally interacting with a relatively diluted medium. A study of SN types that evolve in a higher-density medium (such as some Type IIb and IIn SNe) will probably greatly improve chances of detection in the gamma-ray range.
Several authors have found that, in order to fit the initial rise and the peak of the optical light curves of Type II-P SNe, they must have experienced a very high mass-loss rate of up to 1 |$\mathrm{ M}_{\odot }$| yr−1 in the very last few years before the star collapsed to become a SN (Morozova, Piro & Valenti 2017, 2018; Yaron et al. 2017; Förster et al. 2018; Ricks & Dwarkadas 2019). These high mass-loss rates in many cases occur in only the last 2–3 yr before core-collapse. If we assume that they are due to RSG winds with a wind velocity of typically 10 km s−1, then the SN shock would be expected to cross this high-density region within a few days or ≲ 10 d, depending on the progenitor activity. This enhanced mass-loss rate could delay the onset of particle acceleration if the wind is optically thick. Indeed, particle acceleration is expected to start around SN shock breakout at an optical depth τ ≈ c/vsh, when the radiation-mediated shock stalls and is replaced with a collisionless shock. In the case of an optically thick wind, this would occur in the wind at a radius Rbr > R⋆, rather than at the surface of the star. Assuming a spherical wind with opacity κ, and with density |$\rho (r) = \dot{M}_{\rm w} / (4 \pi v_{\rm w} r^2)$| between r = R⋆ and r = Rw and negligible beyond, the optical depth is |$\tau (r) = \kappa \int _r^{R_{\rm w}} \rho \text{d}r$|, and Rbr then satisfies: |$R_{\rm br}^{-1} \approx R_{\rm w}^{-1} + 4 \pi c v_{\rm w} / \kappa \dot{M}_{\rm w} v_{\rm s}$| (see also Chevalier & Irwin 2011). For large mass-loss rates, such that |$R_{\rm w} \lt \kappa \dot{M}_{\rm w} v_{\rm s} / 4 \pi c v_{\rm w}$|, the shock breakout and the onset of particle acceleration would occur at Rbr ≈ Rw. For more moderate mass-loss rates, such that |$R_{\rm w} \gt \kappa \dot{M}_{\rm w} v_{\rm s} / 4 \pi c v_{\rm w}$|, this would occur at |$R_{\rm br} \approx \kappa \dot{M}_{\rm w} v_{\rm s} / 4 \pi c v_{\rm w}$|. Assuming that κ is dominated by Thomson scattering, i.e. κ = σt/mp where σt is the Thomson cross-section, one finds: |$R_{\rm br} \approx 10^{14}\, {\rm cm} (\dot{M}_{\rm w}/5 \cdot 10^{-4}\, {\rm M}_\odot {\rm yr}^{-1}) (v_{\rm sh}/0.1\, c) (v_{\rm w}/10\, {\rm km \, s^{-1}})^{-1}$|. If the wind is optically thick, Rbr > R⋆, and particle acceleration can start at r ≳ Rbr when conditions are favourable, see Giacinti & Bell (2015) for specific cases where particle acceleration could start at r < Rbr. On the contrary, if Rbr < R⋆, the wind is, in fact, optically thin: The shock breakout occurs at Rbr = R⋆, and particle acceleration may start at r ≳ R⋆. In case the particle acceleration onset is not much delayed, enhanced mass-loss rates should conversely lead to more efficient particle acceleration and possibly enhanced gamma-ray emission. In effect, higher |$\dot{M}/v_{\rm w}$| ratios produce higher CR-driven instability growth rates (Marcowith et al. 2018). Ultimately, higher magnetic field strengths should be obtained at the shock front. This should produce higher CR energies eventually reaching the CR knee within a week after the shock breakout (Inoue et al. 2021).
SN 1987A, the closest SNe to us in over 300 yr, deserves special mention here. Sometimes this is considered similar to the II-P SNe, or treated as Type IIpeculiar. However, its progenitor was a blue supergiant, not an RSG (McCray & Fransson 2016). The SN shock wave initially evolved in a very low density blue supergiant wind with a mass-loss rate |$\dot{M} \sim 10^{-9} - 10^{-8}$| M⊙ yr−1 (Chevalier & Dwarkadas 1995; Lundqvist 1999; Dewey et al. 2012), lower than the SNe considered herein. After a few years, the SN interacted with higher density circumstellar material formed by the blue supergiant wind sweeping up the RSG wind from a prior epoch. This interaction could lead to a potentially significant gamma-ray signal (Duffy, Ball & Kirk 1995; Berezhko, Ksenofontov & Völk 2011; Dwarkadas 2013; Berezhko, Ksenofontov & Völk 2015). It has not been detected by current Imaging Atmospheric Cherenkov Telescopes (H. E. S. S. Collaboration 2015), but will be a target for the upcoming CTA. The treatment herein is not applicable to SN 1987A, since the complicated structure of the surrounding medium does not make it amenable to an analytic treatment.
Let us however note that a typical Type II-P SN with a mass-loss rate ≳ 10−6 M⊙ yr−1, located at a distance comparable to the one of SN1987A (∼51 kpc) would a priori be detectable by next generation instruments such as CTA, this can be seen by rescaling with the distance results of Fig. 6.
The simple parametrization adopted here, for the shock evolution, and photospheric evolution, allows to study the gamma-gamma absorption and discuss the importance of the physical parameters (mass of the ejecta, mass-loss rate of the RSG wind in which the SN explodes, temperature of the photosphere, total explosion energy, opacity, radius of the exploding star). We especially illustrate how changes by a factor of ∼2 − 3 on some parameters (e.g. the stellar radius, and thus on the expected temperature) can lead to dramatic changes in the level of absorption. The time-integration of absorption effects can in some situations lead to detectable features in the gamma-ray signal, such as when the shock radius evolves very close to the photosphere (e.g. |$\dot{M_{\rm w}} \sim 10^{-5}$| M⊙ yr−1). Finally, we illustrate that the largest gamma-ray fluxes from Type II-P CCSNe in the first days after the SN explosion, are expected when |$\dot{M_{\rm w}}$|, Mej are the highest, ESN, and R⋆ are the smallest, and could potentially be detected by next generation instruments, such as CTA (Cherenkov Telescope Array Consortium et al. 2019), the Southern Wide-field Gamma-ray Observatory (Albert et al. 2019), or the Large High Altitude Air Shower Observatory (Bai et al. 2019).
ACKNOWLEDGEMENTS
VVD is supported by National Science Foundation grant 1911061 awarded to the University of Chicago (PI: Vikram Dwarkadas). The research activity of EP was supported by Villum Fonden (project number 18994) and by the European Union’s Horizon 2020 research and innovation program under the Marie Sklodowska-Curie grant agreement number 847523 ‘INTERACTIONS’. PC acknowledges support from the Paris Region Fellowship under the Marie Sklodowska-Curie agreement (project GLADIATOR).
DATA AVAILABILITY
No data has been analysed or produced in this work.


