


ABSTRACT
Feedback processes are expected to shape galaxy evolution by ejecting gas from galaxies and their associated dark matter haloes, and also by preventing diffuse gas from ever being accreted. We present predictions from the eaglesimulation project for the mass budgets associated with ‘ejected’ and ‘prevented’ gas, as well as for ejected metals. We find that most of the baryons that are associated with haloes of mass |$10^{11} \lt M_{200} \, /\mathrm{M_\odot } \lt 10^{13}$| at z = 0 have been ejected beyond the virial radius after having been accreted. When the gas ejected from satellites (and their progenitors) is accounted for, the combined ejected mass represents half of the total baryon budget even in the most massive simulated galaxy clusters (|$M_{200} \approx 10^{14.5} \, \mathrm{M_\odot }$|), with the consequence that the total baryon budget exceeds the cosmic average if ejected gas is included. We find that gas is only prevented from being accreted on to haloes for |$M_{200} \lt 10^{12} \, \mathrm{M_\odot }$|, and that this component accounts for about half the total baryon budget for |$M_{200} \lt 10^{11} \, \mathrm{M_\odot }$|, with ejected gas making up most of the remaining half. For metals, most of the mass that is not locked into stars has been ejected beyond the virial radius, at least for |$M_{200} \lt 10^{13} \, \mathrm{M_\odot }$|. Finally, within the virial radius we find that most of the mass in the circumgalactic medium (CGM) has not passed through the ISM of a progenitor galaxy, for all halo masses and redshifts. About half of the CGM within half the virial radius has passed through the ISM in the past however.
1 INTRODUCTION
Within the context of the working Λ cold dark matter (ΛCDM) model, galaxy formation is thought to trace the formation of dark matter haloes. Gas accretion is expected to approximately trace dark matter accretion at the halo virial radius, and thereafter the gas is thought to condense at the halo center by virtue of energy dissipation via radiative cooling (e.g. White & Rees 1978). Feedback processes then regulate the formation of stars locally within the interstellar medium, eject gas back into (and beyond) the halo, and modulate the infall of gas on to the interstellar medium (ISM; and possibly also on to the halo). Many authors have studied these effects using cosmological zoom-in simulations (e.g. Übler et al. 2014; Muratov et al. 2015; Christensen et al. 2016; Anglés-Alcázar et al. 2017), as well as large-volume cosmological simulations (e.g. Oppenheimer et al. 2010; Faucher-Giguère, Kereš & Ma 2011; van de Voort et al. 2011a; Correa et al. 2018; Nelson et al. 2019; Mitchell & Schaye 2021).
Recently, Mitchell, Schaye & Bower (2020b), Mitchell et al. (2020a) presented a complete set of measurements of inflow and outflow rates of gas on to/from both haloes and galaxies in the eagle simulations (Schaye et al. 2015). Here, we supplement this information by presenting instead how the masses in different galaxy or halo components are affected by these processes. In particular, we address questions such as how many baryons have been ejected from haloes, how much gas was prevented from being accreted on to haloes in the first place, and how much of the circumgalactic medium (CGM) has previously been part of the ISM of a galaxy. We acknowledge that these predictions are model-dependent and are not easily tested by observations; rather our intention is to provide a pedagogical overview of how gas is accreted on to and ejected from galaxies and haloes, providing a physically viable theoretical scenario for how this might occur in reality. This in turn can be compared to other state-of-the-art simulations in the future.
Some of these questions have already been addressed directly with other cosmological simulations, or have been studied using simplified analytic modelling. Hafen et al. (2019) analyse the FIRE cosmological zoom-in simulations, quantifying how much of the CGM is comprised of gas that was ejected from the ISM of galaxies, and how much of that gas was ejected from the main-progenitor galaxy. They find that most of the mass in the CGM has not been ejected from the ISM in the past (and is labelled ‘IGM accretion’). They also find that the origin of ISM-processed CGM is dominated by the main progenitor galaxy for low-mass haloes (|$M_{\mathrm{h}} \lt 10^{11} \, \mathrm{M_\odot }$|), but that the main progenitor (labelled ‘Wind’) and satellite galaxies (labelled ‘Satellite Wind’) provide comparable contributions for |$M_{\mathrm{h}} \sim 10^{12} \, \mathrm{M_\odot }$|. These findings are qualitatively consistent with what we find in eagle, although we find that the halo mass scale at which the ‘satellite wind’ component is important is at higher halo masses (|$M_{200} \gtrsim 10^{13} \, \mathrm{M_\odot }$|). This is possibly because eagle(unlike FIRE) includes AGN feedback that drives outflows in |$M_{200} \sim 10^{12} \, \mathrm{M_\odot }$| haloes, increasing the relative importance of outflows from the main progenitor in this mass range (e.g. Davies et al. 2020; Oppenheimer et al. 2020; Mitchell et al. 2020a). At this mass scale, eagle also predicts significantly lower total baryonic masses within the virial radius than FIRE, which we expect for the same reason.
With a very different modelling approach, Afruni, Fraternali & Pezzulli (2021) attempt to reproduce observations of cool circumgalactic gas around local star-forming galaxies using a simple model for how outflows are launched from the ISM and then propagate through the CGM. They find that such a model is not naturally capable of reproducing the observed radial and velocity distributions of cool circumgalactic gas clouds, and conclude that much of the cool CGM must have been accreted from the IGM, without having been ejected from the central galaxy. These conclusions are broadly consistent with the measurements from eagle that we present here.
The layout of this paper is follows. We provide details of the simulations and analysis methodology in Section 2, our results are presented in Section 3, and we summarize and present our conclusions in Section 4.
2 METHODS
2.1 Simulation
Our analysis is performed on the eagleproject (Crain et al. 2015; Schaye et al. 2015), which has been publicly released (McAlpine et al. 2016). eagle is a suite of cosmological simulations, spanning a range of box sizes, resolutions, and model variations. eagle uses a modified version of the gadget-3code (last described in Springel 2005) to solve the equations of gravity and hydrodynamics, employing smoothed particle hydrodynamics (SPH). A ΛCDM cosmological model is assumed, with parameters set following Planck Collaboration XVI (2014). Simple subgrid models are included to model star formation and stellar evolution, supermassive black hole (SMBH) formation and evolution, feedback from stars and active galactic nuclei (AGN), and radiative cooling and heating.
We use exclusively simulations run with the reference eagle model (see Schaye et al. 2015, for details), which was calibrated to be consistent with observed star formation thresholds and kpc-scale efficiencies, and to broadly reproduce the observationally inferred galaxy stellar mass function, trends of galaxy size with stellar mass, and of SMBH mass with galaxy stellar mass, all at z ≈ 0. Most of our analysis is performed on the largest available |$(100 \, \mathrm{Mpc})^3$|-volume simulation, run with 15043 particles in both dark matter and gas, with a particle mass of |$9.7 \times 10^6 \, \mathrm{M_\odot }$| for dark matter, initial gas particle mass of |$1.8 \times 10^6 \, \mathrm{M_\odot }$|, and with maximum physical gravitational softening of |$0.7 \, \mathrm{kpc}$| (for both dark matter, gas, and also stars and black holes).
2.2 Measurements
Our analysis is based on following Lagrangian SPH gas particles across simulation outputs, keeping track of which particles are accreted and then ejected from specific haloes and galaxies. This information is passed forward in time from subhalo progenitors to descendants, merging the lists of ejected particle identifiers when two subhaloes merge. Accretion or ejection from haloes is defined via a simple spherical radial cut at the halo virial radius, which we define as R200, the radius enclosing a mean overdensity that is 200 times the critical density of the Universe at a given redshift. Accretion or ejection from galaxies is defined based on whether particles are considered part of the ISM. In turn, particles are considered part of the ISM if they pass the eaglestar formation threshold based on density, temperature, and metallicity (capturing the transition from the warm, atomic to the cold, molecular gas phase, as modelled by Schaye 2004), or that otherwise have total hydrogen number density |$n_{\mathrm{H}} \gt 0.01 \, \mathrm{cm^{-3}}$| and are within |$0.5 \, \mathrm{dex}$| of the temperature floor corresponding to the equation of state imposed on the unresolved ISM (Schaye & Dalla Vecchia 2008; Mitchell et al. 2020a), which corresponds roughly to the warm atomic phase (e.g. Rahmati et al. 2013), above the density threshold for effective self-shielding from the far-ultraviolet radiation field. With this definition, star-forming gas generally makes up the majority of the ISM in eagle, with the additional non-star-forming selection picking out additional neutral gas in the outskirts. All of these measurements are described and motivated fully in Mitchell et al. (2020b,a), including details of (sub)halo definitions and merger trees.
3 RESULTS
3.1 Baryonic mass budgets
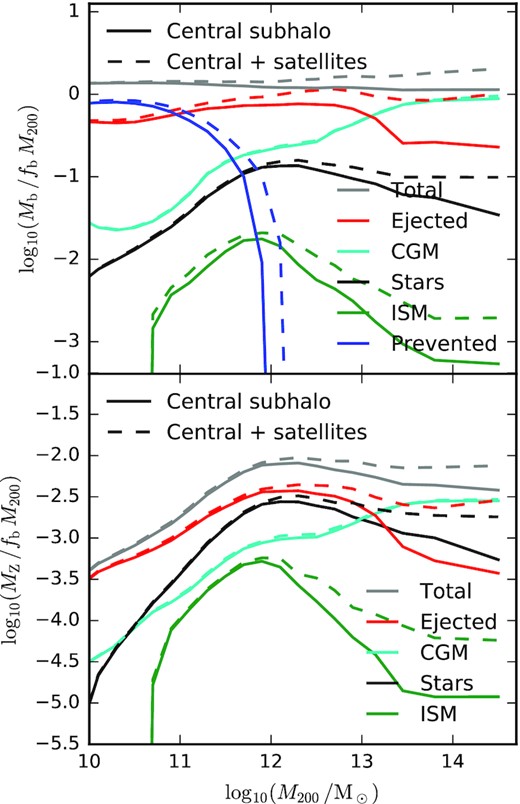
The median total baryonic mass (top panel) and metal mass (bottom panel) associated with the haloes of central galaxies at z = 0, normalized by |$\frac{\Omega _{\mathrm{b}}}{\Omega _{\mathrm{m}}} \, M_{200}$| and plotted as a function of halo mass (M200). Line colours indicate the mass in different components, including the CGM (cyan), ISM (green), stars (black), gas that has been ejected beyond R200 (red), and gas that we estimate has been prevented from being accreted due to feedback effects (blue). Grey lines show the total mass, adding together each of these components. Solid lines show masses associated with the central subhalo, whereas dashed lines also include the masses associated with satellite subhaloes. For |$10^{11} \lt M_{200} \, / \mathrm{M_\odot } \lt 10^{13}$|, most of the baryons that have ever been accreted on to haloes have since been ejected and reside outside R200 by z = 0. Preventative feedback is important for |$M_{200} \lt 10^{12} \, \mathrm{M_\odot }$|. About half of the metals produced by stellar evolution are then ejected beyond R200, apart from in very massive haloes.
Masses are normalized by the expected baryonic mass within R200 (i.e. |$f_{\mathrm{b}} M_{200} \equiv \frac{\Omega _{\mathrm{b}}}{\Omega _{\mathrm{m}}} \, M_{200}$|), assuming accretion or ejection of gas exactly traces that of dark matter. Solid and dashed lines show baryonic mass budgets that exclude and include, respectively, the mass associated with satellite subhaloes. If satellites are included (dashed lines), then the gas that has been ejected from (or prevented from being accreted on to) any progenitor of the current satellite subhalo is included. Note that the M200 normalization in the denominator is the same for both dashed and solid lines, and always includes all mass within R200.
Finally, we also show the sum of all the plotted baryonic components (including the prevented component, Mprev) as the ‘total’ mass (grey lines). In general, the total mass always at least slightly exceeds the basic expectation set by fbM200. This is primarily because M200 by definition does not include any gas that is ejected beyond R200 after having been accreted. We note also that if we include satellites, then the total mass (dashed grey line) increases weakly but monotonically with increasing halo mass, at least for |$M_{200} \gtrapprox 10^{12} \, \mathrm{M_\odot }$|. This is qualitatively consistent with our findings in Mitchell et al. (2020a), where we found that in contrast to preventative feedback, massive haloes actually accrete slightly more than their expected share of baryons, with the excess growing fractionally with increasing halo mass. This is presumably connected to enhanced radiative cooling rates associated with metal-enriched large-scale outflows. Note, however, that the baryon fraction within R200 (so excluding ejected gas) is always equal or less than the cosmic baryon fraction.
Splitting into the various components, the ratio of galaxy stellar mass to halo mass peaks at the characteristic halo mass |$\approx 10^{12} \, \mathrm{M_\odot }$|. The strength of this peak depends sensitively on whether satellites are included in the stellar mass (as they are for the halo mass by convention), and also whether stellar mass is defined within a spatial aperture to exclude the stellar halo (see Fig. 1 and associated discussion in Mitchell & Schaye 2021). Note that no spatial apertures are applied for the stellar masses in Fig. 1 (and in other figures). If satellites are included, then the ratio of M⋆/M200 depends only very weakly on halo mass for |$M_{200} \gt 10^{12} \, \mathrm{M_\odot }$|.
In contrast to the stellar mass, the mass in the CGM is always dominated by the central subhalo.2 Note, however, that this component is the most sensitive to the algorithm used to assign subhalo membership to particles. If we only consider the central subhalo, the CGM is the largest single component for |$M_{200} \gtrapprox 10^{13} \, \mathrm{M_\odot }$|, and is in any case always the largest single contributor to the baryonic mass within R200.
Generally speaking, much of the baryonic mass that has been accreted on to haloes resides outside R200 at z = 0, even in the most massive galaxy clusters simulated with |$M_{200} \sim 10^{14} \, \mathrm{M_\odot }$|. Independent of whether the gas ejected from satellites (and their progenitors) is included, the ejected gas reservoir is the largest contributor over |$10^{11} \lt M_{200} \, / \mathrm{M_\odot } \lt 10^{13}$|, and is approximately equal to the CGM mass in more massive haloes if satellites are included. This is contrary to the notion that massive galaxy clusters retain3 all of their baryons, though note that the mass of baryons within R200 is still consistent with the universal baryon fraction in eagle, see e.g. Mitchell et al. (2018).
For halo masses |$\lt 10^{11} \, \mathrm{M_\odot }$|, the mass of gas that we estimate is prevented from being accreted on to the halo exceeds that of any of the components that have been accreted. For halo masses |$\gtrapprox 10^{12} \, \mathrm{M_\odot }$|, our definition of ‘prevented’ mass yields zero, as in this range haloes actually accrete more than the expected number of baryons in eagle (given the universal baryon fraction, see Mitchell et al. 2020a). Overall, we find the prevented component is comparable to the predictions from the zoom-in cosmological simulations presented by Christensen et al. (2016), as inferred from their Fig. 7.
Finally, the ISM is always subdominant to the other components (at least at low redshift), and the median actually drops to zero for |$M_{200} \lessapprox 10^{11} \, \mathrm{M_\odot }$|, due to a combination of limited numerical resolution and stochastic feedback modelling. The 16th to 84th percentile scatter around the median at fixed halo mass (not shown for clarity of presentation) is notably larger for the ISM than for other components, reaching a local maximum of more than 1 dex at |$M_{200} \approx 10^{12.5} \, \mathrm{M_\odot }$|, and also increases at low halo mass due to sampling issues.
Given the model dependence of the results shown in Fig. 1, it is natural to question how this compares to predictions from other cosmological simulations, which implement subgrid feedback processes in different ways. While analysis of the ejected and prevented components shown here is not generally considered in studies of other cosmological simulations, some studies have considered the mass budgets associated with stars, the ISM, and the CGM. For example, Appleby et al. (2021) present mass budgets as a function of stellar mass from the SIMBA cosmological simulations (Davé et al. 2019). At a mass scale corresponding to |$M_{200} \sim 10^{12} \, \mathrm{M_\odot }$|, SIMBA predicts that the total baryon content within a friends-of-friends group is |$\approx 30 {{\ \rm per\ cent}}$| of the universal value, with |$\approx 60 \, {{\ \rm per\ cent}}$| of those baryons in stars, and |$\approx 30 \, {{\ \rm per\ cent}}$| in the CGM. At the same mass scale, eaglepredicts a slightly higher values for the baryon fraction within R200 (|$\approx 40 \, {{\ \rm per\ cent}}$|), and a comparable balance of CGM, ISM, and stars. In turn, the Illustris-TNG-100 simulation (Pillepich et al. 2019) predicts gas fractions within R200 that are more than twice the value predicted by eagle (Davies et al. 2020), highlighting that the results shown in Fig. 1 are indeed expected to be model-dependent.
In high-mass cluster haloes (|$\sim 10^{14} \, \mathrm{M_\odot }$|), SIMBA predicts that the baryon content is still lower than the universal value, at |$70 \, {{\ \rm per\ cent}}$|, where as eaglepredicts a value consistent with the Universal value at this mass scale within R200. van Daalen, McCarthy & Schaye (2020) compare eaglewith other cosmological simulations at this same mass scale (their Fig. 16), finding that some simulations are consistent with the universal value (eagle, Horizon-AGN, Illustris-TNG), but that other simulations (Illustris, and variants of the Cosmo-OWLS and BAHAMAS simulations) predict lower baryon fractions, again highlighting the model dependence. Finally, Lim et al. (2021) compare the gas fractions within R500 between the Magneticum simulation (Dolag, Komatsu & Sunyaev 2016) with eagleand Illustris-TNG-300 over a range of mass scales, finding notably that eaglepredicts values that are up to |$\approx 50 \, {{\ \rm per\ cent}}$| larger than the other two simulations for |$M_{500} \sim 10^{13} \, \mathrm{M_\odot }$|.
Considering instead the mass in metals (bottom panel of Fig. 1), the total metal mass (grey lines) generally traces the total baryonic mass in stars (black lines, top panel), since metal production is approximately proportional to the star formation rate. Metals are first transferred back into the ISM before being locked into later generations of stars, and can be ejected from the ISM in the intervening time. For |$M_{200} \lessapprox 10^{13} \, \mathrm{M_\odot }$| most of the metals that have been ejected from galaxies have also ejected from their associated haloes. Most of the ejected metals are in the CGM for more massive haloes, though as with total baryonic mass, even in galaxy clusters a comparable fraction of the metals are ejected from haloes once satellite subhaloes (and their progenitors) are accounted for.
Appleby et al. (2021) present the relative mass in metals between stars, CGM, and ISM within the simba simulation. For |$M_{200} \sim 10^{12} \, \mathrm{M_\odot }$|, they find that |$\approx 70 \, {{\ \rm per\ cent}}$| of the metals within haloes are in stars, which is close to the value of |$\approx 60 \, {{\ \rm per\ cent}}$| we find for eagle. For |$M_{200} \sim 10^{14} \, \mathrm{M_\odot }$|, this fraction drops is |$\approx 50 \, {{\ \rm per\ cent}}$| in SIMBA, in contrast to eagle where the corresponding fraction is |$25 \, {{\ \rm per\ cent}}$| (with most of the metals being present in the hot CGM).
Fig. 2 compares the total baryonic mass budgets at z = 0 with those at z = 2. As is to be expected given the higher specific star formation rates, the ISM represents a much larger mass fraction at z = 2 compared to at z = 0. This is also true for the CGM (at least for |$M_{200} \lt 10^{12.5} \, \mathrm{M_\odot }$|), and in general the baryonic mass within R200 is higher at z = 2 than at z = 0. At fixed halo mass, feedback effects have prevented less gas from being accreted at z = 2 than at z = 0, and also have ejected less gas outside R200. The halo mass scale over which preventative feedback is important also increases with decreasing redshift. For the ejected gas component located outside R200, the low efficiency of halo-scale gas recycling in eagle(Mitchell et al. 2020a) means that the mass in this component builds steadily over time, mirroring the overall cosmic history of star formation in the simulation.
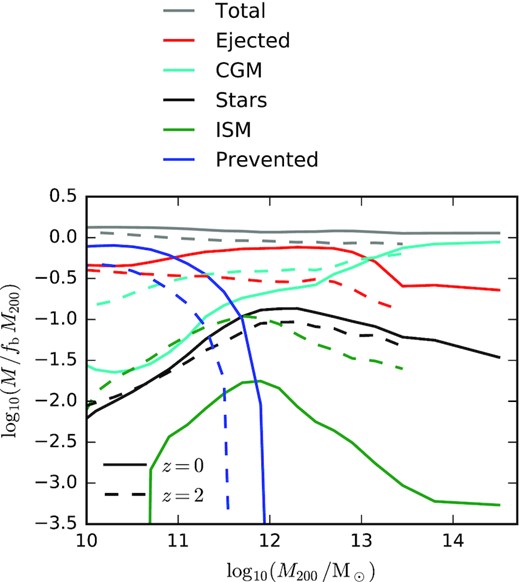
A comparison of the median total baryonic mass in different components, comparing haloes at z = 0 (solid lines) with haloes at z = 2. Only the mass associated with central subhaloes is included. At z = 0, the plotted quantities are the same as the solid lines shown in the top panel of Fig. 1. Feedback processes have ejected or prevented fewer baryons from residing within R200 at z = 2, compared to at z = 0.
3.2 How much of the CGM and the gas ejected from haloes has been processed through the ISM?
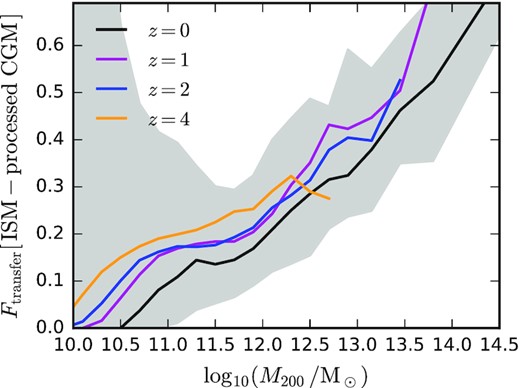
Fig. 3 shows what fraction of the mass in the CGM (top panel) and the ejected gas reservoir outside R200 (bottom panel) has passed through the ISM of a galaxy in the past (‘ISM-processed’). This is computed by tracking gas particles forwards in time through the recorded snapshots of the simulation, and flagging whether the particle ever passed the ISM selection criteria described in Section 2.2. The ISM-processed fraction is nearly independent of halo mass for gas in the CGM, though a slight anticorrelation is apparent at lower redshifts. The fraction is |$\approx 25 \, {{\ \rm per\ cent}}$| at z = 0, increasing with redshift up to an apparent maximum value of |$\approx 40 \, {{\ \rm per\ cent}}$| at z = 2 and above (the fraction eventually decreases again for even higher redshifts that are not plotted). Across all masses and redshifts, the majority of the mass in the CGM has not been processed through the ISM at an earlier stage. This picture is consistent with recent results from another set of hydrodynamical simulations (Hafen et al. 2019), and from empirical modelling of observations (Afruni et al. 2021). The scatter around the median (shown for z = 0) does change significantly with halo mass, decreasing strongly with increasing halo mass. We expect this is driven in part by the hierarchical assembly of haloes (with more massive haloes representing the aggregate average over many smaller haloes), and in part by numerical resolution in conjunction with the efficient stellar feedback in low-mass haloes, as the ISM content of low-mass haloes (|$M_{200} \lt 10^{11} \, \mathrm{M_\odot }$|) and their satellites is heavily undersampled (see e.g. Fig. 1).
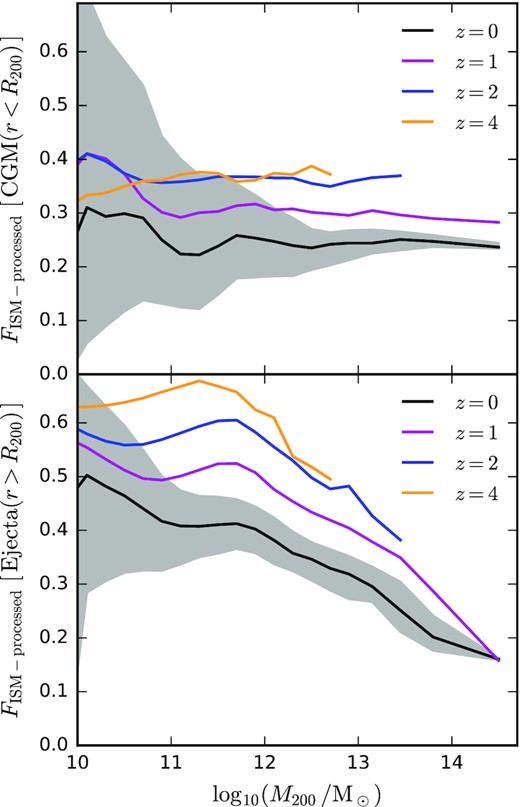
The median mass fraction of gas that has been passed through the ISM of a galaxy in the past (‘ISM-processed’), plotted as a function of halo mass. The top panel shows this fraction for gas in the CGM (with r < R200), and the bottom panel shows the corresponding fraction for gas in the ejected gas reservoir (r > R200). Different line colours correspond to different redshifts as labelled. At z = 0, we also show the 16th to 84th percentiles of the distribution, as indicated by the shaded region. Most of the gas in the CGM has not passed through the ISM in the past. The same is generally true for the ejected gas reservoir outside R200, apart from for low-mass haloes.
For the ejected gas reservoir outside R200 (bottom panel) the ISM-processed fraction is larger than in the CGM for low-mass haloes, but depends negatively on halo mass for |$M_{200} \gt 10^{12} \, \mathrm{M_\odot }$|, and drops to |$\approx 20 \, {{\ \rm per\ cent}}$| in massive galaxy clusters. The fraction increases monotonically with increasing redshift. As the Universe expands and densities and accretion rates decrease, an ambient CGM can increasingly develop, meaning that feedback-driven outflows increasingly have to sweep up more and more CGM material (that the top panel shows typically has not been processed through the ISM) before ultimately escaping the halo.
3.2.1 Temperature and radius dependence
Fig. 4 shows the mass fraction of the CGM that has been processed earlier through the ISM, splitting now either by gas temperature between hot (|$T \gt 10^{5.5} \, \mathrm{K}$|, solid lines) and cool/warm (|$T \lt 10^{5.5} \, \mathrm{K}$|, dashed lines) phases (top panel), or by radius between the inner (r < 0.5R200, solid lines) and outer (r > 0.5R200, dashed lines) regions of the halo (bottom panel). Focusing first on the top panel, we see that for the cooler gas selection, the ISM-processed fraction does not depend monotonically on halo mass, reaching an apparent minimum value at |$M_{200} \sim 10^{11} \, \mathrm{M_\odot }$|. For |$M_{200} \gtrsim 10^{13} \, \mathrm{M_\odot }$|, the ISM-processed fraction for the cooler gas selection can actually reach (or even exceed) |$50 \, {{\ \rm per\ cent}}$|, which is markedly different from the situation for hot gas (solid lines), or for the total CGM mass budget (Fig. 3). For the hotter gas selection, the dependence on halo mass is comparatively much weaker, but is notably more dependent on redshift at fixed halo mass.
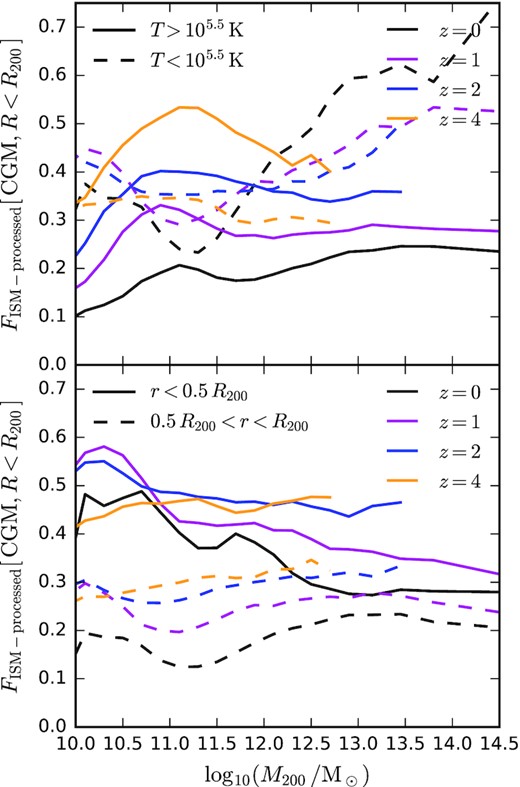
Median ISM-processed mass fractions for circumgalactic gas within haloes, in this case divided into two bins of either temperature (top panel) or radius (bottom panel). In the top panel solid lines correspond to hot gas (|$T\gt 10^{5.5} \, \mathrm{K}$|), and dashed lines refer to cool or warm gas (|$T \lt 10^{5.5} \, \mathrm{K}$|). In the bottom panel solid lines correspond to the inner CGM (|$R\lt 0.5 \, R_{200}$|), and dashed lines refer to the outer CGM (0.5R200 < r < R200). Different line colours correspond to different redshifts, as labelled. For the cool or warm gas component, most of the gas has passed through the ISM in massive haloes, in contrast to to the hot gas component. The ISM-processed fraction is significantly higher in the inner CGM, compared to the outer CGM.
Focusing instead on the bottom panel of Fig. 4, we find, unsurprisingly, that gas in the inner CGM is more likely to have passed through the ISM in the past (|$\approx 40 \, {{\ \rm per\ cent}}$|), when compared to the outer CGM (|$\approx 20 \, {{\ \rm per\ cent}}$|). The ISM-processed fraction increases slightly with redshift up to z = 2 for both the inner and outer CGM, and trends with halo mass are modest.
3.2.2 Origin of the ISM-processed circumgalactic gas
Fig. 5 shows how much of the ISM-processed CGM was last ejected from the ISM of non-progenitor versus progenitor galaxies (i.e. from satellites versus from the central, at least in most cases). This corresponds to the definition of ‘recycled’ versus ‘transferred’ gas accretion, as discussed in Mitchell et al. (2020b; see also Anglés-Alcázar et al. 2017; Grand et al. 2019; Hafen et al. 2019). The former generally refers to gas ejection from the ISM of a central galaxy via feedback processes, whereas the latter will be triggered by a mix of feedback plus stripping via ram pressure, gravitational tides, etc.
For the subset of circumgalactic gas that has passed through the ISM in the past (‘ISM-processed’), the median mass fraction of that gas that comes from (the progenitor of) a non-progenitor galaxy (i.e. ‘transferred’ from satellites) is plotted as a function of halo mass. Different line colours correspond to different redshifts, as labelled. At z = 0, we also show the 16th to 84th percentiles of the distribution, as indicated by the shaded region. ISM-processed gas originates almost exclusively from progenitors of the current central galaxy in low-mass haloes, but gas ejected or stripped from non-progenitor galaxies (generally satellites) is increasingly important for more massive haloes.
The plotted ‘transfer’ fraction depends positively on halo mass. Only |$\approx 20 \, {{\ \rm per\ cent}}$| of the ISM-processed CGM originates from the progenitors of satellites for |$M_{200} \sim 10^{12} \, \mathrm{M_\odot }$|, but this fraction increases to |$\approx 50 \, {{\ \rm per\ cent}}$| for |$M_{200} \sim 10^{13.5} \, \mathrm{M_\odot }$|. While not shown for conciseness, we also find that this non-progenitor fraction depends on radius. For |$M_{200}(z=0) \sim 10^{12} \, \mathrm{M_\odot }$|, |$F^{\mathrm{ISM-processed}}_{\mathrm{transfer}}$| is only |$\approx 10 \, {{\ \rm per\ cent}}$| for |$r\lt 0.5 \, R_{200}$|, but reaches |$\approx 40 \, {{\ \rm per\ cent}}$| for |$r \gt 0.5 \, R_{200}$|. No significant trend with gas temperature is apparent, however.
3.3 Tracking the evolution of the halo baryonic mass budget
Fig. 6 presents a visual overview of the history of baryonic accretion or ejection on to haloes in the eagle simulation. To make this figure, we select central subhaloes by halo mass at z = 0, and track their progenitors backwards in time. Starting from high redshift, all of the baryons that will ever be accreted on to the subhalo progenitors of the selected galaxies are included, plotted as mass fractions that are split into different components. For the left-hand panels, these components include gas that has not yet been accreted on to a progenitor subhalo (blue), gas that is part of the CGM (cyan), ISM (green), stars (black), and gas that has been ejected beyond R200 (red). For the right-hand panels, mass fractions are instead defined by the metal mass in each component, and correspondingly the first component (blue) refers to metals that have not yet formed. Note that we do not include a ‘prevented’ gas component in this figure (i.e. we only include gas that is actually accreted at some point during the evolution of the haloes). Note also that the mass fractions within haloes at a particular time can be obtained by ignoring the blue (‘not yet accreted or formed’) and red (‘ejected >R200’) shaded regions, and renormalizing the three remaining components so that their sum equals unity.
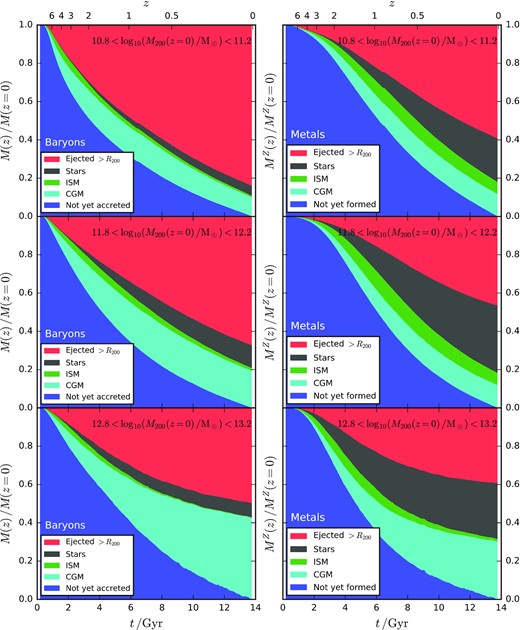
The total baryonic mass (left-hand panels) and metal mass (right-hand panels) fractions associated with different components, plotted as a function of cosmic time. Central subhaloes are selected by halo mass at z = 0, and tracked backwards in time. For each sample of haloes, all baryons that are ever accreted on to progenitor subhaloes are included. Each row corresponds to a different halo mass bin, as labelled. The left column shows mass fractions for gas that has not yet been accreted (blue), the CGM (cyan), ISM (green), stars (black), and gas that has been ejected beyond R200. The right column shows analogous results for metals, where ‘not yet accreted’ is replaced by ‘not yet formed’.
Focusing first on the total baryonic mass fractions (left-hand panels), we see that (as in earlier figures) most of the gas that has been accreted on to haloes has since been ejected and resides beyond R200 by z = 0. The mass fraction in the stellar and ejected components increases monotonically with cosmic time, and the ISM mass fraction peaks at high redshift. For the CGM, the mass fraction peaks at z ≈ 2 for |$M_{200}(z=0) \sim 10^{11} \, \mathrm{M_\odot }$|, grows with time until z = 1 for |$M_{200}(z=0) \sim 10^{12} \, \mathrm{M_\odot }$| (and is steady at later times), and grows monotonically with cosmic time for |$M_{200}(z=0) \sim 10^{13} \, \mathrm{M_\odot }$|, which peaks at high redshift. It is apparent that lower mass haloes first accrete their associated baryons earlier: |$50 \, {{\ \rm per\ cent}}$| of the baryons that will ever accrete do so by z = 1.9, 1.5, and 1.3, respectively, for |$M_{200}(z=0) \sim 10^{11} \, \mathrm{M_\odot }, 10^{12} \, \mathrm{M_\odot }$|, and |$10^{13} \, \mathrm{M_\odot }$|.
To understand these trends in eagle, we can refer back to the earlier analyses of inflow and outflow rates presented in Mitchell et al. (2020b,a), Mitchell & Schaye (2021). For example, one might suspect that the differences in mass fractions in Fig. 6 (and Fig. 1) between different halo mass ranges would be caused by a scale-dependence of halo-scale gas outflows in the sense that higher mass haloes eject comparatively less gas (per unit halo mass) than lower mass haloes. This is in fact not the case at least to leading order (fig. 1, bottom-right panel, Mitchell et al. 2020a, the halo-scale outflow per unit halo mass is nearly independent of halo mass). Rather, the main halo-mass dependence in Fig. 6 is driven primarily by halo-scale gas recycling. The characteristic recycling time-scale for the return of ejected gas scales decreases with halo mass (fig. 7, top panel, Mitchell et al. 2020b) such that the vast majority of gas ejected from low-mass haloes (|$M_{200} \ll 10^{12} \, \mathrm{M_\odot }$|) never returns, whereas the gas ejected from high-mass haloes (|$M_{200} \gg 10^{12} \, \mathrm{M_\odot }$|) is able to return in less than a Hubble time. Incidentally, this is qualitatively consistent with the inferred gas return time dependence inferred by fitting a semi-analytic galaxy formation model to various observational constraints related to the stellar content of galaxies (Henriques et al. 2013), and can be rationalized physically simply by noting that more massive haloes require more energy per unit star formation (or per unit supermassive black hole growth) for gas to be able to permanently escape the halo.

The time evolution of mass fractions for all the baryons that have ever been accreted on to progenitor galaxies (left-hand panel), compared to all those that have ever been accreted on to progenitor haloes (right-hand panel), for haloes selected to have |$M_{200} \sim 10^{12} \, \mathrm{M_\odot }$| at z = 0. Mass fractions are shown for gas that has not yet been accreted (blue), the CGM (cyan), ISM (green), stars (black), and gas that has been ejected beyond R200.
To understand why more massive haloes first accrete their associated baryons later, we can first consider the weak anticorrelation between halo concentration and halo mass, which is known to reflect in turn a weak dependence of halo formation time on the final halo mass, in the sense that more massive z = 0 haloes assembled their mass slightly later (e.g. Bullock et al. 2001; Wechsler et al. 2002; Correa et al. 2015). In addition, we can also expect that preventative feedback (which is only effective in eagle for |$M_{200} \lt 10^{12} \, \mathrm{M_\odot }$|, Fig. 1) may also shape this further, in the sense that preventative feedback is seemingly more significant at z = 0 than at z = 2 (Fig. 2), with the consequence that the baryons that are able to be accreted on to low-mass haloes are accreted earlier, preferentially.
Focusing instead on the corresponding evolution in metal mass fractions (right-hand panels), we see that metal formation is substantially delayed with respect to first-time gas accretion on to haloes, particularly in low-mass haloes. As seen in earlier figures, haloes retain a higher fraction of their metals than they do for total baryonic mass, meaning that gas ejected from the halo is on average metal deficient compared to the baryons within R200. Yet still, almost half the metals have been ejected outside R200 by z = 0 for |$M_{200}(z=0) \sim 10^{12} \, \mathrm{M_\odot }$|. For |$M_{200}(z=0) \sim 10^{12} \, \mathrm{M_\odot }$| most of the remaining (non-halo-ejected) metals are in stars, and only |$12 \, {{\ \rm per\ cent}}$| are in the CGM (defined <R200).
In a recent census of cosmic metals undertaken by Péroux & Howk (2020), it is estimated that |$50 \, {{\ \rm per\ cent}}$| of cosmic metals are in stars at z = 0 (see, however, also Peeples et al. 2014, their figs 5 and 9), and that at high redshift almost all of the expected metals (given the observationally inferred star formation rate density) are accounted for by damped Lyman-α absorbers (DLAs) at z ≈ 4.5, and by a combination of DLAs and lower column density absorbers at z = 3.5. If the scenario presented by eagleis quantitatively correct, this would imply that the observationally inferred low-redshift metal fraction locked in stars is overestimated. This would also indicate (assuming in this case that both observational inference and eagle are correct) that the majority of observed metal absorbers at high redshift are spatially located outside the virial radius of haloes.
3.3.1 Tracking all the baryons that will ever be accreted on to galaxies
To supplement Figs 6 and 7 shows the ‘galaxy-centric’ mass fractions for the subset of baryons that have ever been accreted on to the ISM of a progenitor galaxy (rather than all those that are accreted on to a progenitor halo at R200). The left-hand panel in Fig. 7 show this galaxy-centric view, otherwise repeating the format of Fig. 6 for the |$M_{200}(z=0) \sim 10^{12} \, \mathrm{M_\odot }$| mass bin. The right-hand panel in Fig. 7 repeats the halo-centric information in Fig. 6 as a reference. Note that the galaxy-centric perspective is equivalent to the halo-centric perspective with the non-ISM-processed CGM and non-ISM processed ejected gas components removed.
While relatively fewer of the baryons that are accreted on to galaxies are ejected beyond R200 (compared to all of the baryons that are accreted on to haloes), it remains the case that the majority are still in this ejected component by z = 0 for |$M_{200}(z=0) \sim 10^{12} \, \mathrm{M_\odot }$|. As for other halo mass ranges (not shown), the same is true for lower final-mass haloes, but for more massive haloes (|$M_{200}(z=0) \sim 10^{13} \, \mathrm{M_\odot }$|) the ejected mass fractions are similar for the baryon sets that have passed through galaxies compared to those that have passed through haloes, and this component makes up less than |$50 \, {{\ \rm per\ cent}}$| of the total (|$40 \, {{\ \rm per\ cent}}$| for |$M_{200}(z=0) \sim 10^{13} \, \mathrm{M_\odot }$|).
For |$M_{200}(z=0) \sim 10^{12} \, \mathrm{M_\odot }$|, and considering only the baryons that are retained within the halo, at z = 0 most are in stars, a minority are in the CGM, and only a few per cent are in the ISM, despite gas return to the ISM through stellar mass loss. Irrespective of the final halo mass, galaxies generally accrete their baryons slightly earlier than haloes, half of the accretion has occurred by z ≈ 2.5 for galaxies, compared to z ≈ 1.5 for haloes. This is because haloes continue to accrete significant mass at late times (partly due to pseudo-evolution effects associated with the definition of the virial radius), whereas galaxy-scale gas accretion becomes inefficient at late times (see e.g. van de Voort et al. 2011b; Mitchell et al. 2020b).
4 SUMMARY
We have presented predictions for the mass budgets of gas and metals around galaxies and haloes in the eagle cosmological simulation, splitting between stars, the ISM, CGM, gas that has been ejected beyond R200, and gas that was prevented from having ever been accreted in the first place. We also quantify how much of the CGM has passed through the ISM of a galaxy in the past, and whether such ‘ISM-processed’ gas originated from progenitors of the current galaxy.
We find that in general the majority of gas that has ever been accreted on to haloes has since been ejected, and resides beyond R200 at z = 0 (Figs 1 and 6). Perhaps surprisingly, even though most massive simulated galaxy clusters (|$M_{200} \sim 10^{14} \, \mathrm{M_\odot }$|) have baryon fractions close the universal value, the mass in ejected gas is still |$50 \, {{\ \rm per\ cent}}$| once the gas that was ejected from progenitors of current satellites is accounted for (Fig. 1). For the metals that are produced by stellar evolution, about half are generally predicted to reside outside R200, with the remainder either mostly in stars (|$M_{200} \sim 10^{12} \, \mathrm{M_\odot }$|) or in the CGM or intracluster medium (|$M_{200} \gtrsim 10^{13} \, \mathrm{M_\odot }$|).
For haloes with mass |$M_{200} \lt 10^{12} \, \mathrm{M_\odot }$|, many of the baryons that were expected to be accreted (given the total halo mass) were prevented from doing so by feedback processes (Fig. 1). This ‘prevented’ component comprises about half of the total baryon mass budget for |$M_{200} \lt 10^{11} \, \mathrm{M_\odot }$|, and less for higher masses. At z = 2, the prevented mass (and also the ejected mass) represents a smaller fraction of the total baryon budget than at z = 0 (Fig. 2), as feedback has had less time to cumulatively shape the baryon content in and around haloes.
We find that most of the mass in the CGM has not passed through the ISM of a progenitor galaxy for all halo masses and redshifts (Fig. 3). This is also true for the gas that has been ejected beyond R200, except for the CGM of low-mass haloes (|$M_{200} \lt 10^{11} \, \mathrm{M_\odot }$|), where more than half of the ejected baryons have passed through the ISM in the past. The fraction of the CGM that has passed through the ISM is higher in the inner CGM (|$r \lt 0.5 \, R_{200}$|) than in the outer CGM |$0.5 \, R_{200} \gt r \gt R_{200}$| (Fig. 4). In high-mass haloes (|$M_{200} \gt 10^{12} \, \mathrm{M_\odot }$|), cool circumgalactic gas (|$T \lt 10^{5.5} \, \mathrm{K}$|) is significantly more likely to come from the ISM than hotter gas (|$T \gt 10^{5.5} \, \mathrm{K}$|), but this trend weakens (or even reverses) in lower mass haloes (Fig. 4). We also find that for low- and intermediate-mass haloes most of the CGM that has passed through the ISM in the past originates from progenitors of the current central galaxy (Fig. 5), but that in very massive haloes (|$M_{200} \gt 10^{13} \, \mathrm{M_\odot }$|) most of the CGM that has passed through the ISM comes from non-progenitor galaxies (typically the progenitors of current satellites).
Finally, we present summary figures that provide a useful pedagogical overview of how haloes (Fig. 6) and galaxies (Fig. 7) accrete (and eject) their baryons over cosmic time. These figures highlight that lower mass haloes first accrete their baryons earlier than more massive haloes, that metal formation is significantly delayed with respect to the first baryonic accretion on to haloes (Fig. 6), and that galaxies actually accrete their associated baryons (that will ever be accreted by z = 0) relatively earlier than haloes, since haloes continue to accrete significant material at late times while galaxy-scale accretion shuts down (Fig. 7).
These predictions are clearly model-dependent, but basic comparisons of the integrated baryon content within haloes between different cosmological simulations (see discussion in Section 3.1) show encouraging qualitative agreement (yet still with some interesting quantitative differences), mirroring the good qualitative agreement (and quantitative agreement in some cases) we found when comparing eagle to other simulations in terms of inflow and outflow rates (Mitchell et al. 2020b, a). Ultimately, robust observational tests will be needed to push the subject further, with promising progress being made for example in constraining the integrated baryon content of haloes via the Sunyaev–Zel’dovich effect (e.g. Hill et al. 2018; Lim et al. 2020; Tanimura et al. 2020; Wu et al. 2020; Pratt, Qu & Bregman 2021; Vavagiakis et al. 2021). Observations of hydrogen and metal absorption naturally should also constrain the predictions from cosmological simulations. We close by noting that for simulators to fully harness the constraining power of such observations, our results reiterate that more mature modelling of the mixing of metals with pristine gas will presumably be needed, given the eagle prediction that most of the gas that is displaced from haloes has not been processed directly through the ISM of a galaxy.
ACKNOWLEDGEMENTS
This work used the DiRAC@Durham facility managed by the Institute for Computational Cosmology on behalf of the STFC DiRAC HPC Facility (www.dirac.ac.uk). The equipment was funded by BEIS capital funding via STFC capital grants ST/K00042X/1, ST/P002293/1, ST/R002371/1, and ST/S002502/1, Durham University and STFC operations grant ST/R000832/1. DiRAC is part of the National e-Infrastructure.
This work was supported by Vici grant 639.043.409 from the Netherlands Organization for Scientific Research (NWO).
DATA AVAILABILITY
The data underlying this article will be shared on reasonable request to the corresponding author. Raw particle data and merger trees for the eaglesimulations have been publicly released (McAlpine et al. 2016).
Footnotes
By ‘cumulative mass’, we are referring to the time-integrated mass of all dark matter (or gas) that has ever been uniquely accreted on to any progenitor of the subhalo in question. This does not double-count particles that are accreted more than once.
For central subhaloes we define the CGM as non-ISM gas that is within R200, and that is not considered bound to a satellite by subfind. For satellite subhaloes, the CGM is any non-ISM gas that is considered bound to that satellite by subfind.
By ‘retain’, we are referring here to all of the baryons that have ever been part of the cluster halo and its progenitors, and not to the more conventional consideration, which is simply a comparison of the current baryonic mass fraction within the halo, relative to the universal fraction.
