


ABSTRACT
We report on results of spectropolarimetry of the afterglow of the long gamma-ray burst GRB 191221B, obtained with SALT/RSS and VLT/FORS2, as well as photometry from two telescopes in the MASTER Global Robotic Network, at the MASTER-SAAO (South Africa) and MASTER-OAFA (Argentina) stations. Prompt optical emission was detected by MASTER-SAAO 38 s after the alert, which dimmed from a magnitude (white-light) of ∼10–16.2 mag over a period of ∼10 ks, followed by a plateau phase lasting ∼10 ks and then a decline to ∼18 mag after 80 ks. The light curve shows complex structure, with four or five distinct breaks in the power-law decline rate. SALT/RSS linear spectropolarimetry of the afterglow began ∼2.9 h after the burst, during the early part of the plateau phase of the light curve. Absorption lines seen at ∼6010 and 5490 Å are identified with the Mg ii 2799 Å line from the host galaxy at z = 1.15 and an intervening system located at z = 0.96. The mean linear polarization measured over 3400–8000 Å was ∼1.5 per cent and the mean equatorial position angle (θ) was ∼65°. VLT/FORS2 spectropolarimetry was obtained ∼10 h post-burst, during a period of slow decline (α = −0.44), and the polarization was measured to be p = 1.2 per cent and θ = 60°. Two observations with the MeerKAT radio telescope, taken 30 and 444 d after the GRB trigger, detected radio emission from the host galaxy only. We interpret the light curve and polarization of this long GRB in terms of a slow-cooling forward shock.
1 INTRODUCTION
Gamma-ray bursts (GRBs) are fast, high-energy transient phenomena that, during the sub-second to few hundred seconds duration of the event, are the most luminous sources of gamma-rays in the Universe, with a typical energy release of ∼1051 erg. GRBs are the result of the collapse of massive, highly evolved stars, or the merger of compact objects, with a significant number, particularly the so-called ‘long-soft’ GRBs, linked to core-collapse supernovae (SNe; for a review, see Cano et al. 2017). Accretion on to a resulting compact object, like a black hole or neutron star, produces powerful ultra-relativistic jets that, through dissipation processes like shocks or magnetic reconnection, produce prompt gamma-ray emission (for reviews of GRBs and GRB physics, see e.g. Gehrels, Ramirez-Ruiz & Fox 2009; Gehrels & Razzaque 2013; Gao et al. 2013; Wang et al. 2015; Kumar & Zhang 2015).
The resulting rapidly expanding ejecta of a GRB, after the prompt emission phase, collides with the surrounding medium, producing long-lasting emission called an afterglow, detected across the whole electromagnetic spectrum (e.g. Piran 1999; Mészáros 2002; Piran 2004). At the onset of the collision-driven afterglow, shocks are formed, one forward-propagating into the external medium, while another shorter-lived reverse shock propagates backwards into the jet (Sari & Piran 1999; Kobayashi 2000). The interaction between the ejecta and the surrounding medium may be quantified by several micro-physical parameters, such as the degree of the ejecta’s magnetization, σB. This is the ratio of magnetic to kinetic energy and in the matter-dominated regime model for a standard fireball, σB < 1, and therefore shocks are plasma dominated (Rees & Meszaros 1994; Gomboc et al. 2008). With increasing σB the magnetic energy becomes significant, and the reverse shock develops until it reaches a maximum at σB ∼ 0.1, whereupon it weakens and is suppressed for σB ≥1 (Giannios, Mimica & Aloy 2008, and references therein). For a highly magnetized outflow, the deceleration region has a σB ≫ 1 and so the jet is Poynting-flux dominated.
The prompt emission has been suggested to result from magnetic energy dissipation, where the ejecta entrains ordered magnetic fields (Lyutikov, Pariev & Blandford 2003, and references therein). This emission, and the early-time afterglow emission from reverse shocks, may show high levels of linear polarization in some cases (e.g. Steele et al. 2009; Mundell et al. 2013; Troja et al. 2017). Optical polarization calibration is well established, with comparison of GRB measurements and field stars providing additional robustness to detections. More controversial are claims of prompt gamma-ray emission polarization, with reported measurements spanning the full range from 0 to 100 per cent polarization, and significant disagreement in the parameter distributions derived with different gamma-ray instruments (e.g. Kole et al. 2020). In a Poynting-flux-dominated magnetized jet outflow, the early-time emission is expected to be highly polarized. This is thought to be due to the presence of pre-existing magnetic fields, advected from the central source (e.g. see Zhang & Kobayashi 2005, and references therein). For baryon-dominated jets, the magnetic fields generated locally in shocks are tangled, resulting in unpolarized emission for on-axis jets and low polarization for edge-on jets (Medvedev & Loeb 1999; Sari 1999; Mao & Wang 2017). Early-time polarization measurements of GRB afterglows are therefore crucial for probing the details of the shock physics and for discriminating between different jet models (e.g. Mundell et al. 2013). A review of past GRB prompt and afterglow polarization measurements can be found in Covino & Götz (2016).
At late times, in the forward-shock regime of the afterglow, the predicted polarization at optical wavelengths is a strong function of the viewing geometry of the jet (i.e. the opening angle of the jet and our viewing angle with respect to the jet centre direction), the internal structure of the jet, and the order and strength of the magnetic field (both within the shock and normal to the shock). Most of these parameters influence the total flux light curve only mildly, but have a large effect on the polarization as a function of time (see e.g. Rossi et al. 2004), leading to models for the polarization (amplitude and angle) as a function of time, which can be tested with high-quality data of individual afterglows, as well as the ensemble of measurements of a large number of sources (e.g. Wiersema et al. 2014; Gill & Granot 2020; Stringer & Lazzati 2020; Teboul & Shaviv 2020). There are now a few dozen GRBs for which optical polarization has been detected in their afterglows, and a relatively rich phenomenology is found. Generally speaking, most forward-shock-afterglow polarization measurements show low levels of linear polarization (at most a few per cent), in many cases with clear signs of variability in both polarization angle and amplitude. In some high signal-to-noise cases, evidence exists for polarimetric amplitude and angle variability associated with bumps in the optical and X-ray total flux light curve (e.g. Greiner et al. 2003; Wiersema et al. 2012). Some afterglows exhibit polarization signatures supporting the model predictions for homogeneous jets with random fields (e.g. a 90 deg polarization angle flip; Wiersema et al. 2014), whereas some GRBs more closely follow structured jet models instead (which show no such 90 deg angle change), with possibly an ordered magnetic field component normal to the shock (e.g. Gill & Granot 2020; Teboul & Shaviv 2020). In many cases, it is not practically possible to obtain high-quality polarimetry over a long time period, as most afterglows fade rapidly, and therefore single-epoch measurements of a large number of sources remain important to establish the overall parameter space. The interpretation of polarization data relies on good multiwavelength light curves (e.g. to measure the jet collimation angle and the position of the synchrotron break frequencies), and it is therefore important to increase the sample of afterglows with both polarimetric measurements and well-sampled light curves, such as the data set presented in this paper.
A relatively poorly explored polarimetric probe of afterglow physics is multiwavelength polarimetry, combining near-simultaneous polarization measurements spanning a wide range of wavelengths, which opens a new window on the afterglow physics (e.g. Toma, Ioka & Nakamura 2008). Recently, instruments at long wavelengths have become sufficiently sensitive to deliver on this promise for both reverse and forward-shock regimes (e.g. van der Horst et al. 2014; Laskar et al. 2019; Urata et al. 2019). At optical wavelengths, spectropolarimetry has some diagnostic power in this way as well, particularly if (by chance) any of the synchrotron break frequencies (e.g. the synchrotron cooling frequency) are present near the optical band. Spectropolarimetry also helps to quantify a key contaminant in afterglow polarimetry studies: the polarization induced by dust in the GRB host galaxy and in our own Galaxy. Multicolour polarimetry and spectropolarimetry are the best ways to quantify this contribution, which is likely to play a non-negligible role in the retrieved polarization distribution of afterglows and their physical interpretation (see e.g. Lazzati et al. 2003; Wiersema et al. 2014; Kopač et al. 2015; Covino & Götz 2016; Jordana-Mitjans et al. 2020). To date, the number of afterglows studied with optical spectropolarimetry is limited to just a few cases, e.g. GRB 020813 (Barth et al. 2003), GRB 021004 (Wang et al. 2003), GRB 030329 (Greiner et al. 2003) and GRB 080928 (Covino & Götz 2016). In addition, some spectropolarimetric measurements have been performed for the SNe accompanying GRBs (e.g. GRB 060218; Maund et al. 2007).
Here, we report on follow-up optical photometry, spectroscopy, and spectropolarimetry of the optical afterglow of GRB 191221B. Prompt gamma-ray emission was detected on 2019 December 21 20:39:11.42 (±0.01 s) ut by AGILE (Longo et al. 2019) and on 2019 December 21 20:39:13 ut by Swift/BAT (Laha, Simpson & Neil Gehrels Swift Observatory Team 2019).
2 GRB 191221B
GRB 191221B was detected and first reported by the Neil Gehrels Swift Observatory (henceforth Swift) Burst Alert Telescope (BAT; Barthelmy et al. 2005) on 2019 December 21 at 20:39:13 ut (Laha et al. 2019). Swift slewed immediately to the burst, repointing its narrow-field instruments, the X-ray telescope (XRT; Burrows et al. 2005) and the Ultraviolet and Optical Telescope (UVOT; Roming et al. 2005). A bright afterglow was detected both by XRT and UVOT. The BAT light curve shows a complex prompt emission structure with a duration T90 = 48 ± 16 s in the 15–350 keV band, and the spectrum can be fitted with a simple power law with an index of −1.24 ± 0.05.
The fluence of GRB 191221B was in the top third of all BAT-detected bursts (Sakamoto & Swift-BAT Team 2019). The prompt emission was also reported by AGILE/MCAL (Longo et al. 2019), AstroSat CZTI (Gaikwad et al. 2019), Insight-HXMT/HE (Xue et al. 2019), Konus-Wind (Frederiks et al. 2019), and CALET (Sugita et al. 2019). Although the AstroSat CZTI is, in principle, able to observe gamma-ray polarization, the orientation of the spacecraft was not favourable for a detection of GRB 191221B. The earliest prompt gamma-ray detection was obtained by CALET, at 20:39:05 UTC, which we adopt as the time of the burst, T0. This was followed by the first reported ground-based detection of a bright (unfiltered magnitude = 10.5 mag) optical transient by MASTER-SAAO at 20:41:35 ut, 150 s after the CALET burst detection (Lipunov et al. 2019d), although earlier data points were subsequently determined (see the next section). The source was so bright that UVOT was able to acquire a grism spectrum, which led to a measurement of the redshift (z) of 1.19 (Kuin & Swift/UVOT Team 2019), later confirmed and refined by the ESO/VLT X-shooter spectrograph to z = 1.148 by Vielfaure et al. (2019), who also reported the presence of an intervening system at z = 0.961. The afterglow was also detected in the radio band by ALMA (11.1 h after the trigger; Laskar & a larger collaboration 2019), ATCA (17.5 h after the burst; Laskar 2019), and MeerKAT (30 d after the trigger; Monageng et al. 2020).
3 MASTER PHOTOMETRY OF GRB 191221B
The MASTER Global Robotic Telescope Network (Lipunov et al. 2010, 2019a) began to observe the GRB 191221B error box at 2019 December 21 20:39:43 ut, 38 s post-burst, using the very wide field cameras (VWFC) at MASTER-SAAO, in South Africa (Lipunov et al. 2019d). The VWFC enables wide-field coverage in white light (W) with constant sky imaging every 5 s, which is crucial for GRB prompt detections (Gorbovskoy et al. 2010; Kornilov et al. 2012; Sadovnichy et al. 2018). The brightness of the optical afterglow at discovery was W = 10.3 mag and it remained at this brightness for ∼150 s post-burst, thereafter rapidly declining in brightness.
Observations at MASTER-SAAO, using one of the MASTER-II telescopes (a pair of 0.4 m twin telescopes), started at 2019 December 21 21:09:03 ut (∼1798 s post-burst) using a polarizer and clear filter (Lipunov et al. 2019b), although observations were only possible with one of the pair of telescopes due to a CCD camera being non-operational. The position of the optical afterglow was determined by the MASTER autodetection system (Lipunov et al. 2010, 2019a) from these observations, when GRB 191221B had dimmed to W = 14.4 mag. The coordinates of the optical counterpart were determined to be RA, Dec. (J2000) =10h19m19.24s, −38°09′28.7″ and the optical transient was given the name MASTER OT J101919.24−380928.7 (Lipunov et al. 2019c). MASTER-SAAO observations continued until 21 367 s (∼5.93 h) post-burst, by which time GRB 191221B had faded to W = 16.45 mag. Observations then began with the 0.4-m MASTER-OAFA telescope, in Argentina, 23 017 s (∼6.39 h) post-burst, following the completion of the MASTER-SAAO observations, and continued until 43 324 s (∼12 h) post-burst, at which time the afterglow was at W = 16.77 mag.
The MASTER clear band magnitude, W, is best described by the Gaia G filter. We performed two similar photometric calibration procedures using two different sets of reference stars from the Gaia DR2 catalogue, seven for the VWFC images, and nine for the MASTER II telescope images. These were used to determine the measurement error (see Troja et al. 2017, for a more detailed photometric error determination description). After astrometric calibration of each image, we performed standard aperture photometry using ASTROPY/PHOTUTILS (Bradley et al. 2016).
In Fig. 1, we show the optical light curve evolution of GRB 191221B determined by the MASTER-SAAO and MASTER-OAFA facilities and including subsequent brightness measurements reported in the GCN circulars, as well as by Swift XRT in the 0.3–10 keV range, taken from the Burst Analyser (Evans et al. 2010).1 The light curve of GRB 191221B shows complex breaks in its decline rate, characterized by a general decrease in flux with time, following a sequence of power laws, F ∝ tα. The initial decline rate has α = −1.23 ± 0.04 (measured starting ≈1900 s after the trigger, but a back-extrapolation shows that this decay joins with the early very bright emission), which flattens to α = −0.88 ± 0.02 at ∼0.83 h post-burst. This is followed by a short-lived re-brightening, lasting for ∼0.55 h and rising with α = 0.51 ± 0.14. The afterglow of GRB 191221B then declined slowly, with α = −0.44 ± 0.01 until ∼11 h post-burst, thereafter breaking and declining more rapidly with α = −1.96 ± 0.14, where the latter was determined using magnitudes reported in the GCNs (Gendre 2019; Kong 2019; Romanov 2019). Note that the exact value of the latter slope is not well determined and may change with the addition of further data beyond 1 d. Details of the power-law slopes are presented in Table 1.
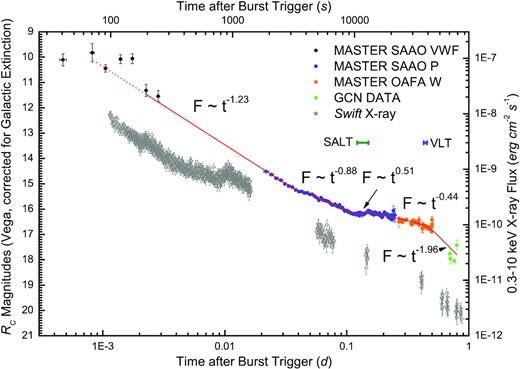
Light-curve evolution of GRB 191221B determined by the MASTER-SAAO and MASTER-OAFA facilities (as well as several other ground-based observations, labelled GCN; see the text for references), as well as by Swift XRT in the 0.3–10 keV range. Time is given in days as well as seconds after the CALET burst trigger time, namely T0 = 20:39:05 ut. The spectropolarimetric coverage by SALT/RSS (10 472–12 925 s post-burst) and VLT/FORS2 (36 906–39 307 s post-burst) is indicated by a green bar and a purple bar, respectively.
Power-law slopes of the optical afterglow light curve of GRB 191221B measured at different phases.
| Tstart (s) | Tend (s) | α |
|---|---|---|
| 1890 | 3500 | −1.23 ± 0.04 |
| 3500 | 10 000 | −0.88 ± 0.02 |
| 10 000 | 12 000 | |$0.51\pm 0.14$| |
| 12 000 | 40 000 | −0.44 ± 0.01 |
| 40 000 | 70 000 | −1.96 ± 0.14 |
| Tstart (s) | Tend (s) | α |
|---|---|---|
| 1890 | 3500 | −1.23 ± 0.04 |
| 3500 | 10 000 | −0.88 ± 0.02 |
| 10 000 | 12 000 | |$0.51\pm 0.14$| |
| 12 000 | 40 000 | −0.44 ± 0.01 |
| 40 000 | 70 000 | −1.96 ± 0.14 |
4 SPECTROPOLARIMETRY
4.1 SALT/RSS
Observations of the optical afterglow of GRB 191221B were obtained with the Southern African Large Telescope (SALT; Buckley, Swart & Meiring 2006) using the Robert Stobie Spectrograph (RSS; Burgh et al. 2003) in spectropolarimetry mode (Nordsieck et al. 2003). The observations were obtained between 23:34 and 00:15 UTC on 2019 December 21, starting 2 h 54 min after the GRB alert. The observations were carried out during the re-brightening phase of the light curve.
Four consecutive exposures of 600 s were obtained at four different orientations of a 1/2 waveplate retarder (0°, 22.5°, 45°, and 67.5°) and the results were analysed to determine the Stokes Q and U parameters, the magnitude of the linear polarization, p, and the position angle of the E-vector, θ. We used the PG300 transmission grating and a 1|${_{.}^{\prime\prime}}$|5 wide slit, which gave a wavelength coverage of 3400–8000 Å at a resolution of ∼16 Å. The spectrograph slit was oriented to a position angle of 45° to allow the nearby (∼1 arcmin) bright (B = 14.7, R = 13.2 mag) reference star, USNO A2 0 0450-11150896, to be measured simultaneously with GRB 191221B. This allows for subtraction of the interstellar polarization component.
The spectropolarimetry reductions were carried out using an adaptation of the beta version of the polsalt 2 software3 and the results are shown in Figs 2 and 3 at two resolutions (50 and 100 Å) for the polarization parameters, the latter figure including the measurements of a nearby field star. We found that GRB 191221B was polarized at an average level of |$p=1.5{{\ \rm per\ cent}}$|, with a variation of |$\pm 0.5{{\ \rm per\ cent}}$|, and θ = 65° with a variation of ±10°, over the range of 3900–8000 Å.
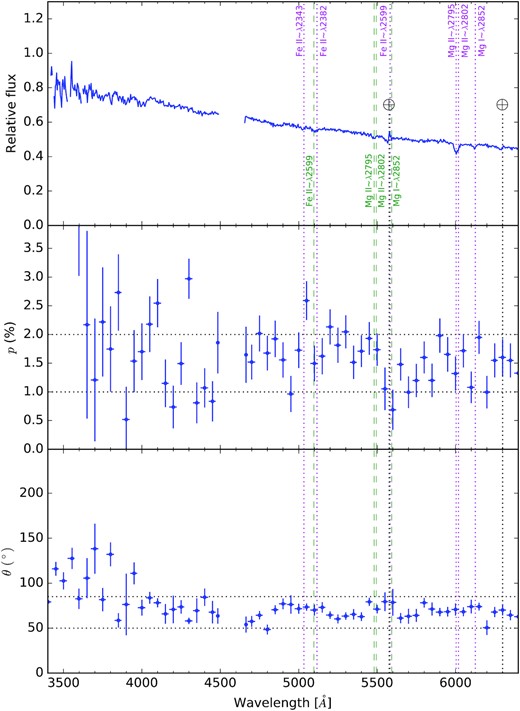
SALT/RSS spectropolarimetry of GRB 191221B covering 3400–6300 Å, where p andθ were determined after binning the data to 50 Å (see the text). Absorption features from the host galaxy (z = 1.15; magenta dotted lines) and an intervening galaxy (z = 0.96; green dashed lines) are indicated. Telluric lines are indicated with black dotted lines. There are no data from ∼4500 to 4650 Å due to a chip gap in the CCD mosaic.
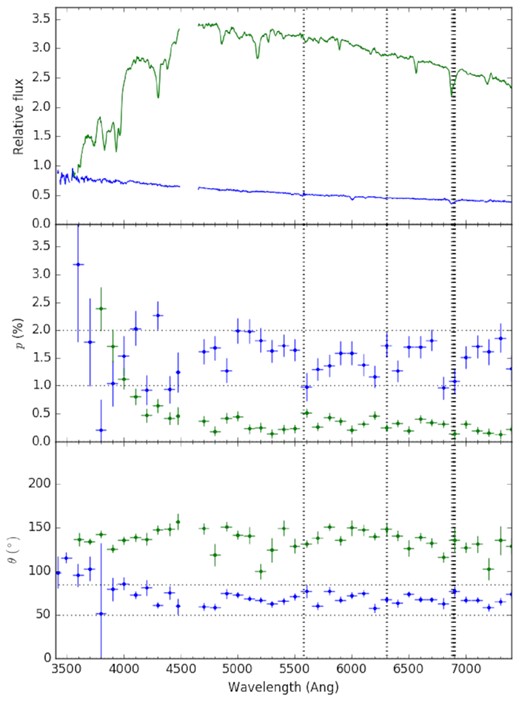
SALT/RSS spectropolarimetry of GRB 191221B (blue) and the nearby bright field star (green), where p and θ were determined after binning the data to 100 Å (see the text). Telluric lines are indicated with thick black dotted lines. There are no data from ∼4500 to 4650 Å due to a chip gap in the CCD mosaic.
Foreground polarization due to the ISM was estimated from the nearby (|${\sim} 50\,\text{arcsec}$| in the SE direction) reference star, USNO A2.0 0450−11150896 (Gaia DR2: 5444869271098575232), which was also placed on the spectrograph slit. The mean polarization was |$p\sim 0.3{{\ \rm per\ cent}}$| and θ ∼ 130° over the range of 4300–7300 Å.
4.2 VLT/FORS2
Spectropolarimetry of GRB 191221B was also obtained using the FORS2 instrument attached at the Cassegrain focus of the Unit 1 (Antu) of the ESO Very Large Telescope. Observations began ∼10 h after the burst (from 06:54 ut on 2019 December 22), during the slow decline phase of the afterglow, where α = −0.44. With the 300V grism (with no order separating filter) and a 1|${_{.}^{\prime\prime}}$|5 slit width. FORS2 observations cover the spectral range from about 3200 to 9200 Å with a spectral resolution of ∼17 Å. The observations were performed using the beam-swapping technique, and the total exposure time was 2400 s, equally split into four exposures with the λ/2 waveplate at position angles of 0°, 22.5°, 45°, and 67.5°. Observations were obtained with the E2V blue-optimized CCD mounted on the instrument. Because of the relatively low spectral resolution, fringing at longer wavelengths did not strongly affect the spectrum. Data were reduced using iraf routines, as described in section 2.3 of Bagnulo et al. (2017).
The correct alignment of the polarimetric optics was obtained by observing the standard star for linear polarization, Ve 6-23 (e.g. Fossati et al. 2007) on the same night. In the same slit as the main target, we also observed a foreground star, slightly fainter than the afterglow of GRB 191221B, which showed low polarization (average p = 0.2 per cent over 4000–7200 Å). This reference star was different from the one observed by SALT, being only |${\sim} 5\,\text{arcsec}$| from GRB 191221B and also considerably fainter. The polarization values of both reference stars are the same, within the uncertainties, indicating a low level of ISM polarization (≤0.3 per cent).
The results are shown in Fig. 4, where the polarimetric measurements were determined after binning the data to 25 Å per bin. The mean polarization values determined for GRB 191221B were p = 1.2 per cent and θ = 60°, slightly less than the SALT/RSS values obtained ∼7 h earlier.
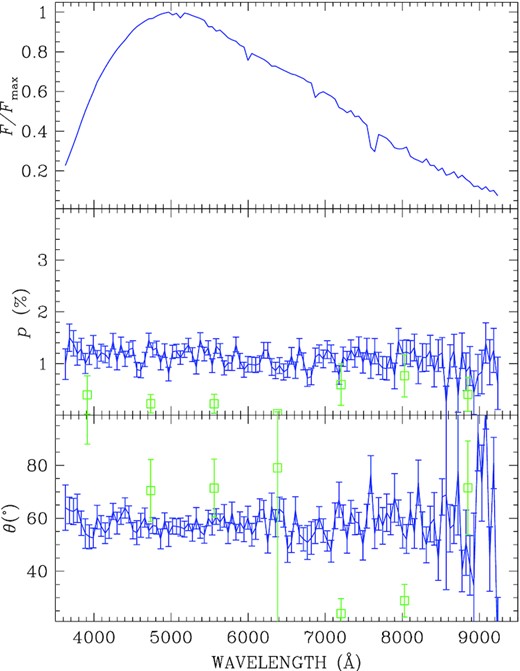
VLT/FORS2 spectropolarimetry of GRB 191221B covering 3600–9200 Å (blue symbols). Data have been rebinned at 50 Å. Green empty squares show the polarization of a foreground star, rebinned at 825 Å.
5 SPECTRAL LINES
Significant absorption lines are seen in both the RSS and FORS2 spectra, the strongest located around 6010 Å that was identified as the Mg ii 2799/2802 Å doublet by Vielfaure et al. (2019) based on VLT/X-Shooter observations. They concluded that this implied a host galaxy redshift (z) of 1.148. A weaker system of absorption lines, around 5490 Å, was also seen, corresponding to the same Mg ii doublet at a lower redshift (z) of 0.961, from an intervening system along the line of sight.
The GRB 191221B spectra are shown in Fig. 5, where proposed line identifications are also shown. Line fits were attempted on both spectra and the results are presented for the higher S/N data from FORS2 in Table 2. Three close pairs of lines resolved in the FORS2 spectra (Fe ii 5096/5114 Å, Mg ii 5481/5494 Å, and Mg ii 6002/6018 Å) were unresolved by RSS. This, coupled with the higher noise of the RSS spectra, meant that the higher equivalent width uncertainties precluded making any quantifiable conclusion on any line strength changes between the RSS and FORS2 observations.
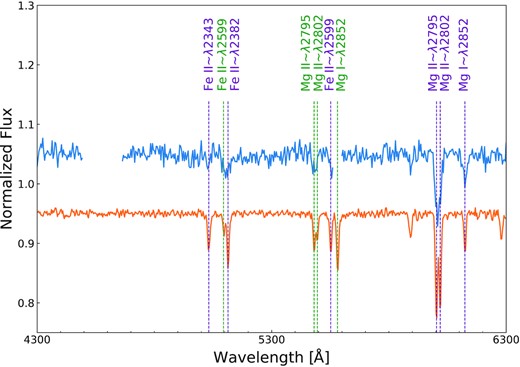
SALT/RSS (blue) and VLT/FORS2 (orange) spectra, normalized and offset by ±0.05, respectively. Chip gaps and regions of sky subtraction are omitted from the RSS spectra. Absorption lines from both the host and an intervening galaxy are indicated. The unmarked line at ≈5900 Å is Na D ISM absorption. Wavelength labels for the host galaxy lines are in purple, while those for the intervening galaxy are in green.
Measurements of spectral lines detected in the optical afterglow of GRB 191221B for the FORS2 observation. Lines corresponding to two redshifts are seen.
| Line ID | Rest wavelength | Observed wavelength | FWHM | EW | z |
|---|---|---|---|---|---|
| (Å) | (Å) | (Å) | (Å) | ||
| Fe ii | 2343 | 5032.35 ± 1.44 | 5.44 ± 1.43 | 0.83 ± 0.26 | 1.148 |
| Fe ii | 2599 | 5096.67 ± 2.19 | 4.70 ± 2.26 | 0.45 ± 0.23 | 0.961 |
| Fe ii | 2382 | 5114.49 ± 0.90 | 4.67 ± 0.96 | 1.10 ± 0.23 | 1.147 |
| Mg ii | 2795 | 5481.56 ± 1.57 | 4.10 ± 1.67 | 0.67 ± 0.21 | 0.961 |
| Mg ii | 2802 | 5494.59 ± 2.19 | 3.93 ± 2.29 | 0.45 ± 0.19 | 0.961 |
| Fe ii | 2599 | 5552.48 ± 1.25 | 4.01 ± 1.25 | 0.62 ± 0.19 | 1.136 |
| Mg i | 2852 | 5581.78 ± 0.91 | 4.44 ± 0.91 | 1.05 ± 0.22 | 0.957 |
| Mg ii | 2795 | 6002.98 ± 0.37 | 4.56 ± 0.40 | 2.08 ± 0.25 | 1.148 |
| Mg ii | 2802 | 6018.71 ± 0.14 | 4.38 ± 0.43 | 1.83 ± 0.24 | 1.148 |
| Mg i | 2852 | 6124.64 ± 1.28 | 4.10 ± 1.30 | 0.69 ± 0.22 | 1.128 |
6 MEERKAT RADIO OBSERVATIONS
GRB radio afterglows can probe the properties of the jet until very late times, when the jet essentially becomes non-relativistic. The distribution of afterglow radio detection times, after trigger, for radio-detected GRBs peaks between 16 and 32 d, and detections have been made hundreds of days after trigger in some cases (Chandra & Frail 2012). The typical peak flux density is ∼100 μJy at 8.5 GHz and ∼10 d after trigger. The radio flux typically declines as t−1 after the peak. The radio afterglow of GRB 191221B was detected by ATCA 0.73 d after the GRB, at 5.5, 9.0, 16.7, and 21.2 GHz (Laskar 2019). This therefore motivated the attempt to observe GRB 191221B with the MeerKAT radio telescope array (Jonas 2009), in order to detect and monitor any radio emission from this GRB.
Observations of GRB 191221B with the MeerKAT radio telescope were attempted on 2020 January 21, from 20:26 to 21:26 UTC (∼30 d after the trigger) and 2021 March 10, from 17:33 to 18:32 UTC (∼444 d after the trigger), under Director’s Discretionary Time (Monageng et al. 2020). We used J0408−6545 as the bandpass and flux calibrator, which was observed for 10 min at the start of the observations. The phase calibrator used was J1120−2508, which was observed for 2 min before and after the two ∼20 min scans of GRB 191221B in both observations (from 20:41:04.0 to 21:00:55.5 and 21:03:51.5 to 21:23:50.9 UTC on 2020 January 21 and from 17:46:19.4 to 18:06:10.9 and 18:09:14.8 to 18:29:06.3 UTC on 2021 March 10, respectively). The observations were performed with 60 antennas and were centred at a frequency of 1.28 GHz with a bandwidth of 856 MHz over 4096 channels. The data were reduced using standard procedures in casa (McMullin et al. 2007). The data were first flagged making use of AOFlagger (McMullin et al. 2007). Thereafter, phase-only and antenna-based delays were corrected for making use of a model based on the primary calibrator. The bandpass correction for the relative system gain over the frequency range of the observation was determined and then complex gains were solved for the primary and secondary calibrators, before scaling the gain corrections for the secondary calibrator from the primary calibrator and applying all the calibrations. Lastly, a small fraction of data were flagged using the RFlag and TFCrop algorithms. Imaging was done using DDFacet (Tasse et al. 2018) and self-calibration using the killms software4 with the CohJones solver. We choose robust R = −0.7 and a cell size of 1|${_{.}^{\prime\prime}}$|00. For the final direction-independent self-calibrated images, we estimate an rms noise of ∼17 and ∼13 μJy per beam for the observations performed on 2020 January 21 and 2021 March 10, respectively, within the vicinity of the source. The dimensions of the synthesized beam are |$6.91\rm{\,arcsec}\times 4.44\rm{\,arcsec}$|.
A source was detected at the nominal GRB 191221B afterglow position, with a peak flux density of 69 ± 12 μJy per beam (4.0σ) and 47 ± 11 μ Jy per beam (∼3.6σ) for the observations performed on 2020 January 21 and 2021 March 10, respectively. We show colour maps of the MeerKAT images of the GRB 191221B field in Fig. 6, where a radio source is clearly seen coincident with the optical position.
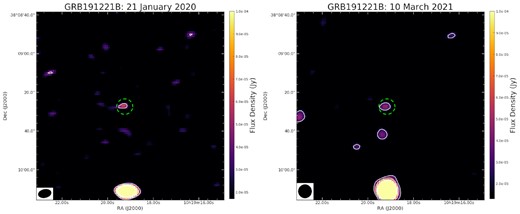
MeerKAT images (1|${_{.}^{\prime}}$|5 × 1|${_{.}^{\prime}}$|5) of the GRB 191221B field, centred at 1.28 GHz and with a bandwidth of 0.86 GHz, for observations performed on the 2020 January 21 (left) and 2021 March 10 (right). The source near the centre is coincident with the GRB 191221B position. The green dashed circle is centred at the most accurate position of GRB 191221B, determined from ALMA observations (Laskar & a larger collaboration 2019). White contours are in multiples of 3σ and the beam shape is shown in the bottom left corner.
7 MODELS
The long GRB 191221B had a duration of T90 = 13.0 ± 1.6 s (Sugita et al. 2019) with multiple pulses during the prompt phase. It was a very bright burst, with a 20 keV–10 MeV fluence of (1.0 ± 0.1) × 10−4 erg cm−2 (Frederiks et al. 2019). Given the burst was located at a redshift (z) of 1.148 (Vielfaure et al. 2019), GRB 191221B was also rather energetic with Eiso = (3.6 ± 0.1) × 1053 erg in the 1 keV–10 MeV rest-frame energy range (Frederiks et al. 2019).
Optical observations by MASTER show (see Fig. 1) a declining flux (Fν ∝ t−α) from t ≳ t0 + 100 s, typical of GRB afterglow emission (it is also likely that there is an optical flare superposed on the decaying emission, but data coverage is sparse and no deeper conclusions can be drawn). The optical flux decay indices αOPT = −1.23 ± 0.04 until t ∼ t0 + 3.5 ks and αOPT = −0.88 ± 0.02 thereafter until t ∼ t0 + 10 ks are compatible with synchrotron emission from a forward shock expanding into a constant-density interstellar medium (Sari 1999). In the slow-cooling regime (νm < ν < νc), the forward-shock model predicts α = 3(p − 1)/4 = 0.90–0.98 for the typically assumed spectral index p = 2.2–2.3 for the emitting electrons.
The optical flux decay index is comparable to the Swift XRT flux (0.3–10 keV) decay index |$\alpha _{X} = 1.03^{+0.09}_{-0.08}$| after t = t0 + 4.9 ks (D’Avanzo et al. 2019). The X-ray spectral index (Fν ∝ ν−β) |$\beta _X = 0.86^{+0.07}_{-0.06}$| for the same Swift XRT flux (D’Avanzo et al. 2019) is also compatible with the expected value of β = (p − 1)/2 = 0.60–0.65, for p = 2.2–2.3, from the forward-shock model. Therefore, we conclude that both optical and X-ray afterglows of GRB 191221B come from the slow-cooling segment of the synchrotron spectrum. This rules out a reverse-shock origin of the optical afterglow, which predicts α = (3p + 1)/4 = 1.90 for typical values of p (Zhang, Kobayashi & Mészáros 2003).
The relative flattening of the optical light curve after ∼t0 + 10 ks and subsequent decline is expected from the refreshed-shock scenario, where a slower GRB shell ejected later catches up with the decelerating outflow (Panaitescu, Mészáros & Rees 1998). The light curve after 70 ks, steeply decaying as t−1.96 as seen in Fig. 1, is most likely due to a jet break, which happens when the jet-opening angle θjet ∼ 1/Γ(t), where Γ(t) is the bulk Lorentz factor of the jet. A jet break would cause the light curve to decay as t−p after t ∼ tjet (Sari, Piran & Halpern 1999). Assuming that the optical flux after 70 ks is post-jet break, the spectral index of the emitting electrons is p = α = −1.96 ± 0.14. This is slightly harder than the 2.2–2.3 values typically inferred from GRB afterglow modelling, but is consistent with generic particle acceleration models within the uncertainties.
The 69 ± 12 μJy radio flux detected by MeerKAT at 1.28 GHz and ∼30 d after trigger is comparable to the 1.4 GHz flux density measured from other GRBs (Chandra & Frail 2012). However, our late-time observation at ∼444 d shows that this flux stems mostly or completely from the host galaxy. We have estimated the expected radio flux from star formation in a host galaxy at z = 1.2 or an intervening galaxy at z = 0.96. Using equation (1) presented in Berger et al. (2003), which is based on the original expression for the observed flux as a function of star formation rate (SFR) derived by Yun & Carilli (2002), we calculated the required SFR needed to produce the observed MeerKAT flux. This was 53 M⊙ yr−1, comparable to the SFR presented in Stanway, Levan & Davies (2014) from radio observations of GRB hosts and consistent with radio observations of star-forming region (Murphy et al. 2011).
The flux difference between the two MeerKAT observations is |$22\pm 16\, \mu$|Jy, which may indicate an additional contribution from the radio afterglow, but the difference is not statistically significant. We cannot elaborate on the nature of the radio light curve and derive the power-law decline rate due to scarcity of other radio data points reported for this GRB to date. The flux of the first radio observation by ATCA, obtained 17.5 h after the trigger (Laskar 2019), is still to be published.
Synchrotron emission is expected to be highly polarized, although in the context of GRB emission models the expected degree of polarization is |${\lesssim} 2{{\ \rm per\ cent}}$| for a late afterglow (Covino & Götz 2016). The reason is that, within the 1/Γ(t) observable cone, there can be a number of magnetic patches, each with a random orientation, thus reducing the degree of polarization while adding emission incoherently (Gruzinov & Waxman 1999). This is particularly true for the forward-shock emission, which we believe is the origin of the observed optical emission in GRB 191221B, where the magnetic field is generated from turbulence and the magnetic patches are rather small (Medvedev & Loeb 1999; Mao & Wang 2017). Exotic effects such as mixing of photons with axion-like particles can also contribute to polarization (Mena, Razzaque & Villaescusa-Navarro 2011). The observed level of a few per cent linear optical polarization degree is therefore compatible with this qualitative scenario. An interesting effect is related to the viewing geometry of the afterglow near the time of the jet-break. Around this time, the polarization components over the area of equal arrival time (an annulus in the case of a homogeneous top-hat jet with a magnetic field that is unordered) no longer sum to zero, and a marked change on the polarization angle and degree is expected, depending on the viewing angle, the jet opening angle, the jet structure, and the order of the magnetic field in the radiating surface (Rossi et al. 2004). This has been detected in some afterglows (e.g. Wiersema et al. 2014) but is not detected in all cases where polarimetry covers times near tjet. We see no similar signature in the case of GRB 191221B. Unfortunately, the sparse polarimetric monitoring and the contribution due to dust-induced polarization in the host galaxy prevent us to draw stronger conclusions. In fact, the various possible configurations model parameters can generate different scenarios for the polarization time evolution, often with essentially the same flux evolution (e.g. Rossi et al. 2004; Covino & Götz 2016; Kobayashi 2019; Cheng, Zhao & Bai 2020; Shimoda & Toma 2020; Stringer & Lazzati 2020; Teboul & Shaviv 2020).
In addition, if the surrounding medium is dense, we should further consider synchrotron polarization radiative transfer in the optical band (Mao, Covino & Wang 2018). The column density determined by the Swift-XRT observation provides an upper limit of |$1.0\times 10^{21}~\rm {cm^{-2}}$|, and this corresponds to AV = 0.56 mag. The relatively strong absorption leads to the low-degree polarization of the observed continuum. Alternatively, the low-degree polarization could be produced by the relativistic electron radiation in the stochastic magnetic field (Medvedev & Loeb 1999; Sari 1999; Mao & Wang 2017).
It is significant that some absorption lines are clearly detected in the observed spectra of GRB 191221B. Absorption by a patchy dense medium, permeated with a magnetic field, can be strongly amplified by relativistic shocks (Mizuno et al. 2014). When GRB shocks encounter a dense medium, we may consider the possibility of detecting polarization features in the absorption lines. If the GRB jet is magnetically dominated, the bipolar magnetic field extending along the jet may reach the location of the absorbing material, although the strength of the magnetic field may decrease along the GRB jet. Some material may be ejected by the jet from the GRB central engine (Janiuk 2014; see also the recent work on baryon loading in relativistic magnetized shocks by Metzger, Margalit & Sironi 2019). If particle cooling is effective, the optical photons can be absorbed by the cooled material. In the meanwhile, the magnetic field may have an effect on the material, even at a few parsecs from the GRB central engine.
The theoretical predictions mentioned earlier might be constrained by spectropolarimetric observations. Polarized radiative transfer of absorption lines was first mentioned by Unno (1956), where Zeeman splitting produces a triplet structure in a polarized absorption line. The detection of Zeeman split absorption lines is difficult and requires higher resolution spectral observations than in this study. We estimate that a spectral resolution of about R ∼ 105 will be necessary if we assume a magnetic field of about 103 G in the line-forming region (Mao et al. 2021). Although the detection of Zeeman splitting is a hard task, we believe that such a detection in GRB absorption lines in the optical band could be attempted in the future with sufficiently high-resolution spectropolarimetry on 8-m class telescopes, or larger.
8 CONCLUSIONS
We presented multi-epoch optical observations of the bright, long-duration GRB 191221B with MASTER, SALT, and VLT, as well as radio observations with MeerKAT. We obtained detailed photometric data with MASTER, while spectropolarimetric measurements were performed using data from SALT and VLT. We detected emission at the position of GRB 191221B with MeerKAT at 1.28 GHz at a flux level of |${\sim} 70$| and |${\sim} 50\, \mu$|Jy at 30 and 444 d post-burst, respectively, implying this to stem from the host galaxy of GRB 191221B, likely due to star formation.
The bright (W = 10.3 mag) prompt afterglow was detected with MASTER 38 s post-burst and monitored over ∼12 h to decline to W = 16.8 mag. The optical light curve after the prompt phase shows a smooth, power-law flux decay, as typically expected from GRB afterglow emission, with several breaks at later time. From the measured decline rates of the optical light curve and the close resemblance between the optical and Swift-XRT light curves, we conclude that the GRB 191221B optical afterglow is powered by slow-cooling synchrotron emission, ruling out a reverse-shock origin. The flattening and subsequent decline after ∼10 ks are attributed to a refreshed-shock scenario, where a faster moving shell ejected later catches up with the initial decelerated outflow. The steeper decay after 70 ks is likely due to a jet break. We confirm that the inferred spectral index of radiating electrons is typical of the ones expected from the Fermi shock-acceleration process.
The linear polarization of optical emission from GRB 191221B was first detected by SALT/RSS at ∼ 1.5 per cent some ∼3 h post-burst, during a period when the brightness had plateaued. Observations with VLT/FORS2 showed little change in polarization ∼10 h later, when GRB 191221B was on the decline. Such a low-level polarization is expected for the late afterglow, when the emission is dominated by the forward shock with a randomly oriented magnetic field configuration.
GRB 191221B provided an opportunity to observe afterglow polarization at late time. Our observations show that the degree of polarization decreases marginally (by ∼0.3 per cent) over a time-scale of ∼7 h. Future spectropolarimetric observations from early to late times could probe magnetic field structures in the reverse- and forward-shock regimes, and a transition from the former to the latter.
SUPPORTING INFORMATION
Table 3 contains the light curve data used to produce Fig. 1.
Table 3. Photometric data of GRB 191221B from MASTER Network.
Please note: Oxford University Press is not responsible for the content or functionality of any supporting materials supplied by the authors. Any queries (other than missing material) should be directed to the corresponding author for the article.
ACKNOWLEDGEMENTS
Some of the observations presented here were obtained with SALT under programme 2018-2-LSP-001 (PI: DAHB), which is supported by Poland under grant no. MNiSW DIR/WK/2016/07. Based on observations collected at the European Southern Observatory under ESO programme 0104.D-0600(C).
DAHB and JT acknowledge support through the National Research Foundation (NRF) of South Africa. MB is supported by the South African Research Chairs Initiative (grant no. 64789) of the Department of Science and Innovation and the NRF.5 DMH acknowledges financial support from the NRF and the SAAO. SR is partially supported by NRF with grant no. 111749 (CPRR) and by a University of Johannesburg Research Council grant. DAK acknowledges support from Spanish National Research Project RTI2018-098104-J-I00 (GRBPhot). NPMK acknowledges support by the UK Space Agency. MASTER (equipment) is supported by Lomonosov Moscow State University Development Program. VL and DV are supported by RFBR grant 19-29-11011. CGM acknowledges financial support from Hiroko and Jim Sherwin.
We thank the Director and staff of SARAO for supporting our MeerKAT DDT observation. The MeerKAT telescope is operated by the South African Radio Astronomy Observatory (SARAO), which is a facility of the National Research Foundation, an agency of the Department of Science and Innovation.
Based on observations made with the SALT and the MeerKAT radio telescope array.
DATA AVAILABILITY
The data underlying this article will be shared on reasonable request to the corresponding author. Some data (light curves and spectra) are available at the following website: https://tinyurl.com/yyd3hty8.
Footnotes
We used polsalt version 20171226 (including specpolextract_dev version 20180524), based on pySALT v0.5dev.
Any opinion, finding, and conclusion or recommendation expressed in this material is that of the authors and the NRF does not accept any liability in this regard.
