


ABSTRACT
We present UV photometry of the globular cluster NGC 1261 using images acquired with the Ultraviolet Imaging Telescope (UVIT) on board Astrosat. We performed point-spread function (PSF) photometry on four near-UV (NUV) and two far-UV (FUV) images and constructed UV colour–magnitude diagrams (CMDs), in combination with the Hubble Space Telescope (HST), Gaia, and ground-based optical photometry for member stars. We detected the full horizontal branch (HB) in the NUV and blue HB in the FUV and identified two extreme HB (EHB) stars. HB stars have a tight sequence in UV–optical CMDs, well fitted with isochrones generated (age 12.6 Gyr, [Fe/H] = −1.27 metallicity) using updated BaSTI-IAC models. Effective temperatures (Teff), luminosities, and radii of bright HB stars were estimated using the spectral energy distribution. As we detect the complete sample of UV-bright HB stars, the hot end of the HB distribution is found to terminate at the G-jump (|$T_{\rm eff}\, \sim$| 11500 K). The two EHB stars, fitted well with single spectra, have Teff = 31000 K and a mass = 0.495 M⊙, and follow the same Teff–radius relation as the blue HB stars. We constrain the formation pathways of these EHB stars to extreme mass loss in the RGB phase (due either to rotation or enhanced helium) or a early hot-flash scenario.
1 INTRODUCTION
Globular clusters (GCs) are ideal laboratories to study stellar evolution at different phases, starting from the main sequence (MS), to the subgiant branch (SGB), red giant branch (RGB), horizontal branch (HB), asymptotic and post-asymptotic giant branch (PAGB), and finally the white dwarf (WD) phase. GCs are the oldest and most massive stellar aggregates known to exist in our Galaxy, consisting of simple and multiple stellar populations (Bedin et al. 2004; Piotto et al. 2007, 2012, 2015; Marino et al. 2008; Milone et al. 2008, 2010; Yong & Grundahl 2008; Anderson et al. 2009; Lee et al. 2009; Piotto 2009; Walker et al. 2011; Villanova et al. 2013) with single stars and binary stars as well as multiple systems. Hence, they provide the best platform to study exotic populations such as blue straggler stars (BSSs), cataclysmic variables, low-mass X-ray binaries (LMXB), etc., which demand binary formation pathways. However, recent studies have shown that almost all GCs consist of multiple stellar populations.
Ultraviolet (UV) studies of evolved populations in GCs are very important, because a few critical evolutionary phases found in GCs are brighter in UV than in optical wavelengths. These are the main contributors to the luminosity of GCs in the UV. These UV-bright stars are hot and consist mostly of HB stars, PAGB stars, WDs, and BSSs (Zinn, Newell & Gibson 1972; Harris, Nemec & Hesser 1983). The spectral energy distribution (SED) of these hot stars peaks at shorter wavelengths, mainly in the near-ultraviolet (NUV) or far-ultraviolet (FUV). Note that MS stars and RGB stars, which make up the majority of stars in a GC, are faint at such short wavelengths. Hence, the UV images are less crowded than the optical images. Recent studies of GCs (Ferraro et al. 2003; Dieball et al. 2010, 2017; Haurberg et al. 2010; Parada et al. 2016; Raso et al. 2017) have highlighted the importance of UV colour–magnitude diagrams (CMDs) to identify and study the properties of UV-bright stellar populations. The HB stars are core helium-burning low-mass stars with hydrogen-rich envelopes surrounding the core. The core mass of stars lying on the HB is approximately ∼0.5 M⊙ (Iben & Rood 1970). The HB itself consists of subpopulations separated by gaps, namely the red horizontal branch (RHB), blue horizontal branch (BHB), and extreme horizontal branch (EHB). The RHB stars are cooler than the RR Lyrae instability strip, with effective temperatures ranging from ∼5000−6200 K, whereas the BHB stars are hotter than the RR Lyrae instability strip and cooler than the EHB stars. The effective temperatures of the BHB stars are expected to lie between ∼8000 and 20000K. EHB stars are core helium-burning stars with an envelope too thin to sustain hydrogen burning. These stars have effective temperatures greater than 20000K and are expected to lie at the end of the blue tail of the HB in the optical CMD. UV photometry helps to confirm the presence of EHB stars and separate them from bright BSSs, as optical colours become degenerate at the effective temperature of these stars (D’Cruz et al. 2000; Brown et al. 2001; Dalessandro et al. 2008). Parameters and reasons behind the distribution of stars along the HB in optical CMDs are not yet understood. At first, it was thought that only the metallicity of the cluster affected the HB morphology, but later, through observations, it was found that parameters other than metallicity, such as the age of the cluster and/or He abundance, can affect the colour distribution of HB stars (Catelan 2009). This problem is known as the second parameter problem, first mentioned by Sandage & Wallerstein (Sandage & Wallerstein 1960; Sandage & Wildey 1967; van den Bergh 1967). Milone et al. (2014) investigated the relation between HB morphology and various properties in GCs. They suggested that age and metallicity are the main global parameters of the HB morphology of GCs, while the range of He abundances within a GC is the main non-global parameter.
In clusters with HB morphology covering a wide range in optical colour, a number of discontinuities or jumps have been detected, although the visibility of these gaps changes with the bandpasses utilized (Brown et al. 2016). Three prominent such discontinuities or gaps known so far are the ‘Grundahl jump’ (G-jump), which lies within the BHB at ∼11500K (Grundahl et al. 1999), ‘Momany jump’ (M-jump), which lies within the EHB at ∼23 000 K (Momany et al. 2002, 2004), and the gap between the EHB and blue-hook stars, covering ∼ 32000–36000K (Brown et al. 2001). The gaps in the HB distribution are discernible in clusters hosting a sufficient number of BHB and EHB stars and these gaps are found to be consistent in colour (effective temperature) across clusters (Ferraro et al. 1998; Brown et al. 2016). Various explanations are given for the presence of these gaps in the HB distribution by Moehler (2001), such as diverging evolutionary paths, mass loss in the RGB phase, distinctions in CNO or rotation rates, dynamical interactions, atmospheric processes, He mixing in RGB stars, and statistical fluctuations. Brown et al. (2016) characterized these HB features in 53 GCs, including NGC 1261. They created colour–colour plots for all selected clusters. They found less than four HB stars blueward of the G-jump in NGC 1261 (see fig. 5 in Brown et al. 2016). Schiavon et al. (2012) constructed UV CMDs (FUV−NUV versus FUV) for 44 Galactic globular clusters using Galaxy Evolution Explorer (GALEX) data. They observed that the HB stars follow a diagonal sequence, unlike the horizontal distribution in the optical, and its slope depends mainly on bolometric correction effects.
EHB stars are intriguing objects to study, as they are one of the important sources of UV upturn at wavelengths shorter than 2300 Å in the spectra of elliptical galaxies (Greggio & Renzini 1990; Dorman, O’Connell & Rood 1995; Chung, Yoon & Lee 2011; Bekki 2012). The origin of EHB stars in GCs is still not clear. One of the formation scenarios suggested for EHB stars is enhanced mass loss in the RGB evolutionary phase. Mengel, Norris & Gross (1976) and Tutukov & Iungelson (1987) proposed that EHB stars are the product of dynamical interactions inside binary systems in clusters. He mixing is also a possible scenario to explain the formation of EHB stars in clusters (Sweigart 1997). Through convection, helium is mixed into the outer layers of the envelope, which in turn increases the envelope He abundance. The enhanced He abundance causes the tip of the RGB to have higher luminosity than in the normal case. The higher luminosity leads to high mass loss on the RGB. Thus, He mixing is responsible for producing a bluer HB morphology. Other possible formation scenarios for EHB stars in clusters are early hot-flasher, late hot-flasher, and He enrichment (Brown et al. 2001, 2010, 2012; Lei et al. 2015; Heber 2016).
BSSs occupy a region above the turn-off (TO) point in the CMD of star clusters, where no stars are expected on the basis of standard stellar evolution, if we assume that all cluster stars are coeval. It has been suggested that BSSs are the product of stellar collisions or mass exchange in close binary systems (McCrea 1964; Hills & Day 1976). The stellar collision formation scenario for BSSs dominates in high-density environments, whereas other formation scenarios dominate in low-density environments.
Here, we study the southern Galactic GC NGC 1261, located in the constellation Horologium at a distance of 17.2 kpc (Arellano Ferro et al. 2019) and metallicity [Fe/H] = −1.27 dex (Carretta et al. 2009). Since this cluster is away from the Galactic disc (|$b = -52{{^{\circ}_{.}}}13$|), it experiences almost negligible or no reddening. The age of this cluster is estimated to be 10.75 ± 0.25 Gyr (VandenBerg et al. 2013), 11.5 ± 0.5 Gyr (Dotter et al. 2010), and 12.6 ± 1 Gyr (Kharchenko et al. 2013). In this study, the age of this cluster adopted to generate the isochrones is 12.6 Gyr. In this work, we present the results of a UV imaging study of NGC 1261 in six filters (two FUV and four NUV), using the Ultraviolet Imaging Telescope (UVIT) on board Astrosat. We used the proper motion estimated using HST and Gaia DR2 data to select cluster members in the inner and outer regions of the cluster, respectively. We detect the HB and a few UV-bright stars among the HB population. We determine the properties of the HB stars by analysing the SEDs to shed light on the formation and evolution of bright HB stars.
This work is laid out as follows. Section 2 describes the observations and data reduction. In Section 3, the UV and optical CMDs are presented. We describe the properties of bright HB stars derived from UVIT photometry, along with HST, Gaia, and ground-based photometry, in Section 4. All the results are discussed in Section 5. We summarize our results and conclude in Section 6.
2 OBSERVATIONS AND DATA REDUCTION
NGC 1261 was observed with UVIT on 2017 August 26 in two FUV and four NUV filters. UVIT is one of the payloads in Astrosat, the first Indian Space Observatory. UVIT can perform simultaneous imaging in three channels: FUV (130–180 nm), NUV (200–300 nm), and VIS (320–550 nm), in a circular field of view of diameter ∼28 arcmin. The spatial resolution (full width at half-maximum, FWHM) is better than 1.8 arcsec for the FUV and NUV channels and 2.2 arcsec for the VIS channel. The VIS channel is used only for drift correction. Each channel (FUV, NUV, and VIS) consists of a set of selectable filters having different wavelength range. Intensified CMOS detectors are used in photon-counting mode for the two UV channels and integration mode for the VIS channel. Further details about UVIT and calibration results can be found in Subramaniam et al. (2016) and Tandon et al. (2017a). The primary photometric calibration for all FUV and NUV channels was accomplished using observations of HZ4, a white dwarf spectrophotometric standard star (Tandon et al. 2017b). The magnitude system adopted for UVIT filters is the AB magnitude system, and hence the estimated magnitudes will be in this system.
ASTROSAT has an orbit of 90 min and UVIT observes only the night part of the orbit. The observation is, therefore, about 20 min or less per orbit (after the overheads). The UVIT instrument takes data over several orbits to complete the required exposure time. Images are created for each orbit using a customized software package, ccdlab (Postma & Leahy 2017), by correcting for geometric distortion, flat-field illumination, and spacecraft drift. They are then aligned and combined to create a science-ready image. Photometry is carried out on these final science-ready images.
Details of the observations and photometry of NGC 1261 UVIT images are given in Table 1. The UVIT image created using one NUV N279N and one FUV F172M filter is shown in Fig. 1. In this figure, blue and yellow colours represent UVIT FUV and NUV detections, respectively. In the FUV, we are able to resolve stars up to the centre of the cluster, but in the case of NUV images crowding is present in the central regions. Isolated stellar sources in the UVIT images have FWHM ∼1.2 and ∼1.5 arcsec in the NUV and FUV channels, respectively.
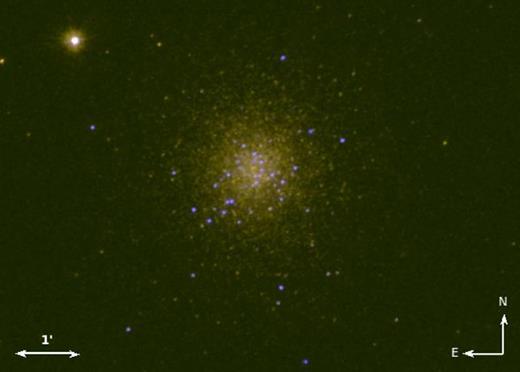
UVIT image of NGC 1261 obtained by combining images in NUV (N279N) and FUV (F172M) channels.
Details of the observations and photometry of NGC 1261.
| Filter | λmean | Δλ | ZP | Exposure | No. of |
|---|---|---|---|---|---|
| (Å) | (Å) | (AB mag) | time (sec) | stars | |
| F169M | 1608 | 290 | 17.45 | 1746 | 486 |
| F172M | 1717 | 125 | 16.34 | 6662 | 2181 |
| N219M | 2196 | 270 | 16.59 | 2847 | 2610 |
| N245M | 2447 | 280 | 18.50 | 740 | 4755 |
| N263M | 2632 | 275 | 18.18 | 1022 | 6037 |
| N279N | 2792 | 90 | 16.50 | 3831 | 9363 |
Point-spread function (PSF) photometry was performed on all UVIT images using the daophot package in iraf (Stetson 1987). The various steps to carry out crowded field photometry are the following. First, stars are identified in the images using the daofind package in daophot. Then, we computed the magnitudes of these stars using the daophot task PHOT. The model PSF was generated by choosing isolated and moderately bright stars. The model PSF generated is then applied to all stars detected, using the ALLSTAR task in daophot to obtain the PSF-fitted magnitudes. A curve-of-growth analysis technique was carried out to estimate the aperture correction value in each filter and it was applied to the PSF-generated magnitudes. Finally, saturation correction (for more details, see Tandon et al. 2017b) was performed to obtain final magnitudes in each filter. The instrumental magnitudes have been calibrated to the AB magnitude system by using zero-point magnitudes as reported in the calibration work (Tandon et al. 2017b). Fig. 2 shows the PSF fit error plots for all filters as a function of magnitude. We detect stars as faint as 21st magnitude in the NUV and 22nd magnitude in the FUV, with typical errors of 0.2 and 0.3 mag, respectively.
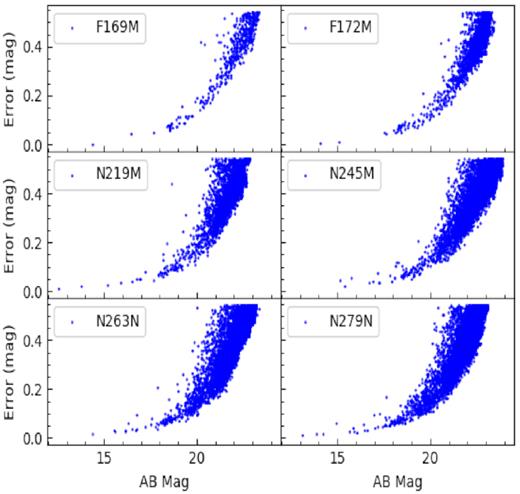
PSF fit errors as a function of magnitude for the UVIT observations of NGC 1261. The top two panels show the plot for two FUV filters, whereas the bottom four panels show the plot for the NUV filters.
3 THE UV AND OPTICAL COLOUR–MAGNITUDE DIAGRAMS
CMDs are a very important tool to identify different evolutionary sequences in star clusters. As we have observed this cluster in four NUV and two FUV filters of UVIT, a large number of CMDs using various filter combinations are possible. In order to identify stars in the inner region (within a diameter ∼3.4 arcmin), we have used the HST UV legacy survey catalogue of GCs (Nardiello et al. 2018) to cross-match with UVIT detected sources. The most likely members of this cluster in the inner region have a proper-motion probability of more than |$90{{\ \rm per\ cent}}$|, as mentioned by Nardiello et al. (2018). In order to cross-match UVIT detected sources with HST data, first we selected stars with proper-motion membership probability of more than |$90{{\ \rm per\ cent}}$|. In HST, the filters F606W and F814W are proxies for the V and I bands. To cross-match HB stars and BSSs, we have used specific colour and magnitude ranges in the optical HST CMD. In the F606W−F814W versus F814W HST CMD, we have used the −0.1 < F606W−F814W < 0.7 and 15 < F814W < 20.5 ranges for HB stars and 0 < F606W−F814W < 0.4 and 17.3 < F814W < 19.5 ranges for BSSs. Two stars appearing at the faint end of the blue tail of the HB in the optical CMD shown in Fig. 3 are also present in the colour–colour plot created for this cluster by Brown et al. (2016, see their fig. 5). The Vega magnitude system used in HST is converted into the AB magnitude system, in order to adopt the same magnitude system.1 The magnitude system used to create optical CMDs in the inner and outer regions is the Vega magnitude system, but both photometric systems are different. Clement et al. (2001), Salinas et al. (2016), and Arellano Ferro et al. (2019) have studied the variability of stars in this cluster. To identify variable stars such as RR Lyrae and Sx Phe, we have cross-matched UVIT data with the variable star catalogue from Arellano Ferro et al. (2019). In NUV bands, our sample of HB stars is not complete in the inner region, as we are unable to resolve stars in the inner 1-arcmin diameter region due to crowding, whereas outside this region we detect about 90 per cent of stars compared with HST. The total number of detected HB, BSS, and variable stars in each UVIT filter is tabulated in Table 2. The optical and UV–optical CMDs are shown in Figs 3 and 4, respectively. The photometric error bars shown in Figs 4 are the medians of the photometric errors of stars in the selected magnitude ranges. In the UV–optical CMDs, we observe that the HB stars no longer follow the horizontal sequence as found in the optical CMDs, instead following a diagonal sequence with less spread (Busso et al. 2007; Dalessandro et al. 2008, 2011; Dieball et al. 2009, 2010; Raso et al. 2017; Subramaniam et al. 2017; Sahu et al. 2019). However, note that the sequence of BSSs, if diagonal, remains unaltered in both UV–optical and optical CMDs.
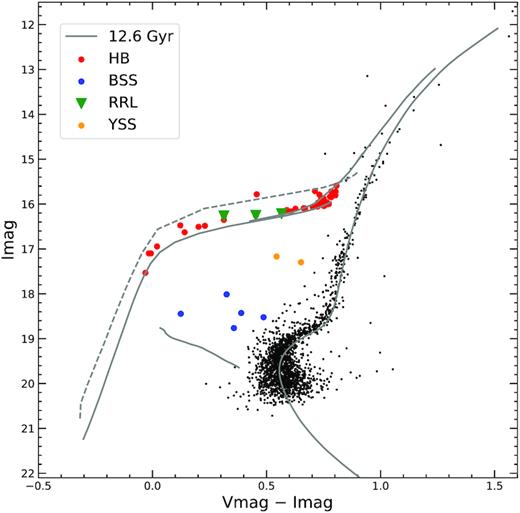
![Optical CMD of NGC 1261 for the region covered by HST. Black dots represent the HST detected stars with proper-motion membership probability more than 90 per cent. Only HB and BS stars detected in the NUV N279N filter and cross-matched with the HST catalogue are shown by different colours, which are explained in the figure. Variable stars such as RR Lyrae and SX Phe are also shown in the figure. The solid grey lines denote updated BaSTI-IAC model isochrones for 12.6 Gyr and [Fe/H] = −1.27 dex. The solid grey line on the HB locus is the zero-age HB (ZAHB) and the dotted one represents the terminal-age HB (TAHB), where the star has completed 99 per cent of its He-burning lifetime. We also show the BSS model line, which is an extension of the zero-age main sequence (ZAMS).](https://oup.silverchair-cdn.com/oup/backfile/Content_public/Journal/mnras/501/2/10.1093_mnras_staa3758/2/m_staa3758fig3.jpeg?Expires=1750429824&Signature=PrBCj4tldqgu2ML10h7qNihGcG4oZBAfBev7A8REIdYsMKVHG-2QpukxE-mORPoSAjfrkIxgB7TOJqGv0236uA-vi0JQ8p~bLM0qbOQl4wYzRiC~V3hnIvtsyVrFzyZoevqC6xaHXhnkriR5EddjJfVAi7TatQU3lsyR2AN7Rvujadrrdn7Q5Upp2VSNNlyGhHiCaliaUnLBMFgNaI4nXYLxPTCBZunhSZEhcnofIqGf6Kr2hZbWtqGWpabRLl5xD27X4QBBEK7eCgFED9Dq0G9YUz56x7lYbal5OoFq1juEWajPdNIpronYRFm8sWwCQki~kI9rqlk3-8cJT6dJSA__&Key-Pair-Id=APKAIE5G5CRDK6RD3PGA)
Optical CMD of NGC 1261 for the region covered by HST. Black dots represent the HST detected stars with proper-motion membership probability more than 90 per cent. Only HB and BS stars detected in the NUV N279N filter and cross-matched with the HST catalogue are shown by different colours, which are explained in the figure. Variable stars such as RR Lyrae and SX Phe are also shown in the figure. The solid grey lines denote updated BaSTI-IAC model isochrones for 12.6 Gyr and [Fe/H] = −1.27 dex. The solid grey line on the HB locus is the zero-age HB (ZAHB) and the dotted one represents the terminal-age HB (TAHB), where the star has completed 99 per cent of its He-burning lifetime. We also show the BSS model line, which is an extension of the zero-age main sequence (ZAMS).
![UV–optical CMDs of NGC 1261 after cross-matching HST data with UVIT data in four NUV and two FUV filters. The meaning of different colours and symbols is shown in the panels. The photometric errors in magnitude and colour are also shown in each panel. The grey lines denote the updated BaSTI-IAC model isochrone for 12.6 Gyr and [Fe/H] = −1.27 dex. The solid and dotted grey lines are the ZAHB and TAHB, respectively.](https://oup.silverchair-cdn.com/oup/backfile/Content_public/Journal/mnras/501/2/10.1093_mnras_staa3758/2/m_staa3758fig4.jpeg?Expires=1750429824&Signature=cFjidPhuaC8LhgfKw15unISxNLYrTxuQ76Zo173oEYTYYZr8c7a5GRT9j13enzE6heMEhHpxyvcMlaIKndQc1DpQcDmtL0dbOqV6niKQgyy136bhiBMdi6AQo2cMzS1YGSdAUsDfrZMcqiK~PWaYikWkqXWm40kFiUoYzhEMH471e3khOMHMnm6Kul6~SbCPkkz90ayiSSgUx9Lz~OWjnQY4YAgn2GWD0d5N36s7x6tf-kpIjDKIqGCnJhyRPMTdQrPA6XymIlxN8cpebyvi2WCNugfCuEHDWbIM8ndym4Xz2Dwr9a7c-XxNjd9E93VSiWZwuY2X40S1b1NgHhsCfg__&Key-Pair-Id=APKAIE5G5CRDK6RD3PGA)
UV–optical CMDs of NGC 1261 after cross-matching HST data with UVIT data in four NUV and two FUV filters. The meaning of different colours and symbols is shown in the panels. The photometric errors in magnitude and colour are also shown in each panel. The grey lines denote the updated BaSTI-IAC model isochrone for 12.6 Gyr and [Fe/H] = −1.27 dex. The solid and dotted grey lines are the ZAHB and TAHB, respectively.
Number of detected HB stars and BSSs in different UVIT filters. Here NHB, NBSS, NRRL, and NSxPhe represent the number of detected HB, BSS, RRL, and Sx Phe stars, respectively. The numbers of stars detected in the outer region (> 3.4 arcmin diameter) are shown in parentheses.
| Filter | NHB | NBSS | NRRL | NSxPhe |
|---|---|---|---|---|
| F169M | 59(9) | 41(1) | 10(1) | 1 |
| F172M | 97(11) | 55(2) | 15(3) | 1 |
| N219M | 196(40) | 71(8) | 19(4) | 2 |
| N245M | 216(46) | 75(7) | 19(4) | 2 |
| N263M | 222(47) | 62(8) | 19(4) | 1 |
| N279N | 221(46) | 70(7) | 18(3) | 3 |
| Filter | NHB | NBSS | NRRL | NSxPhe |
|---|---|---|---|---|
| F169M | 59(9) | 41(1) | 10(1) | 1 |
| F172M | 97(11) | 55(2) | 15(3) | 1 |
| N219M | 196(40) | 71(8) | 19(4) | 2 |
| N245M | 216(46) | 75(7) | 19(4) | 2 |
| N263M | 222(47) | 62(8) | 19(4) | 1 |
| N279N | 221(46) | 70(7) | 18(3) | 3 |
The optical and UV–optical CMDs are overlaid with updated BaSTI-IAC isochrones (Hidalgo et al. 2018). The updated BaSTI-IAC2 isochrones are generated for an age of 12.6 Gyr (Kharchenko et al. 2013), a distance modulus of 16.21 mag (Arellano Ferro et al. 2019), and a metallicity of [Fe/H] = −1.27 dex (Carretta et al. 2009) with helium abundance Y = 0.247, [α/H] = 0, including overshooting, diffusion, and mass-loss efficiency parameter η = 0.3. The BaSTI-IAC model also provides a HB model, which includes the zero-age HB (ZAHB), post-ZAHB tracks, and the end of the He phase, known as the terminal-age HB (TAHB), with or without diffusion for a particular mass range. We generated the ZAHB and TAHB tracks for metallicity [Fe/H] = −1.27 dex including diffusion. The BaSTI-IAC model does not provide the BSS model line. In order to define the location of BSSs in CMDs, we used BaSTI isochrones (Pietrinferni et al. 2004) generated using the fsps code of Conroy, Gunn & White (2009) and Conroy & Gunn (2010). The observed UVIT stellar magnitudes are corrected for reddening and extinction. We have adopted a reddening E(B−V) of 0.01 mag from Kharchenko et al. (2013) and a ratio of total-to-selective extinction R|$v$| = 3.1 from Whitford (1958) for the Milky Way. The extinction coefficient in the visible is AV = 0.031 mag. AV is used to determine extinction coefficients Aλ for all passbands using the reddening relation of Cardelli, Clayton & Mathis (1989). The BS sequence shown in optical as well as in UV CMDs is the extension of the zero-age main sequence (ZAMS). It should roughly follow the ZAMS up to twice the turn-off mass if BSSs are the product of mergers between two MS stars. The MS turn-off mass in NGC 1261 is approximately 0.8 M⊙. The brightest and faintest parts of the BS sequence shown in all CMDs correspond to 1.6 M⊙ and 1.1 M⊙, respectively.
In Fig. 4, the top two panels display the FUV–optical CMDs generated using the F169M and F172M filters. The overlaid isochrone helps in defining the location of HB stars and BSSs, which span a large range in colour and magnitude compared with the optical CMDs, suggesting FUV–optical CMDs have better resolution in colour at a given magnitude. HB stars bluer and redder than the RR Lyrae stars are detected in the FUV, suggesting that BHB and RHB stars are detected. The HB sequence is well aligned with the isochrone, suggesting that the predicted and observed FUV magnitudes match well. In the FUV, the BSSs are found to span a large range in magnitude for a given colour, and vice versa. The remainder of the four panels show the NUV–optical CMDs. In the NUV–optical CMDs in Fig. 4, we find that the BSSs are as hot as blue HB stars and they also span a wide range in colour and magnitude in all the NUV CMDs. We have detected a full HB population in all NUV–optical CMDs. The HB population appears as a tight sequence more-or-less aligned with the isochrone. In the case of CMDs created using the N245M, N263M, and N279N filters, the red end of the HB is fainter than the isochrone. As the photometric errors are also large at this limiting magnitude, our data are only suggestive. We also note that the same stars are fainter than the isochrone in both CMDs where N263M and N279N magnitudes are shown. In all CMDs, we have detected two stars at the blue extreme end of the HB. These stars are quite separated from the observed HB sequence and are likely to be very hot HB stars, as suggested by their UV–optical colour.
To identify stars in the outer region of the cluster, UVIT-detected stars were first cross-matched with Gaia proper-motion membership data provided by Bustos Fierro & Calderón (2019), followed by cross-matching with ground-based photometric data (Kravtsov et al. 2010). Here, the photometric system adopted to create the optical CMD is the standard Johnson–Cousins photometric system. To generate UV–optical CMDs, we have converted the Vega magnitude system into the AB magnitude system using the photometric calibration mentioned in Blanton & Roweis (2007). Our sample of HB and BSSs detected with UVIT is 90 per cent complete in the outer region, compared with the number of stars detected with Gaia. The 10 per cent of stars that are not detected are fainter than the detection limit of UVIT. Figs 5 and 6 present the optical and UV–optical CMDs, respectively. The photmetric error bars shown in Fig. 6 are calculated in a similar way as stated earlier. We see clearly that fewer HB stars and BSSs are detected in the outer region of the cluster (outside 3.4-arcmin diameter), compared with the inner region. More stars are detected in the NUV compared with the FUV. We detect only BHB stars in the FUV passbands and both BHB and RHB stars in all the NUV passbands. We have also detected yellow straggler stars (YSS), identified based on their location in the optical CMD (Fig. 5). We also detect much fewer BSSs in the outer region compared with the inner region of the cluster. We notice that the BSSs detected are all redder than the predicted BSS line, though this could be an artefact due to the lesser number of BSSs detected. A comparison of the number of HB stars and BSSs detected in the inner and outer regions suggests that these stars may be segregated towards the centre of the cluster.
Optical CMD of NGC 1261 for the region outside the HST field. HB and BS stars are detected in the NUV N279M UVIT filter and cross-matched with ground-based photometric data (Kravtsov et al. 2010) and Gaia data are marked with different colours. The rest of the stars shown with black dots are ground-based data cross-matched with Gaia data. Other details are the same as in Fig. 3.

4 SPECTRAL ENERGY DISTRIBUTIONS OF BRIGHT HB STARS
We have used Kurucz stellar atmospheric models to generate SEDs (Castelli, Gratton & Kurucz 1997; Castelli & Kurucz 2003) for the bright HBs, covering the UV to IR wavelength range. We fixed the value of metallicity at [Fe/H] = −1.5, close to the cluster metallicity, and used a range of effective temperatures from 5000–50000K and a corresponding log g from 3–5 dex for the adopted Kurucz models to fit the SED of HBs (see fig. 19 in Pandey et al. 2001). We have combined six UVIT photometric data points with five HST photometric data points from Nardiello et al. (2018) to generate the SED for UV-bright HB stars detected in the inner region of the cluster. For those detected in the outer region of the cluster, the photometric data points of UVIT (six passbands) with Gaia (three passbands: Gaia Collaboration 2018) and ground photometry (four passbands: Kravtsov et al. 2010) were combined. As errors in the HST measured flux are small, which inflates the χ2 value for the HST data points, we assumed no error, which does not impact the fit parameters. In the case in which there are photometric data points with zero observational error, VOSA assumes the biggest relative error present in the SED. VOSA makes use of the Fitzpatrick reddening relation (Fitzpatrick 1999; Indebetouw et al. 2005) to correct for extinction in the observed data points. The extinction-corrected VOSA magnitudes are in good agreement with those described in Section 3.
The best SED fits were obtained for 26 HB stars, out of which two are EHB stars and 24 are BHB stars. The SEDs of two EHB stars are shown in Fig. 7. The estimated values of parameters Teff, |${R}/{\rm R_{\odot }}$|, and |${L}/{\rm L_{\odot }}$| corresponding to the best-fitting Kurucz model spectrum, along with the errors for 26 HB stars, are shown in Table 3. In the left panel of Fig. 7, we notice that the observed data points are fitted well by the Kurucz model spectrum, but, in the case of the EHB2 star, three UVIT data points are not fitted with the model spectrum. There seems to be some amount of excess flux in these UVIT filters, as also reflected in Fig. 4. We excluded these three data points to make a good fit of the observed data points to the Kurucz model spectrum. The high temperatures of EHB1 (31000K) and EHB2 (31000K) suggest that they belong to the class of EHB stars (Heber 1986). The BHB stars exhibit a range of temperature, 8000–12750K, including one star with 12750K. The SEDs of these stars are presented in Appendix A.
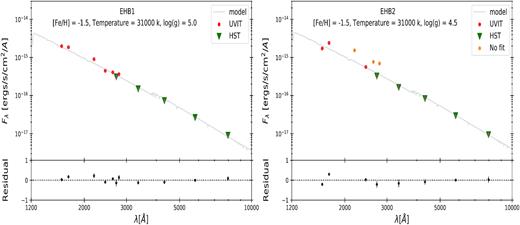
Spectral energy distribution (SED) of EHB1 and EHB2 stars after correcting for extinction. The best-fitting parameters are shown in the figure.
SED fit parameters of bright HB stars detected using UVIT data.
| Star ID | RA (deg) | Dec. (deg) | Teff (K) | |${L}/{\rm L_{\odot }}$| | |${R}/{\rm R_{\odot }}$| | |${\chi }_{\rm red}^2$| |
|---|---|---|---|---|---|---|
| EHB1 | 48.04181 | −55.20597 | 31000 ± 500 | 38.92 ± 1.09 | 0.21 ± 0.01 | 2.7 |
| EHB2 | 48.07732 | −55.22445 | 31000 ± 500 | 41.28 ± 0.9 | 0.22 ± 0.01 | 8.6 |
| BHB1 | 48.07928 | −55.22457 | 12750 ± 125 | 44.26 ± 1.64 | 1.36 ± 0.03 | 4.6 |
| BHB2 | 48.09452 | −55.2267 | 11000 ± 125 | 43.46 ± 1.96 | 1.79 ± 0.04 | 6.9 |
| BHB3 | 48.08742 | −55.22956 | 11750 ± 125 | 48.75 ± 2.58 | 1.69 ± 0.04 | 2.9 |
| BHB4 | 48.06405 | −55.21413 | 11250 ± 125 | 42.77 ± 1.87 | 1.71 ± 0.04 | 3.6 |
| BHB5 | 48.07904 | −55.21753 | 11250 ± 125 | 45.97 ± 2.25 | 1.79 ± 0.04 | 4.3 |
| BHB6 | 48.05424 | −55.21919 | 11000 ± 125 | 46.91 ± 1.87 | 1.89 ± 0.04 | 4.5 |
| BHB7 | 48.05896 | −55.21738 | 10500 ± 125 | 49.12 ± 2.51 | 2.11 ± 0.05 | 7.3 |
| BHB8 | 48.08082 | −55.22729 | 10000 ± 125 | 46.70 ± 2.09 | 2.23 ± 0.05 | 6.3 |
| BHB9 | 48.06626 | −55.21944 | 9500 ± 125 | 47.28 ± 2.06 | 2.52 ± 0.06 | 6.8 |
| BHB10 | 48.06391 | −55.21627 | 9250 ± 125 | 44.54 ± 1.59 | 2.59 ± 0.06 | 5.9 |
| BHB11 | 48.04864 | −55.21555 | 9250 ± 125 | 56.64 ± 1.89 | 2.94 ± 0.07 | 4.2 |
| BHB12 | 48.05479 | −55.22369 | 8750 ± 125 | 48.88 ± 1.41 | 3.05 ± 0.07 | 3.6 |
| BHB13 | 48.10376 | −55.21723 | 8500 ± 125 | 49.55 ± 1.57 | 3.23 ± 0.08 | 5.0 |
| BHB14 | 48.08487 | −55.22036 | 8750 ± 125 | 49.63 ± 1.83 | 3.08 ± 0.07 | 2.1 |
| BHB15 | 48.06478 | −55.21766 | 8750 ± 125 | 49.42 ± 1.64 | 3.04 ± 0.07 | 5.5 |
| BHB16 | 48.07389 | −55.22981 | 8250 ± 125 | 49.79 ± 1.69 | 3.47 ± 0.08 | 4.1 |
| BHB17 | 48.04274 | −55.22656 | 8000 ± 125 | 51.07 ± 1.85 | 3.73 ± 0.09 | 3.4 |
| BHB18 | 48.06466 | −55.21258 | 8000 ± 125 | 50.06 ± 1.55 | 3.69 ± 0.09 | 5.0 |
| BHB19 | 48.05484 | −55.18698 | 11500 ± 125 | 46.69 ± 3.98 | 1.69 ± 0.04 | 5.7 |
| BHB20 | 48.14102 | −55.20569 | 10000 ± 125 | 47.64 ± 4.98 | 2.28 ± 0.05 | 4.6 |
| BHB21 | 48.01035 | −55.31072 | 9750 ± 125 | 47.85 ± 5.55 | 2.42 ± 0.06 | 3.9 |
| BHB22 | 48.12378 | −55.25798 | 9500 ± 125 | 48.24 ± 7.88 | 2.54 ± 0.06 | 1.8 |
| BHB23 | 47.90097 | −55.23117 | 8750 ± 125 | 59.04 ± 10.44 | 3.32 ± 0.07 | 1.5 |
| BHB24 | 48.14307 | −55.27254 | 8250 ± 125 | 51.27 ± 13.41 | 3.54 ± 0.08 | 1.8 |
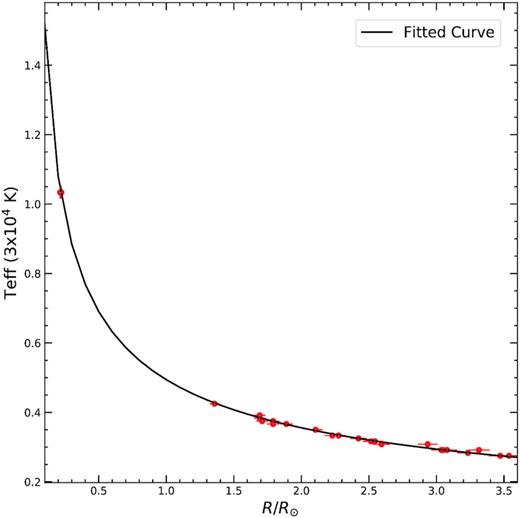
Variation of radius of all bright HB stars with effective temperature, determined from SEDs. Red filled circles represent bright HB stars and the black curve represents the function |$T_{\rm eff} = \frac{0.5}{\sqrt{R}} + 0.002$|, which is the fitted curve to the observed distribution.
In order to check the evolutionary status of EHB stars identified with UVIT, we have plotted the theoretical evolutionary tracks using the models presented by Moehler et al. (2019). The models used in their article were computed by the extension of the PAGB evolutionary models of Miller Bertolami (2016). We have selected a model with metallicity close to the cluster metallicity. The theoretical evolutionary tracks corresponding to different masses, starting from the ZAHB through to a point late in post-HB evolution or a point on the PAGB cooling track, are shown in Fig. 9. The terminal age HB (TAHB) representing the end of the HB phase is shown with a dash–dotted line in Fig. 9. We can see in Fig. 9 that all BHB stars lie along the BHB tracks. Fig. 9 also shows that two EHB stars are indeed found along EHB tracks lying below the TAHB. These two stars therefore do not belong to any of the evolved class of stars, which lie on the hot PAGB cooling sequence. This suggests that the two EHB stars share the properties of BHB stars and therefore can be considered as the extreme extension of the HB. They are therefore still in the HB evolutionary phase. From the model, the masses of these two stars turn out to be approximately 0.5 M⊙, corresponding to the core mass of the stars lying on the HB.
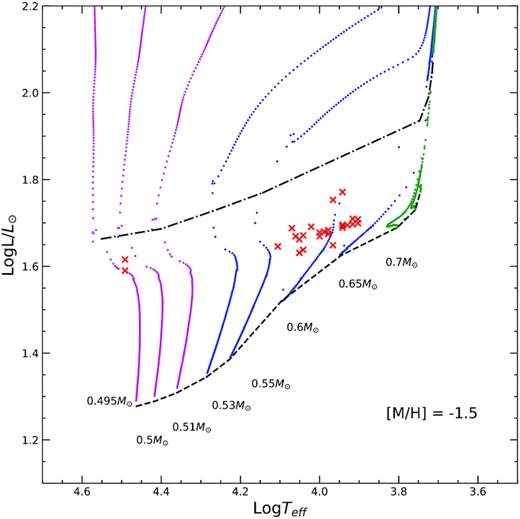
Evolutionary tracks corresponding to different masses with metallicity close to the cluster metallicity. Evolution starting from the HB phase to the moment when a star has entered the post-HB phase (Moehler et al. 2019) are shown. In the plot, magenta, blue, and green colours represent the sequences populating the extreme, blue, and red parts of the HB. Black dashed and dash–dotted lines indicate the ZAHB and TAHB, respectively. Bright HB stars identified with UVIT are shown with red cross symbols.
5 DISCUSSION
In this study, we used data from UVIT on board the Astrosat satellite to create NUV and FUV CMDs and to investigate the morphology of HB stars. UVIT is not able to detect stars in the MS, RGB, and SGB evolutionary phases, since these stars are fainter than 22 mag in the UV. To generate UV CMDs, we cross-matched UVIT-detected stars with HST data for an inner region corresponding to ∼3.4-arcmin diameter and with ground-based data along with Gaia data for the outer region, as UVIT has a large circular field of view of 28-arcmin diameter. The optical and UV CMDs are created for the proper-motion members of the cluster. In all UV–optical CMDs, we find that the HB stars do not show a horizontal distribution, as found in the optical CMDs. This is due to the fact that the HB stars cover a range of temperatures and the flux in UV passbands is more sensitive to temperature than in the optical. The HB feature is therefore found to be slanting and is similar to that found in the GALEX UV CMDs obtained by Schiavon et al. (2012). They suggest that the slope of the HB is mainly a result of bolometric correction effects. Dalessandro et al. (2013) investigated the HB morphology of three GCs, namely M3, M13, and M79, using HST data in optical and UV bandpasses, and they also found a similar HB distribution in far-UV CMDs (see their fig. 2). The UV magnitude distribution of the HB stars is found to match closely with the overplotted isochrone, within the error, in all UV–optical CMDs. As we detect the full stretch of the HB, including the RHB, RRL, and BHB, we find a good match for the UV magnitudes between observations and the updated BaSTI-IAC models.
A large gap is observed between EHBs and BHBs and this needs to be explored. However, in massive and very dense GCs such as NGC 2808, NGC 6752, and ω Cen, a large number of EHB stars are found with a well-defined sequence in optical CMDs. In less massive clusters, they are fewer in number and are hard to detect at the faint end of the HB in optical CMDs. In these cases, UV CMDs play an important role, since EHB stars are bright in UV CMDs and also follow a separate sequence. Those clusters with a few stars bluer than the M-jump are NGC 5466, NGC 6981, NGC 3201, NGC 2298, etc. (see fig. 5 in Brown et al. 2016). We have detected a full HB in the NUV and only hot HB stars in the FUV. Two EHB stars are also identified in all UV–optical CMDs, which have bluer colours compared with other hot HB stars. Vanderbeke et al. (2015) studied 48 Galactic GCs to explore the radial distribution of multiple stellar populations known to exist in clusters. They identified six EHB stars in NGC 1261, which may or may not be members of the cluster. They also used different selection criteria to select different HB subpopulations. The HB stars identified by UVIT are proper-motion members of the cluster, including the two EHB stars.
Bright HB stars are found to have a range of temperatures, from 8000–12 750K, with the hot end very close to the G-jump (Grundahl et al. 1999: Teff = 11 500K), in the HB distribution. One star is found to have 12750K, along with two hotter stars. The hot end of the HB distribution therefore coincides with the G-jump in this cluster. There is only one star slightly hotter, and there is no further extension of the HB to the EHB beyond the G-jump. Therefore, we do not detect the M-jump (Momany et al. 2002, 2004), expected at ∼23 000K. Instead, we detect two stars with Teff = 31 000K. These coincide with the Teff expected for the gap between the EHB and blue-hook stars. The cluster NGC 1261 therefore has an HB distribution truncating at the G-jump at the hot end, with the presence of two EHB stars.
With the estimation of the surface parameters of the BHB stars, we are able to derive a relation between the temperature and radius, as the bolometric luminosity is found to be almost the same for these stars. We find that the temperatures and radii of the two EHB stars agree with the relation derived above, suggesting that they can be considered as the extreme end of the HB population. Thus, in this cluster the EHB stars are normal core He-burning stars like other HB stars and are not in any different evolutionary phase. This is supported by their position in the HR diagram overlaid with isochrones. It must be noted that these two EHB stars may be starting to evolve off from the HB.
The canonical picture of EHB stars was established by Heber (1986), in which EHB stars are helium core-burning stars with masses close to the core helium flash mass of 0.47 M⊙ and an extremely thin hydrogen envelope, not more than 1|${{\ \rm per\ cent}}$| by mass. Our estimation of masses for the detected EHB stars matches well with this definition. Although the evolution of EHB stars after the exhaustion of helium in the core is better understood, the formation pathways that lead to the EHB are much less understood. Many studies have explored the binary nature of EHB stars and a wide variety of companions are found, as the binary fraction among EHB stars is found to be much higher than for normal stars. The way in which the envelope is lost is mostly attributed to binary interactions, depending on the mass ratio of the system. Lei et al. (2015) suggested that a tidally enhanced stellar wind in binary evolution is able to provide the enhanced mass loss on the RGB needed for the late hot-flash scenario to explain the formation of blue-hook stars. They have adopted different initial orbital periods for binaries to explain the formation of canonical HB and blue-hook stars. The EHB stars detected in this cluster are likely to be single stars, as suggested by the SEDs. The SEDs are fitted well by a single spectrum with minimum residual across the wavelength range. It is proposed by Castellani & Castellani (1993) that a delayed helium flash (HEF) is a promising scenario to explain the existence of EHB stars. Due to high mass loss during the RGB evolutionary phase, a star will lose so much envelope mass that it will not be able to ignite the helium flash at the tip of the RGB, thus evolving towards the WD cooling sequence with an electron degenerate core. Depending on the residual mass of the envelope, a star will undergo a He flash either at the bright end of the WD cooling sequence, known as an early hot flasher (EHF), or along the WD cooling sequence, known as a late hot flasher (LHF). After the He flash, these stars will settle on a blue hook at the hot end of the HB. As these stars have hugely reduced envelope mass, they will be much hotter than their counterparts on the canonical ZAHB. D’Cruz et al. (1996) also suggested a hot He-flash scenario to explain the origin of EHB stars in globular clusters. Cassisi et al. (2003) computed models of Population II low-mass stars through the helium-flash mixing (HEFM) phase, suggesting the HEFM scenario as a plausible explanation for the existence of blue-hook stars.
Here we summarize the possible scenarios for the formation of single EHB stars. Webbink (1984) and Saio & Jeffery (2000) suggested the merger of two He-core WDs as a possible mechanism. Another possibility is the trigger of CE ejection by a giant planet, which evaporates in the process (Soker 1998). The fraction of close binaries among the EHB stars in GCs is found to be very small (Moni Bidin et al. 2006, 2009, 2011). It is possible that, in old systems like GCs, WD–WD mergers may likely result in the formation of EHB stars: as a consequence they are single stars. If these two stars are the product of mergers of two He-core WDs, then they can be helium-rich, which will lead to a higher effective temperature compared with that estimated using Kurucz stellar atmospheric models (Schonberner & Drilling 1984). Another model suggested for EHB star formation is primordial enrichment in helium (D’Antona et al. 2002). In this scenario, EHB stars are produced via the normal evolution of He-enriched subpopulations in GCs. These subpopulations might have formed out of material polluted by the ejecta from massive AGB stars. For a given age and metallicity, He-enhanced stars have smaller masses than He-normal stars, resulting in a bluer HB morphology. A supersolar surface He abundance cause huge mass loss in the RGB phase by increasing the RGB tip luminosity, but the phenomena responsible for a huge He enhancement invoke non-canonical mixing during the RGB stage and dredge-up induced by H-shell instabilities (Sweigart & Mengel 1979; von Rudloff, Vandenberg & Hartwick 1988; Sweigart 1997; Denissenkov & VandenBerg 2003). The discovery of multiple stellar populations in GCs opened a new frontier, as one of the causes is variation in helium enrichment, with blue HB stars being produced by helium-rich stars (Bedin et al. 2004; Piotto et al. 2005, 2007, 2012, 2015). Models of multiple populations with different helium abundances successfully reproduce both MS splitting and the multimodal HB morphology of both ω Cen (Lee et al. 2005) and NGC 2808 (D’Antona et al. 2005). He-enhancement thus represents a promising model, an alternative to the binary scenario, for the formation of EHB stars in GCs. We find that both the EHB stars are single stars and we estimate their masses to be 0.495 M⊙, which is quite close to the theoretical estimate for EHB stars. The possible formation mechanism for these stars is likely to be enhanced mass loss in the RGB phase, due either to rotation or enhanced helium (primordial or mixing).
Comprehensive studies of EHB and blue-hook stars by Brown et al. (2001, 2010) suggest that these stars could be produced by a delayed helium flash after the RGB, and they are termed as early hot-flashers and late hot-flashers. In the case of early hot-flashers, a star ignites helium during evolution to the top of the WD cooling curve. Flash mixing will not happen between the envelope and the core of a star, as the high entropy of a strong hydrogen-burning shell acts as a barrier that prevents flash convection from penetrating into the envelope. Hence, the envelope mass or composition of a star will remain unchanged, which leads to more or less the same luminosity compared with canonical HB stars (see figs 1 and 4 in Brown et al. 2010). The late hot-flash scenario results in flash mixing between the hydrogen envelope and the helium core, which increases the helium and carbon abundances in the envelope. Flash mixing lowers the luminosity of a star with respect to a canonical EHB star. The EHB stars of this cluster are not subluminous with respect to the BHB stars and hence are unlikely to be late hot-flashers. These stars therefore could be early hot-flash objects, which follow the properties of canonical HB stars. Spectroscopic observations are required to explore the nature of these two stars and validate the formation scenarios described above. Since there is not enough mass for a hydrogen shell surrounding the core in EHB stars, these stars are likely to evolve directly to the white dwarf phase.
All the BSSs detected occupy a region parallel to the HB sequence, as well as spanning a wide range in both colour and magnitude, in the UV–optical CMDs. In general, the temperature of BSSs ranges from 6000–8000 K, but in this cluster we notice that some of the BSSs have colours similar to BHB stars, which in turn implies that BSSs may be as hot as BHB stars. We detected a few BSSs in the outer region of the cluster beyond the half-mass radius (r>rh). These BSSs might have formed through mass transfer in close binary systems, which dominates in a low-density environment. Mass-transfer models are required to confirm this. We also detect two YSSs in the outer part of the cluster. We plan to construct the SEDs of the BSSs as well as the YSSs to understand the properties of these stars.
6 SUMMARY AND CONCLUSIONS
In this work, we present the photometric results of NGC 1261 imaged using UVIT on Astrosat. The advantage of using UVIT over HST is its large field of view, covering the full cluster region, and that over GALEX is its good spatial resolution and multiple filters. We have characterized the HB member stars in this cluster for the first time using UVIT, HST, ground-based, and Gaia data. Below, we summarize the important results from this study.
We constructed optical and UV–optical CMDs of member stars and overlaid these with isochrones generated for the respective filters. We detected only BHB and two EHB stars in the FUV CMDs, whereas the full HB is detected in NUV CMDs. We also detected BSSs spanning a wide range in magnitude as well as in colour in NUV CMDs.
The effective temperatures, luminosities, and radii of 24 BHB and two EHB stars are estimated by generating SEDs using multiwavelength data. Teff for BHB stars ranges from 8000–12750K, whereas EHB stars have Teff of more than 30000K.
Keeping L constant, we fitted a R versus Teff relation for the BHB stars, which is found to fit the EHB stars as well. Their location in the HR diagram overlaid with isochrones confirms that they are EHB stars with mass ∼0.5M⊙.
Based on results from the UVIT study of this cluster, we conclude the following.
Most of the RHB stars are too faint to be detected by UVIT in FUV filters. HB stars form a tight sequence in the UV–optical CMDs, which is largely fitted by the BaSTI-IAC isochrones.
The EHB stars in this cluster are likely to be single stars. We constrain the formation pathways of these single EHB stars to extreme mass loss in the RGB phase (due either to rotation or enhanced helium) or an early hot-flash scenario.
ACKNOWLEDGEMENTS
We are thankful to the reviewer for thoughtful comments and suggestions, which improved the quality of the manuscript. The UVIT project is a result of collaboration between IIA, Bengaluru, IUCAA, Pune, TIFR, Mumbai, several centres of ISRO, and CSA. This publication uses data from the Astrosat mission of the Indian Space Research Organisation (ISRO), archived at the Indian Space Science Data Centre (ISSDC). We thank Iván H. Bustos Fierro for providing us with Gaia proper-motion membership data. This research made use of VOSA, developed under the Spanish Virtual Observatory project supported by the Spanish MINECO through grant AyA2017-84089. This research also made use of topcat (Taylor 2005, 2011), matplotlib (Hunter 2007), numpy (van der Walt, Colbert & Varoquaux 2011), scipy (Oliphant 2007; Millman & Aivazis 2011), astropy (Astropy Collaboration 2018), and pandas (McKinney 2010).
DATA AVAILABILITY
The UVIT data used in this article will be shared on request.
Footnotes
REFERENCES
APPENDIX A: SED FITTING FOR BHB STARS
The procedure of SED fitting for bright HB stars is described in Section 4. The SEDs for 24 BHB stars are shown in Fig. A1.


Spectral energy distribution (SED) of all BHB stars after correcting for extinction. The best-fitting parameters are shown in the figure. The UVIT and HST data points used to create SEDs for stars lying in the region covered by HST are shown by red circles and green triangles, respectively. For stars lying in the outer region, UVIT, ground-based photometric and Gaia data points are shown by red circles, green triangles, and cyan squares, respectively.
