


ABSTRACT
A galaxy moving through a background of dark matter particles induces an overdensity of these particles or a wake behind it. The back reaction of this wake on the galaxy is a force field that can be decomposed into an effective deceleration (called dynamical friction) and a tidal field. In this paper, we determine the tidal forces, thus generated on the galaxy, and the resulting observables, which are shown to be warps, lopsidedness, and/or kinematic-photometric position angle misalignments. We estimate the magnitude of the tidal-like effects needed to reproduce the observed warp and lopsidedness on the isolated galaxy IC 2487. Within a realistic range of dark matter distribution properties, the observed, warped, and lopsided kinematical properties of IC 2487 are possible to reproduce (the background medium of dark matter particles has a velocity dispersion of |$\lesssim 80\, {\rm km\, s^{-1}}$| and the density |$10^4{\!-\!}10^5\, {\rm M_\odot \, kpc^{-3}}$|, more likely at the lower end). We conclude that the proposed mechanism can generate warps, lopsidedness, and misalignments observed in isolated galaxies or galaxies in loose groups. The method can be used also to constrain dark matter spatial and velocity distribution properties.
1 INTRODUCTION
Asymmetries in the mass and light distribution of galaxies are their well-known characteristics. For instance, Sánchez-Saavedra et al. (2003) found that 54 per cent of their sample of 276 edge-on galaxies are warped. In studies by Richter & Sancisi (1994) and Haynes et al. (1998) about 50 per cent of galaxies have lopsided gas distributions1; Zaritsky & Rix (1997) and Rix & Zaritsky (1995) showed that 30 per cent of their sample of nearly face-on spiral galaxies have lopsided stellar discs. Thus, this kind of asymmetry is a wide spread and well-established property of galaxies. However, its origin and evolution is not theoretically fully understood.
As a galaxy moves through a background medium of dark matter (DM) particles, its gravitational potential induces a density wake in the surrounding medium. This DM wake generates a force field in the galaxy that can be decomposed into an effective deceleration of the galaxy, usually referred as dynamical friction (DF) and a tidal field (Mulder 1983). This work studies whether this tidal field is able to cause asymmetries, such as lopsidedness and/or warps, in galaxies. There is not a unique mechanism responsible for lopsided kinematics, lopsided mass distribution in galaxies, or warp formation. Rather, several mechanisms can be invoked (Shen & Sellwood 2006; Mapelli, Moore & Bland-Hawthorn 2008; Dubinski & Chakrabarty 2009; Jog & Combes 2009). Lopsided galaxies have been observed in clusters and groups of galaxies, as well as in isolated galaxies. By quantifying the correlation of lopsidedness with any of galactic property, we might better understand the mechanisms responsible for it. In particular, lopsidedness does not correlate with the presence of a companion (Bournaud et al. 2005) and it has only slight correlation with the internal structure of the galaxy, e.g. intensity of spiral structure (Zaritsky et al. 2013). Also, lopsidedness is higher in the outer parts of galaxies and the phase of the first Fourier component of the surface density remains constant with radius (van Eymeren et al. 2011), which suggests that lopsidedness is a global feature (Jog 1997). In the following, we briefly describe the main explanations for lopsidedness and their assessments. For a detailed review, we refer the interested reader to Jog & Combes (2009).
Encounters with nearby companions including tidal forces imparted by flyby galaxies (Mapelli et al. 2008) or minor mergers (Zaritsky & Rix 1997) can induce lopsidedness both on the inner kinematics and mass distribution of galaxies. This mechanism is disfavoured in the case of isolated galaxies due to the lack of companions. However, for isolated galaxies it cannot be ruled out for a long-lived lopsided mode (van Eymeren et al. 2011).
Gas accretion from cosmological filaments in a particular direction causes elongation of the mass distribution in this direction and, thus, it can cause lopsidedness. This mechanism leaves a signature in the kinematics since the tip of the asymmetry has motions equable to the escape velocity. However, lopsidedness in the kinematics is observed at the scale of rotational velocities. In addition, gas accretion does not produce noticeable radial velocity differences, as it would be expected, for instance, in the case of a recent infall (Baldwin, Lynden-Bell & Sancisi 1980). Hence, this explanation generally does not satisfy well, although in some galaxies their asymmetries can be explained by a strong and constant accretion (Bournaud et al. 2005).
Another viable explanation for the lopsided geometry of a galaxy is that its DM halo is asymmetric. Thus, the disc’s response to the halo potential causes the lopsided behaviour of the disc (Jog 1997; Zaritsky et al. 2013). At present, the DM halo asymmetry explanation seems one of the most promising explanations to lopsidedness since it can match observations well (Jog & Combes 2009), although the stability of the lopsidedness is a concern, and the lifetime of the lopsided mode and its origin are correlated. If lopsidedness is treated as a purely kinematic feature, it winds up in a time-scale that is less than a Gyr (Baldwin et al. 1980). However, the disc’s lopsidedness has been shown to be long lived, with a lifetime larger than a Hubble time, if the pattern speed of the lopsided mode is small (Ideta 2002; Saha, Combes & Jog 2007). Saha et al. (2007) demonstrated this using a simulation of a purely exponential disc with no bulge or dark halo components.
Several mechanisms have been invoked to explain warps. Proposed mechanisms include the misalignment between the disc’s rotation axis and the principal axis of a non-spherical DM halo (Sparke & Casertano 1988; Dubinski & Chakrabarty 2009), gas accretion (Ostriker & Binney 1989; Shen & Sellwood 2006), or interactions with companions or satellites (Weinberg & Blitz 2006). The stability of warps is also a concern – on average, they tend to wear off in simulations in a time-scale less than a Gyr (Semczuk et al. 2020).
In this paper, we propose that the DM wake responsible for DF further induces tidal-like effects that might cause asymmetry of the intrinsic dark halo of a galaxy, thus resulting in galaxy lopsidedness and/or other asymmetries such as warps. DF is a drag force that slows down a massive object by exchanging momentum with particles unbound to the object itself. This effective force is created by a collection of particles that have been gravitationally focused behind the object, thus, acting as a density wave which interacts with the massive object gravitationally. Galaxies moving through the extended DM haloes of clusters or groups of galaxies experience DF. For instance, DF pulls the brightest cluster galaxies (BCG) towards the centres of clusters (e.g. Zabludoff, Huchra & Geller 1990). Frictional effects are also experienced by objects orbiting within galaxies. An example is the Large Magellanic Cloud (LMC) which is the most massive satellite of the Milky Way (MW). Recent studies have shown that the gravitational interaction of the MW and the LMC should have left observable imprints in the kinematics of halo stars in our Galaxy (Garavito-Camargo et al. 2019; Erkal, Belokurov & Parkin 2020; Petersen & Peñarrubia 2020).
As a galaxy moves through an external field of DM particles that are not bound to the galaxy itself, the particles are focused behind the galaxy, thus creating a density wake that acts as a potential minimum and exerts tidal forces in the galaxy. In this way, the wake might create asymmetries in both the stellar and gas velocity field and in the distribution of gas and stars in the disc. We test this hypothesis using observations of the isolated galaxy IC 2487 (also called CIG 340).
The properties of the wake depend on the properties of the DM. Fig. 1 schematically shows the formation of the density wake behind the galaxy. The left-hand and right-hand panels differ on the degree of thermal motion (or equivalently the velocity dispersion) of the DM particles. The lower the velocity dispersion, the more concentrated and denser the density wake is. Notice that the wake is quasi-stationary since the passing DM particles do not produce a bound, self-gravitating system. In this work, we do not make any assumption on the origin of the passing DM particles. These might be associated with a particular halo or to the smooth large-scale structure of the Universe.
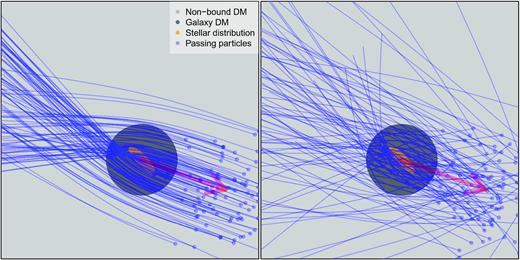
Illustration of the density wake’s production in case of low (left-hand panel) and high (right-hand panel) velocity dispersion of the DM particles. The trajectory of a sample of DM particles is shown in blue, and the red arrow indicates the direction of motion of the galaxy.
The paper is structured as following. In Section 2, we review DF and estimate the magnitude of the tidal-like effects and the asymmetries induced in a galaxy. In Section 3, we apply our results to the IC 2487 galaxy (selected as a test-galaxy). Section 4 is devoted to the discussion and our paper ends with the summary in Section 5.
2 DYNAMICAL FRICTION
The DF in its classical form is an effective force acting on a massive point source and being caused by gravitational forces of particles passing by (denoted further as passing particles). Each particle that passes the massive object slightly changes its trajectory due to the exchange of energy and momentum with the massive point source. The cumulative influence on the point source due to all passing particles is called DF (Chandrasekhar 1943), and it acts as an effective force that slows down the massive source.
The derivation of the DF formula assumes that the source and the target of the effect are the same. This means that the point source that causes the change of trajectory of the passing particles is the same as the object for which the acceleration is calculated. Similar results can be calculated when we do not assume this (although such an elegant analytic solution cannot be achieved). In this paper, we study the response of test-particles inside a massive object which is the source and target of the effective gravitational deceleration.
2.1 Framework and nomenclature
In the classical formula for DF, the cause of the potential is a point source. In this study, we forfeit this assumption and describe the matter distribution that causes the DF using an extended gravitational potential Φ(x). The potential is related to the density distribution via the Poisson equation. In this study, we are not interested in the effect of the DF to the overall source of the potential (e.g. galaxy), but to massless test-particles that co-exist in that potential (e.g. stars in the disc of a galaxy). The acceleration of these test-particles depend on their exact position inside the galaxy. Positions, velocities, and accelerations of test-particles are denoted as x⋆, v⋆, and a⋆, respectively. For simplicity, we assume that the centre of the reference frame is located at the centre of the potential Φ(x).
2.2 Response to a single passing particle
In this section, we estimate how a test-particle that co-exist in the potential Φ(x) responds to an event of particle passing. In this case, we assume that the positions of test-particles change only very little per event and can be ignored. Thus, the only effect results from the increase of its velocity.
2.3 Cumulative response to passing particles
2.4 Tidal field generated by DM wake
Equation (6) describes the acceleration field exerted on a galaxy which is moving through a background medium of DM particles. It is natural to ask if this field, which is the back reaction of the DM wake, has an important effect on the mass distribution and kinematics of the galaxy. Since the relative perturbations induced by DF to the gravitational potential are smaller than those to the density field (Binney & Tremaine 2008; Jog & Combes 2009), we estimate how large are the corrections to the acceleration field of a galaxy due to DF.
For this we select a density distribution corresponding to a test-galaxy being described in detail in Section 3. Our test-galaxy is a disc galaxy with a stellar mass equals to log10M*/M⊙ = 10.36 (|$M_*=2.3\times 10^{10}\, \rm M_{\odot }$|). The magnitude of the tidal field generated by the DM density wake is calculated assuming that the galaxy moves in an environment, where the density and the velocity dispersion of the DM particles can be approximated constant along the path of the galaxy for some time. This field depends on four parameters that are estimated to be (onward denoted as default parameters) DM density |$\rho _{\rm DM} = 10^5\, {\rm M_\odot ~kpc^{-3}}$| (average density of the region the galaxy is moving in), isotropic Gaussian velocity distribution of DM particles with velocity dispersion equals to |$100\, {\rm km\, s^{-1}}$|. The speed of the galaxy with respect to the rest frame of DM particles is |$v_{\rm gal}=100\, {\rm km\, s^{-1}}$| and the angle between the direction of the galaxy’s movement and the stellar disc’s rotation axis is η = 90° (i.e. the galaxy moves edge-on with respect to the background of DM particles). The component of a⋆ in the stellar disc’s plane for the default parameters is shown in Fig. 2. Notice that the acceleration field is depicted in the galactic reference frame, i.e. field given by equation (6) after subtracting the average acceleration acting on the galaxy. The galactic reference frame is centred at the centre of the gravitational potential of the galaxy, Φ(x). The x−y plane coincides with the stellar disc’s plane and the z-axis equals the stellar disc’s rotation axis. The galaxy is moving towards positive x-axis.
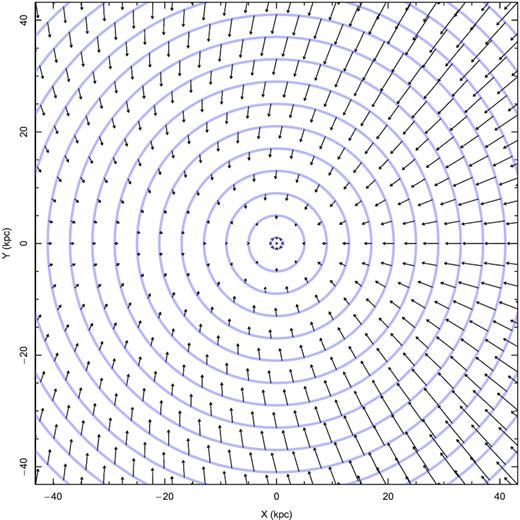
The a⋆ field in the stellar disc’s plane for our test-galaxy with default parameters (see the text for details). The arrows show only the direction of the acceleration, the amplitude has arbitrary overall normalization.
We vary each of the above parameters individually while keeping the others fix to their default values. The specific dependencies on galaxy and environmental properties of the a⋆ component in the disc’s plane are shown in Fig. 3 as a function of galactocentric distance R. From the upper left-hand panel, we can see that the sizes of the bars (which indicate the spread in a⋆ values at given radii) of |a⋆|2 change with the angle between the direction of movement of the galaxy and the stellar disc’s rotation axis. This results from the relative contribution of different vector components. For instance, if the galaxy’s speed and the disc are perpendicular (i.e. η = 0, or face-on movement), all the points in the galactic plane at a given radius are at the same distance from the wake, thus there is axial symmetry (i.e. there are no bars). Furthermore, in this case the outer parts of the disc are pushed upwards (in the disc reference frame) with respect to the inner parts. This might result in U-shaped warps, contrary to S-shaped warps that can be produced when moving with larger η (more edge-on with respect to DM). Indeed, with larger η values, the amplitude of the asymmetry might be different between the two sides of the disc, with the side closer to the amplitude showing a higher amplitude. Thus, L-shaped warps are more likely in this mechanism. Notice that galaxies are known to show asymmetry in the warps (e.g. Saha & Jog (2006)), whose origin is not well-understood. In the case of edge-on movement (i.e. η = 90°), the range of values that |a⋆| takes at constant R is larger. As commonly in the case of tidal forces, each galaxy’s side is accelerated to different directions and, thus, more values are possible. In a subsequent analysis, we will demonstrate that depending on the strength of the disc’s response, some fraction of warps can show both S- and U-shaped behaviour depending on radius.

These figures illustrate dependencies of the magnitude of a⋆’s component in the disc’s plane with respect to different parameters. Black lines represent the galaxy’s acceleration given by equation (1), colourful points correspond to the averaged value of |a⋆| in the galactic reference frame at constant radii and the bars encompass the values this parameter takes at each radii. Indeed, it is this range of values or variation which decides the resulted asymmetry. The panel (a) shows the dependence on the angle between the movement of the galaxy and the stellar disc’s rotation axis (with η = 90° meaning that the galaxy moves edge-on with respect to the DM halo). The panel (b) shows how |a⋆| changes with varying galaxy’s velocity and velocity dispersion of DM particles, but with fixed ratio between these two parameters. The panel (c) shows the DM density dependence, and in the panel (d) the dependence with the DM velocity dispersion is shown. For visualization purposes, the points are slightly shifted in the x-axis.
From the lower left-hand panel of Fig. 3, we see that ρDM acts as a normalization of the tidal field exerted on the galaxy. This can also be seen from equation (6).
From the lower right-hand panel of Fig. 3, it is seen that the acceleration a⋆ is sensitive to the velocity dispersion of DM particles. In most cases, the colder the dark matter particles produce larger a⋆ values, although not always guaranteed to be so. The departure from axial symmetry of a⋆ strongly depends on the relative kinematics between the galaxy’s movement and the velocity dispersion of DM particles. From the bottom right-hand panel, we can see that the colder DM suggests higher a⋆ values, but does not resolve the question, whether the effect originates from velocity dispersion or from the galaxy velocity (i.e. Chandrasekhar formula for DF in isotropic case has no independent velocity dispersion term, but only via ratio of galaxy movement and velocity dispersion). The top right-hand panel of the figure shows the effect of the DM velocity dispersion when it is tied with the galaxy velocity. The trends show increase of DF when velocities are decreased.
2.5 Response of a galaxy to the tidal field
DF acts on systems in very different environments, such as globular clusters in haloes or the planetesimal movement in protoplanetary discs. In this section, we concentrate on DF acting on galaxies moving in a field of DM particles. In particular, we estimate the back response of their stellar disc to the tidal field induced by the DM wake which is responsible for DF.
The tidal field generated by the wake of DM particles modifies the orbits of the stars in the galaxy (see equation 6 and Section 2.4). In most of the cases, a⋆ is non-axisymmetric, therefore the response of the disc might not be trivial to calculate. To estimate the modified outlook of the galaxy, we assume that disc’s stars initially move in circular orbits and we calculate how these orbits change due to the additional a⋆ field given by equation (6).
In any orbit, each orbital segment is observable with a probability proportional to the time an object in this orbit spends in the corresponding segment (Han et al. 2016). This allows to construct the change of the orbit from the initial circular state to the modified state. Therefore, we are able to see the response of the galactic disc to the tidal field.
An example of the orbital families3 used in this work is presented in Fig. 4. For orbit calculations, we use the default parameters from Section 2.4. In the left-hand panel of this figure, it is seen that the outermost orbits are more strongly distorted to lopsided shapes, which is a common observational feature of many galaxies. The right-hand panel illustrates the misalignment of kinematic and photometric major axes of the galaxy (Ψ). Here, the orbit is projected at 35° to bring out the line-of-sight velocity components. The misalignment results in a natural way up to a values where there are difficulties in determining the position angles.
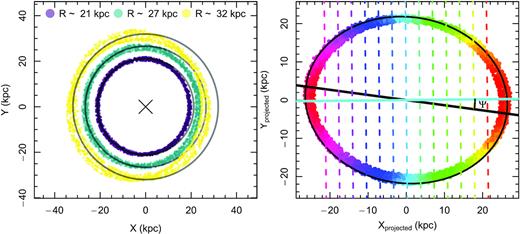
Left-hand panel: three orbital families (i.e. many orbits with slightly different initial conditions) modified by tidal effects. Grey circles correspond to the initial circular orbits with initial radii indicated at the top of the figure. Different responsiveness to the a⋆ catches the eye. Right-hand panel: an orbital family observed at an angle of 35° with misalignment to the photometric axis of Ψ = 8°. Cyan line is the estimated kinematic axis, black line is the photometric (initial) axis. The coloured points show line-of-sight velocity of each point. Dashed lines connect similar velocity regions, and help to assess their orientation in the plane of sky. This illustrates ease of creation of the position angle misalignment via tidal effects.
3 APPLICATION TO GALAXY IC 2487
We quantify the effects that the tidal field, which is generated by the density wake of DF, have on the galaxy IC 2487 (also known as CIG 340). This galaxy is a disc galaxy located at a distance of 54.8 Mpc (Fernández Lorenzo et al. 2013) and is either an isolated or lies in a sparse group. We select an isolated galaxy4 in order to reduce other possible phenomena responsible for lopsidedness or warp production. Hence, increasing the probability that the density wake of DF is the cause of these asymmetries. The IC 2487 galaxy is well observed. It is covered by SDSS imaging (Alam et al. 2015), the CALIFA (García-Benito et al. 2015) and the AMIGA5 (Verdes-Montenegro et al. 2005) surveys. Scott et al. (2014) studied the H i distribution of this galaxy, emphasizing the asymmetry of its gas distribution.
Throughout this section, we denote r as a spherical coordinate, and R and z as cylindrical coordinates. The centres of both spherical and cylindrical reference frames are co-aligned with the centre of the IC 2487 galaxy.
For quantifying the effect of tidal forces in the galaxy, we, first, model the ability of IC 2487 to generate a DM density wake by gravitational scattering of DM particles. The generation of this wake depends on the gravitational potential of the galaxy Φ(x) which can be decomposed into a stellar and a DM components. Secondly, we model the lopsidedness in the H i distribution and velocity field of the IC 2487 galaxy using measurements of the 21-cm line emission.
3.1 Gravitational potential of IC 2487
The matter distribution of a galaxy can be decomposed into three components: gas, stellar mass, and DM. For simplicity, and since the contribution of the gas to the total gravitational potential is in the present case rather small, we do not take it into account in the mass modelling. The stellar component is modelled using the SDSS i-band image that can be seen in the top panel of Fig. 5.
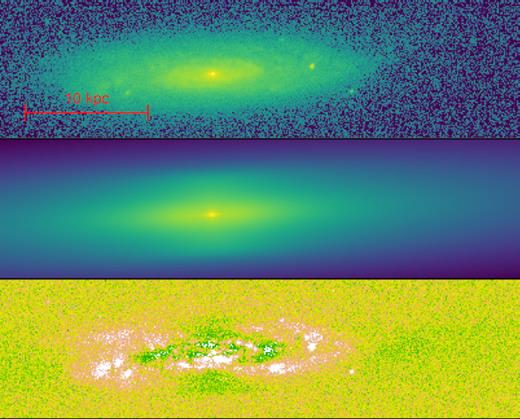
Stellar distribution of the IC 2487 galaxy. The top panel shows the optical image observed by the SDSS survey in the i band, while the middle panel corresponds to our model image. In both cases, the colour scale is logarithmic. The bottom panel shows the residuals in linear scale.
3.2 Observations
In Section 2.4, we found that the tidal acceleration field induced by the DM wake responsible for DF is larger in the outer parts of galaxies (e.g. see Fig. 3). Since the response of the galaxy to tidal effects is, thus, prone to be larger in the outer regions, it is best to look for data that extend to large radii. Radio observations of the H i distribution in galaxies fulfil this criterion.
Observations of the 21-cm H i emission line for the IC 2487 galaxy are taken from Scott et al. (2014). In particular, we use the flux density in a collection of three-dimensional pixels for two different resolution regimes (i.e. low and high resolution). Each pixel is characterized by the two-dimensional position and line-of-sight velocity. Thus, the tidal field, induced by the DM wake responsible for DF, acting on the IC 2487 galaxy is determined by modelling the observed flux as a function of the two-dimensional position and the line-of-sight velocity, i.e. I(X, Y, vlos).
A complementary part of the observations is the point spread function (PSF) of the imaging. We approximate it with the sinc2 function, with full width at half-maximum (FWHM) taken from Scott et al. (2014). We assume that the PSF is a top-hat function in velocity space. Uncertainties on the flux density are found from empty background and take the following values: σ1 = 1.4 mJy and σ2 = 1.0 mJy for the low- and high-resolution regimes, respectively. We add a slight uncertainty proportional to the flux density in each pixel |$\sqrt{\sigma ^2 + 2\sigma |I|}$|, where σ and I are, respectively, the uncertainty and flux of each pixel. Since the uncertainties are correlated pixel by pixel, we increase the amplitude of the uncertainty by a factor of 2 in order to avoid overfitting. A detailed description of the data can be found in Scott et al. (2014).
3.3 Model and statistical framework
The initial system of orbital families is evolved in time using a Dormand–Prince algorithm. To mimic the build-up of the DM wake, we assume that in the initial t = 0.25 Gyr, the total acceleration acting on the galaxy is |${\boldsymbol a} + {\boldsymbol a_\star } t/[0.25\, {\rm Gyr}]$|, where a is the acceleration generated by the gravitational potential of the galaxy (i.e. equation 1) and a⋆ is given by equation (6). After the first 0.25 Gyr, the acceleration field acting on the galaxy is a + a⋆. The outlooks of the orbits/galaxy are dependent on the time-scale the perturbation has occurred. As we do not know it from observations, the model flux is computed after a time interval of 1.25 and 2.25 Gyr. We select two different orbital integration times to test the sensitivity of our results to this parameter.
The modelling of tidal effects implies the calculation of a five-dimensional integral and orbit integration both for equation (5) and for the later response of the galaxy, seven nested integrations in total. Each subsequent integration produces numerical inaccuracies, and therefore the evaluation of the likelihood has numerical inaccuracies. We caution that the exact numerical values should not be taken as very precise ones, but with slight caution.
3.4 Results and inference
3.4.1 Quality of the model
The technique for modelling the H i distribution of the IC 2487 galaxy was presented in the previous sections. Although the modelling has been done by fitting the observed flux as a function of two-dimensional position and line-of-sight velocity, we are only able to show two-dimensional projections for a reader to assess the quality of the fit. The projection into the sky’s plane (i.e. flux density integrated over velocity) is shown in Fig. 6. From this figure it is seen that, for both high and low resolution images, the modelled warp comes forth. The model images for the low- and high-resolution regimes are slightly different since the PSFs for them are differently oriented: 15.5° and −59.73° (Scott et al. 2014).
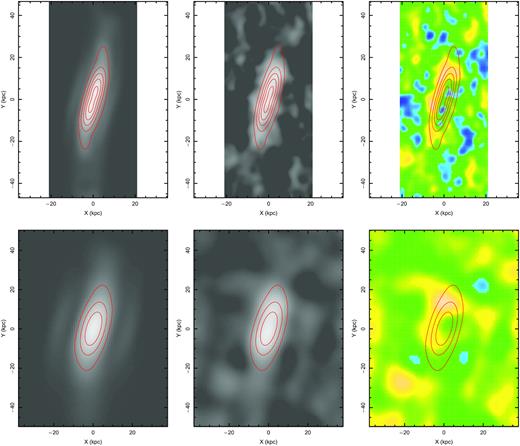
H i emission maps (i.e. flux integrated over line-of-sight velocities). Top and bottom rows correspond to the high- and low-resolution maps, respectively. Left-hand panels are model images, central ones are observed images, and the right ones correspond to the residuals. The red contours are taken from the model images for easier comparison. The model is obtained after an integration time of 2.25 Gyr (see the text for details).
The velocity distribution model can be assessed from Fig. 7. In this figure, we show the projection of spatial velocities summed over the X-direction in the H i observation data cubes, leaving the velocity dependence over the Y-direction (vertical direction in Fig. 6). We conclude that model images match observations well for both low- and high-resolution regimes.
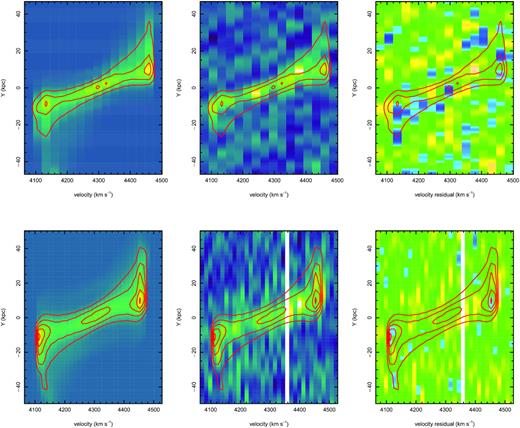
H i velocity field obtained by summing over the spatial X-direction. Top panels show the high-resolution images and bottom ones show the low resolution (but better resolved in velocity space). From left to right are model, observational and residual images, where the contours from the model image have been added.
We saw that the model resembles the observations very well. An advantage of the model compared to observations is that we can project it in different ways to emphasize different aspects. First, we would like to show the orbital families that build up the gas distribution. This is shown in Fig. 8. The left-hand panel shows the face-on view of the galaxy. The colourful dots show the centres of each of the orbital families, their alignment illustrates no significant phase shift with radius. The panel on the right shows warpness. At central regions, no warp is seen, at intermediate radii, there is S-shaped warp, and at outermost radii, the orbital families form an U-shaped warp. This is caused since the vertical acceleration of the disc is insignificant compared to the force produced from the wake. Although interesting shift from S-shaped warp to U-shaped warp, it might be not well observed because of the high distance from the centre. In Fig. 8, we depicted only orbital families, ignoring their relative strength. In Fig. 9, we have adjusted the orbital family weights and provide the face-on projection in logarithmic intensity scale. The lopsidedness is well shown in this figure.
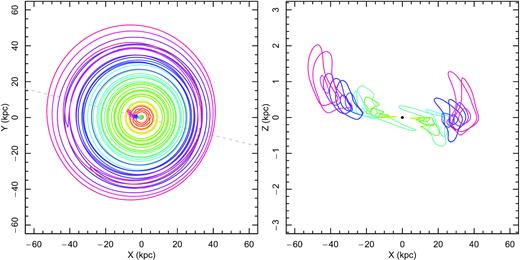
Superposition of orbital families contributing to IC 2487. The left-hand panel shows the face-on view and the lopsidedness of the galaxy. The dots near the centre show the central values of each orbital family. As they are aligned, there is no significant phase shift. The right-hand panel shows the edge-on projection. The inner parts show practically no warp, the middle ones S-shaped one, and outer regions U-shaped warp.
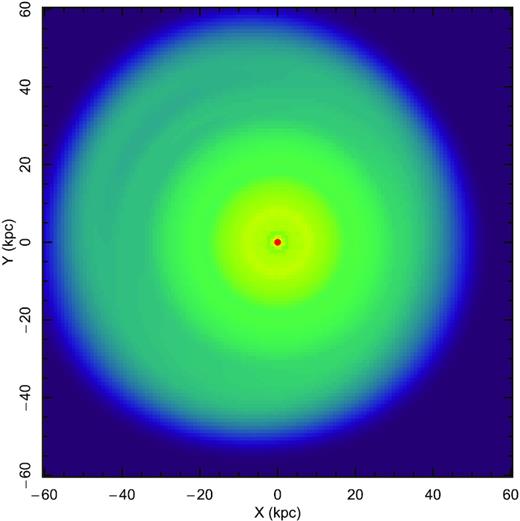
Best model for IC 2487 in face-on projection without PSF convolution. It is noticeable that the centre is quite round, while outer parts show significant lopsidedness.
The observationally motivated measures of asymmetry are ratios of coefficients from Fourier series. We projected our model to a face-on view, and expanded the intensities over constant radii circles into Fourier series. The ratio of the coefficients quantify each type of asymmetry: a1/a0 lopsidedness, and a2/a0 flatness, or the bar-likeness. The measured asymmetry can be seen in Fig. 10. We would like to point out that the gas distribution has a shallow gradient, indicating that the orbital asymmetry (i.e. non-roundness of lines in the left-hand panel of Fig. 9) can be larger than the intensity-based measures. A comparison between the theoretical lopsidedness as shown in Fig. 10 and observations from van Eymeren et al. (2011) show different behaviour at very large radii: whether in the case of observations, the a1/a0 fraction saturates, in our model it does not. A possible cause for this is that our wake calculations do not include self-gravity of the wake and possible lopsidedness of the potential from the response of the galaxy (see Section 4.1).
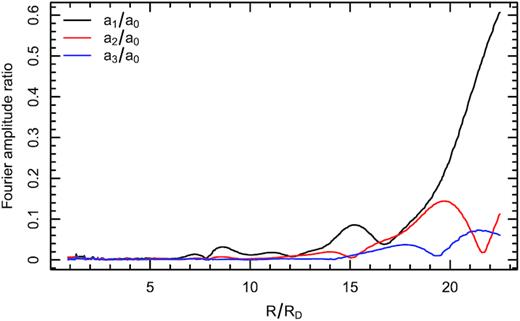
Fourier amplitudes for model IC 2487. Amplitudes are spiky because the orbits are not smoothed by PSF/beam.
The integration time was one of the parameters of modelling. We selected it to be 1 and 2 Gyr since this is the time-scale that a galaxy would take to travel through a cluster or group of galaxies. Thus, within this time we can assume that the phase-space distribution of the passing particles is constant. We assessed how the asymmetry changes when the disc responds for |$1 - 10\, {\rm Gyr}$| and show it in Fig. 11. We can see that initially there are some changes, but after ∼6 Gyr, the system seems to stabilize.
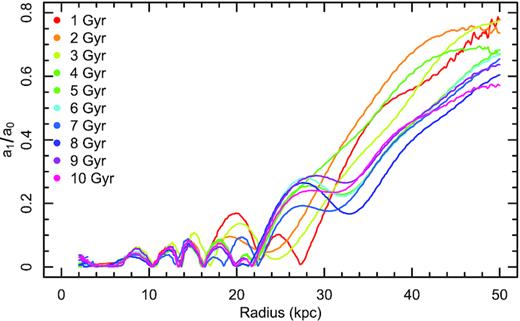
This figure shows the build-up of lopsidedness over 10 Gyr. The response of the disc stabilizes to a quasi-stationary state above ∼6 Gyr. In case of strong symmetries of potential, the orbits tend to be more stable, but in this case we are at the opposite end: potential does not follow even triaxial symmetry.
3.4.2 Inference on galaxy movement and dark matter
Our modelling of the H i distribution in the IC 2487 galaxy has six free parameters: the galaxy’s receding velocity from us (i.e. the redshift), its velocity with respect to the DM background (three vector components), the DM density, and the DM velocity dispersion.
The velocity vector of the galaxy characterizes the relative motion between the IC 2487 galaxy and the passing particles responsible for DF and tidal effects. Passing particles might belong either to a large-scale structure (e.g. supercluster) or to the halo of a sparse group, in the case the galaxy is a member of this group. In fact, both DM populations may contribute to generating the DM density wake responsible for DF. On the one hand, the galaxy might transfer part of its orbital energy to the DM particles of the group’s halo. On the other hand, as the group moves with respect to the large scale structure, particles belonging to the latter can also induce DF. These two populations of DM particles might have different structural properties (i.e. different DM density and velocity dispersion). None the less, in our modelling the galaxy moves through a background of DM particles characterized by a unique DM density and velocity dispersion. The absolute value of the galaxy’s velocity with respect to the background of DM particles was found to be |$35\pm 7\, {\rm km\, s^{-1}}$| and |$300\pm 70\, {\rm km\, s^{-1}}$| when integrating orbits for 2 Gyr and 1 Gyr, respectively. The longer the galaxy is being perturbed, the smaller influences can be determined. Fig. 13 shows the two-dimensional marginalized posterior distribution for the galaxy’s velocity as a function of the density of DM particles. Such a large variation in galaxy’s speed results from the difference in the perturbation times (i.e. 1 and 2 Gyr). In principle, the time of the perturbation could be deduced by measuring peculiar line-of-sight velocities from e.g. CosmicFlows project (Tully, Courtois & Sorce 2016).
The direction of the galaxy’s velocity is well determined, since it is more sensitive to the warp and lopsidedness directions than its absolute value. Independently on the time of the perturbation, the angle between the galaxy movement and the rotation axis is 123°−134°, and the angle between the plane of the sky and galaxy’s movement is 82°−99° if measured in the plane of the galaxy (see Fig. 12). It is to be noticed that this is not the same as the angle towards the warp in the plane, as there is a phase shift between the acceleration and the warp responding to it.
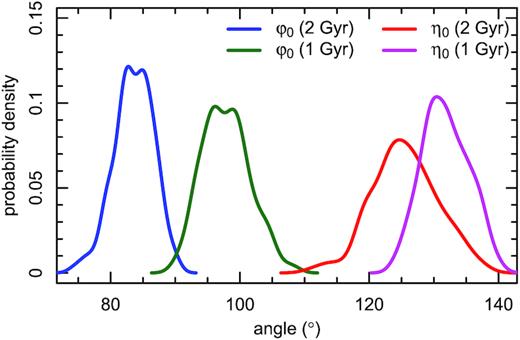
The direction of the galaxy described with two angles: the direction of the plane of the galaxy (η0) and from rotation axis (ϕ0).
In principle, the galaxy’s velocity with respect to the background of DM particles, which has been derived above, can also be found when comparing the true distance of the galaxy with its redshift (since redshift includes also peculiar velocity component) (Tully et al. 2016). The values of the line-of-sight peculiar velocity (assuming |$H_0 = 70\, {\rm km\, s^{-1}\, Mpc^{-1}}$|) for the IC 2487 galaxy found in the literature range from −347 to |$640\, {\rm km~s^{-1}}$| (Karachentsev et al. 2006; Theureau et al. 2007; Fernández Lorenzo et al. 2013). The projected velocity of IC 2487 found from our modelling is |$|v_{\rm los}|\lesssim 150\, {\rm km\, s^{-1}}$|. In general, these results are consistent, but unfortunately this is not very constraining to check the modelling accuracy. Although not applicable in the present case, in principle, the method provides an opportunity to mitigate the degeneracy between cosmological and Doppler redshifts.
A more intriguing result of the present paper is the possibility to constrain the properties of the DM medium in the cosmic web and group environments. The range of the DM density is derived to lie in the range of |$(0.6{\!-\!}2.4)\times 10^4\, {\rm M_\odot ~kpc^{-3}}$| for 2 Gyr orbit integration (this and subsequent ranges correspond to |$65{{\ \rm per\ cent}}$| confidence interval in case the likelihood calculation is stable; see Section 3.3), and |$(5.5{\!-\!}9.5)\times 10^4\, {\rm M_\odot ~kpc^{-3}}$| for 1 Gyr orbit integration. For a comparison, the average density of the Universe is |$140\, {\rm M_\odot kpc^{-3}}$|. The derived DM velocity dispersion lies in the ranges |$20{\!-\!}60$| and |$15\!-\!40\, {\rm km~s^{-1}}$| for 2 and 1 Gyr, respectively. Fig. 13 shows the degeneracy between them and the galaxy’s velocity. The problem of not knowing the orbital integration time and the degeneracy between velocity dispersion and density can be eased by acquiring additional information of a system. For example, if a lopsided galaxy is in a cluster, its environmental density ρDM can be determined from external source such as weak lensing. In addition, being in a group/cluster allows to determine line-of-sight velocity with respect to the cluster that reduces the degeneracy from vgal/σDM.

The environmental properties of IC 2487: dark matter density and its velocity dispersion with the amplitude of the movement of IC 2487. All of the calculations are made twice: one with orbital calculations of 1 Gyr and one with 2 Gyr. Substantial differences suggest that longer times require less perturbations to build up lopsidedness similar to observations.
4 DISCUSSION
With this paper we tested how galactic discs would respond to the tidal forces generated by the wake also responsible for DF. Although the overall estimation of the amplitude of the effect gives reasonable results, we would like to discuss some caveats and further possibilities.
Although we present the results for 1 and 2 Gyr orbit integration times, we tend to favour the latter solution. The main reason is that the solution of quicker lopsided build-up (i.e. 1 Gyr) requires that the ratio between the galaxy’s velocity and DM velocity dispersion to be unreasonable in case the IC 2487 galaxy resides in a bound group. In case there is an infall to a cluster, then the galaxy velocity differs strongly from the DM particle ones and large vgal/σDM is expected. In that case, the 1 Gyr orbit integration solution might be viable.
4.1 Caveats
The original cause of DF is the gravitational potential of a galaxy which is moving through a background medium of DM particles. Our results show how this potential and its corresponding acceleration field are distorted. However, our modelling does not include these distortions retrospectively, i.e. the DM wake is not affected by distortions on the gravitational potential that has initially generated it. Therefore in the regime where a⋆ (given by equation 6) is much larger than the intrinsic acceleration of the galaxy, the tidal effects might not be correctly estimated.
The input requires gravitational potential. Initial modelling for potential includes also particles that are passing through galaxy (unbound particles) that are introduced in further modelling. Hence, some particles are counted twice or not counted at all in a⋆ determination.
In the application on IC 2487, when calculating the response of the galaxy as warp and lopsidedness, the vertical acceleration component of the a⋆ is adequately determined. The vertical restoring force for warp is evaluated from acceleration of Miyamoto–Nagai potential modelling. As there is degeneracy between inclination and thicknesses (and therefore vertical forces), the response of the disc can be sensitive to the photometric modelling, which cannot be included due to the fore-mentioned degeneracy.
In this paper, we have assumed that the velocity distribution of DM particles is described by a normal distribution. Whether this is a good assumption for collisionless systems, in cases of some non-stationarity even more complicated distributions are possible. It was demonstrated by Leung et al. (2020) that, at least in the case of globular clusters orbiting in a DM halo, different forms of velocity distribution of DM particles affect DF effects surprisingly significantly. Thus, the assumption of the normal distribution should be handled as an approximation only.
4.2 Outer parts of galaxies
In order to seek the side effects of DF, we must know where to look for. The gravitational force of the galaxy decreases with distance from the centre. Therefore, outer parts of galaxies are less strongly bound to a galaxy, and external perturbations, even with the same strength, have higher influence on the outer parts of the galaxy. This suggests that the outer parts of galaxies are more prone to be perturbed.
We calculated that the tidal forces from the wake can take many forms, depending on the orientation between the disc’s plane and the movement of the galaxy which is measured by the angle η. In Section 2.4, we mentioned the possibility to produce U- and S-shaped warps as a function of η. The L-shaped warps would be produced as intermediate angles. That is, the inclination of the movement provides the diversity of the warps. The expected shape of the warp distribution would be diverse, both in morphology and asymmetry, as shown in an example Fig. 8.
Lopsided galaxies show lopsidedness mostly directed towards one direction, without significant change of phase with radius. From the perspective of lopsidedness from DF, the same applies. The wake is located opposite to the direction of galaxy movement. A galaxy moves in a cluster or group in an orbit with a much larger period than the galaxy’s rotation period. This stability suggests that the wake is in one direction for an extended period of time, and the expected shift of the lopsidedness is minimal. This corresponds to the observations.
In the inner parts of a galaxy, tidal forces from the wake of the DF can be observed as the misalignment of the kinematic and photometric position angles, as shown in the present study (see Fig. 4). This misalignment does not always correlate with interaction marks and satellites – the cause of tidal forces (Pilyugin et al. 2020). The closeness of gas and stellar kinematic alignment suggests that gravitational potential non-axisymmetry is preferred over gas accretion. The same applies to non-correlation with other properties of galaxy. Further H i surveys, such as WALLABY (Koribalski et al. 2020), will shed more light on the mechanisms of the asymmetry production (Reynolds et al. 2020).
4.3 DF as probe for the nature of dark matter
The observation of DF’s effects will provide an additional evidence for the existence of DM in the form of particles. Furthermore, it might provide a way to prove the nature of DM. Besides gravitational interactions, additional sources of pressure and/or forces need to be taken into account in the formation of the DM density wake depending on the properties of the DM particle (e.g. self-interactions, wave-like behaviour) (see e.g. Ostriker 1999; Lora et al. 2012). On top of this, the effective acceleration field acting on a galaxy depends on DM densities and velocity distributions along the galaxy orbit, which indeed differ for different DM scenarios. Therefore, the magnitude of the tidal effects correlates with the nature of the DM particle.
Although at present it is difficult to derive e.g. DM velocity distribution properties directly from observations, the modelling of tidal effects may help to constrain DM distribution properties. However, in this case we need to assume that all or at least dominating part of tidal effects of modelled galaxies are caused by DF. This may not be the case of tight galaxy groups with frequent merger events. Most valuable for us in this sense are isolated galaxies or galaxies in loose groups where one may expect that recent mergers are insignificant and lopsidedness of galaxies is caused mainly by the DM wake responsible for DF. Constraining DM distribution properties in large-scale environments of isolated galaxies and of loose groups is especially valuable as little is known about DM properties there.
In this work, we have assumed the cold dark matter paradigm, which has been remarkably successful in explaining the large-scale structure of the Universe. We leave to future work the study of the effect of DF in the density and kinematics of galaxies under the assumption of different DM scenarios.
5 SUMMARY
In this paper, we derived necessary equations and thereafter, estimated the tidal forces due to the density wake produced by DF between a galaxy and a surrounding field of dark matter particles. We showed that these tidal forces are able to produce lopsidedness and warps in galactic discs and photometric-kinematic position angle misalignments. The magnitude of these effects depend on the spatial velocity of the galaxy, its orientation with respect to the velocity direction, and the distribution of dark matter particles.
As a case study, we selected the isolated galaxy IC 2487 to estimate the properties of the background dark matter distribution in order to be able to reproduce the observed lopsidedness, warp and other H i distribution features. We estimated that the necessary local density of the surrounding dark matter field is |$10^4 {\!-\!} 10^5\, {\rm M_\odot \, kpc^{-3}}$| and the necessary velocity dispersion of dark matter particles should be |$\lesssim 80\, {\rm km\, s^{-1}}$|. According to large-scale structure simulations, the density parameter is realistic for dark matter distribution in loose groups or in overall dark matter field. As a side product, we were able to estimate the 3D velocity of the galaxy with respect to dark matter. An attempt to check the consistency of the line-of-sight velocity component with the peculiar motion from the redshift-distance differences was not successful, due to large uncertainties of distance measurements.
Thus, at least in principle, it is possible that DF due to dark matter particles is responsible for the observed lopsidedness and warps in isolated or nearly isolated galaxies especially where other mechanisms (e.g. mergers) do not work well.
ACKNOWLEDGEMENTS
We are grateful to C. Jog for refereeing the paper and providing very helpful feedback and suggestions. We thank Urmas Haud for useful insights on observations in the radio astronomy and Gert Hütsi for general discussion. This work was supported by institutional research funding IUT40-2, PUTJD907, and PRG803 of the Estonian Ministry of Education and Research. We acknowledge the support by the Centre of Excellence ‘The Dark Side of the Universe’ (TK133) and MOBTP86 financed by the European Union through the European Regional Development Fund. Funding for the Sloan Digital Sky Survey IV has been provided by the Alfred P. Sloan Foundation, the U.S. Department of Energy Office of Science, and the Participating Institutions. SDSS-IV acknowledges support and resources from the Center for High-Performance Computing at the University of Utah. The SDSS web site is www.sdss.org.
DATA AVAILABILITY
The data underlying this article are available in the article. The sources of the code used in this paper will be shared on reasonable request to the corresponding author.
Footnotes
The gas and/or stellar component of a lopsided galaxy extend further out on one side of the galaxy with respect to the other side. This asymmetry is measured by the m = 1 Fourier mode of the surface density.
Notice that by |a⋆| we denote the magnitude of the component of a⋆ in the disc’s plane and not the magnitude of the three-dimensional a⋆.
In this work, an orbital family refers to the superposition of many orbits with slightly different initial conditions.
The nearest neighbour to the IC 2487 galaxy is at 0.6 Mpc in projection, which (in combination with typical line-of-sight velocities) is equivalent to 2.9 Gyr of motion (Scott et al. 2014).
AMIGA project homepage is http://amiga.iaa.es/p/1-homepage.htm
The assumption that the non-perturbed potential equals the one determined today has a twofold justification. First, the depth of the potential is not affected by the tidal force. Secondly, today’s potential is determined from measurements of the inner part of the galaxy where tidal effects are not important.
