


ABSTRACT
We construct a sample of 10 680 wall galaxies and 3064 void galaxies with MR ≲ −20 by cross-referencing a void catalogue from literature with Baryon Oscillation Spectroscopic Survey (BOSS) CMASS and WiggleZ galaxies, where the CMASS survey targets redder galaxies and the WiggleZ survey targets bluer galaxies. Comparing the density profiles of the red and blue galaxies as a function of the void radius, we find that the number ratio of red-to-blue galaxies increases with distances from the void centres, suggesting a deficit of luminous and normal red galaxies in voids. We find a mean (g – r) magnitude colour of 1.298 and 1.210 for the wall and void galaxies, respectively, when considering the combined red and blue samples, which is found to be a significant difference. However, when considering the blue and red samples separately, we find no significant colour difference. We conclude that the constituents galaxies of each population, rather than intrinsic colour difference, is the main driver in the apparent average colour difference of galaxies in voids and walls, indicating a deficit of luminous and normal red galaxies in voids. Our analysis suggests that the primary environmental-dependence effect on galaxy evolution for normal and luminous galaxies between void and wall regions is manifested in the number of red galaxies, which depends on the environmental-dependent merger history. Using a semi-analytic simulation model, we can successfully reproduce the apparent colour difference between the void and wall galaxies.
1 INTRODUCTION
On the largest scale, the universe is homogeneous and isotropic, but on scales up to 100 Mpc, galaxies clump together into filaments, walls, and voids to form a sponge-like foam, the large-scale structure (Bharadwaj, Bhavsar & Sheth 2004). Large, underdense regions of space which exist between the filaments, clusters, and walls of galaxies are known as cosmic voids and typically have radii |$30 \, h^{-1}\, \mathrm{Mpc} \lt r \lt 80 \, h^{-1}\, \mathrm{Mpc}$| (Mao et al. 2017). These cosmic voids make up about 60 per cent of the the volume of the universe, while they contain only about 7 per cent of the galaxies (Pan et al. 2012). The galaxies which occupy these voids are known as void galaxies. Galaxies are thought to form and evolve from both the collapse of dark matter haloes as well as mergers of haloes, with the additional gas following more complicated gas physics attached on the backbone of the dark matter. The underdense void environments provide an ideal environment for studying galaxy formation and evolution, as gravitational interactions with neighbours are less frequent, and it is possible to separate the role of mergers in these processes. Thus, void galaxies can provide insight on the environmental dependence of galaxy formation/evolution with the minimal impact from mergers. However, not all void galaxies are isolated – filaments within voids permit gravitational interactions even among void galaxies. For example, Kreckel et al. (2012) found that 5 of the 60 Void Galaxy Survey (VGS) galaxies are interacting with a companion. Following up on this, Beygu et al. (2013) looked in depth at a filament of three galaxies in the VGS.
With such promise, void galaxies have been a prominent area of research in the previous years. It has been found that void galaxies are typically blue, late-type, star-forming galaxies (Szomoru et al. 1996; Popescu, Hopp & Elsaesser 1997; Grogin & Geller 1999; Rojas, Vogeley & Hoyle 2003; Rojas et al. 2004; Sorrentino, Antonuccio-Delogu & Rifatto 2006; Tavasoli et al. 2015). While this leads to a clear difference across the void and wall galaxies as a whole, a search for quantitative differences in the properties of void and wall galaxies has been more evasive. Both Croton, et al. (2005) and Hoyle et al. (2005) found no significant difference between the faint-end slopes in the luminosity functions between void and wall galaxies, with the qualification that Croton et al. (2005) were considering the full Two-Degree-Field Galaxy Redshift Survey sample. However, it is noteworthy that Croton et al. (2005) find that the faint-end luminosity function of early-type galaxies steepens with increasing density. In contrast, Park et al. (2007) found significant difference between void and wall galaxies at the faint-end slopes. These results could lead to contradicting conclusions about the population of dwarf galaxy populations in voids. In terms of differences in colour between wall and void galaxies, Rojas et al. (2004) find that void galaxies are bluer than wall galaxies, and that this behaviour is only partially explained with the absence of luminous red galaxies in voids. Patiri et al. (2006) found evidence that wall and void galaxies do not differ in their individual properties, particularly with regards to colour distribution, bulge-to-total ratios, and the specific star formation rate when accounting for colour. More recently, Hoyle, Vogeley & Pan (2012) found that late-type void galaxies seem to be bluer than late-type wall galaxies, and the same could be said for their early-type galaxies. In this study, we will focus on a statistical analysis of a large sample of wall and void galaxies, and as such will be washing out the minor effects of merging void galaxies or well-isolated wall galaxies, which would cross-contaminate the samples to a small degree.
Our sample in this study is unique in its combination of two distinct spectroscopic surveys targeting red and blue galaxies, which will facilitate a quantitative study on the colour differences and red-to-blue galaxy number ratio between wall and void galaxies, especially for the luminous and normal ones. These measurements can be compared with numerical or semi-analytical simulations to test the environmental-dependence galaxy formation models. To the end of studying these void galaxies, we use photometry from the Sloan Digital Sky Survey (SDSS) CMASS sample (York et al. 2000; Alam et al. 2015), WiggleZ Dark Energy Sky Survey (Drinkwater et al. 2010), and a void catalogue (Mao et al. 2017) to identify and study void galaxies. The SDSS CMASS sample covers about 10 000 deg2, while the WiggleZ covers about 1000 deg2. The majority of the WiggleZ sample overlaps with the CMASS sample, as shown in Beutler et al. (2016).
In Section 2, we discuss the two galaxy surveys as well as the void catalogue. In Section 3, we present our methodology. In Sections 4 and 5, we present our analysis results and comparisons with semi-analytic model predictions. Discussion is given in Section 6. We assume a flat cosmology with H0 = 70 km s−1 Mpc−1, |$\rm \Omega _M=0.27$|, and |$\rm \Omega _\Lambda =0.73$| throughout the paper.
2 DATA SETS
2.1 The CMASS sample
The CMASS sample is part of the Baryon Oscillation Spectroscopic Survey (BOSS), conducted with the 2.5 m telescope at the Apache Point Observatory in New Mexico. BOSS covered 10 000 deg2 of sky, observing about 1.5 million galaxies as faint as i = 19.9 mag at a redshift range 0.15 < z < 0.7. BOSS is split into two samples – the low-redshift (LOWZ) sample from 0.15 < z < 0.43 and the CMASS sample from 0.43 < z < 0.7. For our analysis, we use only the CMASS sample. The LOWZ sample has fewer voids overall, and after applying the sample selections discussed in Section 3 only 22 voids remain. This results in a much smaller sample of both void and wall galaxies, only 1378 galaxies from the LOWZ sample before any additional data screens. The small number statistics makes it difficult to interpret the analysis results, and thus, we work only with the CMASS sample. The CMASS sample favours red galaxies, although to a lesser extent than the LOWZ sample, but both are not devoid of blue galaxies. Galaxy light is collected in the SDSS five band system – u, g, r, i, and z, centred at 3551, 4686, 6165, 7481, and 8931 Å, respectively. We use the g- and r-band magnitudes and the spectroscopic redshift in this analysis.
2.2 The WiggleZ Survey
The WiggleZ Dark Energy Survey was conducted at the Anglo–Australian telescope, covering 1000 deg2 of sky. We work with the first public data release, which contains 81 362 galaxies. The WiggleZ Survey was designed to measure the Baryon Acoustic Oscillation (BAO) using blue galaxies with strong emission lines originating from star-forming regions. These strong emission lines allow quick and accurate detection of redshifts, facilitating redshift distance measurements which are necessary for the measurement of the BAO signal. The target galaxies were selected using GALEX satellite data. 90 per cent of the target galaxies fall within redshift 0.2–1.0. A sky-position target match is done between the GALEX data and SDSS data, matching with a confidence level of 95 per cent. Thus, we have access to the SDSS optical data for these galaxies, and once again use the g and r magnitudes and the spectroscopic redshift in this analysis.
2.3 The CMASS–WiggleZ overlapping region
The majority of the WiggleZ sky coverage is within the CMASS sky coverage, resulting in about 560 deg2 of overlap (Marín et al. 2016). The CMASS and WiggleZ surveys overlap at a redshift of 0.43 < z < 0.70, limited by the CMASS sample. This large area of overlap gives us a sizable population of galaxies to work with, as we shall see in Section 3.
2.4 Incompleteness of the samples
For the WiggleZ sample, the incompleteness issue is less important due to the targeting strategy (Blake et al. 2010). Although the CMASS sample suffers from various incompleteness factors, such as the redshift failure, fiber collision, and other systematic effects (e.g. Beutler et al. 2016), the analysis in this paper focus on the relative comparisons between the void and wall galaxies. Therefore, these incompleteness factors should not affect our result significantly, unless a factor has different effects for the void and wall regions. We assume that the redshift failure and other systematic factors behave similarly in the void and wall regions. The fiber collision factor could affect the void and wall directions differently, because there are more galaxies at the wall directions that can result in a higher likelihood of fiber collision. However, for the redshift range considered 0.43 < z < 0.70, the fiber collision beam corresponds to 0.55–0.9 Mpc, while our voids are up to 60 Mpc in radius, much larger than the fiber collision sizes and galaxies are sparsely populated in voids. Thus, one may presume that the fiber collision factor will have minimal affects on our galaxy counts between the voids and walls. In addition, voids are 3D, and there are foreground and background galaxies in their directions. Therefore, the 2D surface density contrast may not be as large in the void directions when compared to the wall directions, resulting in similar fiber collision rates. To check the fiber collision effect more carefully, we can calculate the nearest neighbour distance for the galaxies in the CMASS and WiggleZ samples, using WiggleZ sample as a reference because it suffers less from incompleteness issues. Here, we count the total number of galaxies which have a neighbour within 1 Mpc. For the CMASS sample, we find that 59 of the final sample of 7092 galaxies (see Section 3 for the selection cuts) have a nearest neighbour within 1 Mpc, or 0.8 per cent. In the WiggleZ sample, 44 of the 6652 galaxies have a nearest neighbour within 1 Mpc, or 0.6 per cent. If fiber collisions were significant in CMASS sample, we would expect to see a significant difference between the number of galaxies with a neighbour within 1 Mpc across the two samples. We conclude that the CMASS incompleteness factors do not affect the main results of our paper.
2.5 The void catalogue
3 SAMPLE SELECTION
3.1 Classification of wall and void galaxies
We begin with identifying the void galaxies in the CMASS and WiggleZ overlapping regions. The first step is to make a cut of the CMASS sample to include only sky coordinates which overlap with the WiggleZ sample, as shown in Fig. 1 (modified from Beutler et al. 2016). The values for these estimates are taken from Marín et al. (2016). By excluding CMASS galaxies outside the overlap region, we can ensure that our results are not the product of survey boundary differences between the WiggleZ and CMASS samples.
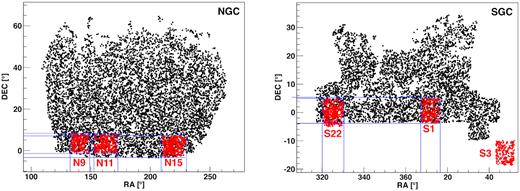
Schematic plot of the sky coverage of CMASS and WiggleZ surveys modified from Beutler et al. (2016), where we added the blue lines to facilitate identifying the approximate overlapping sky coverage between the CMASS (black) and WiggleZ (red) surveys. The left-hand frame shows the North Galactic Cap (NGC) overlap regions, while the right-hand frame shows the South Galactic Cap (SGC.) Only a random 3 per cent of all galaxies are plotted.
As mentioned previously, each void has a given effective radius, Reff. We utilize this effective radius in selecting our sample of galaxies. If a galaxy falls within 1.5*Reff of a given void, it is added to our catalogue of galaxies. At this phase, we work with voids smaller than 60 Mpc, which coincides with the peak of the approximately Gaussian distribution of voids’ effective radii. When calculating the comoving distance, d, between the each galaxy and every void, we use a flat Λ-cold dark matter with ΩM = 0.27. Galaxies within one Reff are deemed void galaxies, while galaxies within 1 Reff < d < 1.5 Reff are deemed wall galaxies. While this definition of void and wall galaxies will inevitably have contaminations across populations, this is all but unavoidable due to the voids’ complex shapes. Using the large void catalogue, the difference in the void shape will average out in the stacked void profiles.
To further ensure that the voids we are sampling represent overlap regions between the two surveys, we impose the condition that a void and its shell must contribute at least five galaxies from both the CMASS and WiggleZ surveys for the contained void galaxies to be included in our catalogue. We are left with a catalogue of 13 928 CMASS galaxies and 8881 WiggleZ galaxies across 188 voids.
3.2 Additional data screenings
To further ensure the completeness of the sample, We select only galaxies more luminous than MR < −21.0 and −19.9 for CMASS and WiggleZ samples, respectively. Here, the absolute magnitudes are calculated based on the SDSS apparent magnitudes, our assumed cosmology, and the K-corrections from Assef et al. (2010). These absolute magnitude cuts essentially limit our study to only luminous galaxies. The WiggleZ and CMASS magnitude cuts are both chosen to correspond with the peak of the galaxies’ magnitude distribution as shown in Fig. 2. These restrictions are applied to eliminate bias from including more faint nearby galaxies.
Fig. 3 shows the distribution of absolute magnitudes for all, wall, and void galaxies. We see that, generally, the wall and void populations follow similar distributions in absolute magnitude. The dashed green line is the dim magnitude cut for the CMASS sample. The onset of the CMASS sample is the reason for the large jump in the distribution at Mr ≃ −21.0.
We have tested selecting different magnitude cuts for the CMASS and WiggleZ samples and find that our results are not dependent on the chosen values. For example, applying a cut at −21.0 for the WiggleZ sample, as the CMASS sample, is more restrictive and increases the noise, but our fundamental findings do not change. Applying a magnitude cut at −19.9 for the CMASS galaxies simply decreases the noise at the expense of using less luminous galaxies with less well-defined selections. We have also tested applying bright magnitude cuts to both the CMASS and WiggleZ samples. Again, we find that none of our findings change with the bright magnitude selection for either the CMASS or WiggleZ samples. Of particular interest, when the two samples have precisely the same faint and bright magnitude cuts, none of our results change. The resulting wall and void galaxy populations always have a significantly different mean Mr magnitude, even when the magnitude limits are the same on both populations. This seems to be because void galaxies tend to be less luminous. A dedicated modelling of the luminosity function is needed to further confirm this difference in the mean Mr magnitude between void and wall galaxies.
We also impose a colour cut on the CMASS sample: the g − r colour of the CMASS sample must be (g − r) > 1.3. This eliminates the bluest of galaxies from the CMASS sample, leaving the CMASS sample as the redder galaxies and the WiggleZ sample as the bluer galaxies. This facilitates a ratio comparison, which we will discuss in Section 4. These cuts are evident in Fig. 4, which shows the galaxies’ colour-magnitude diagram between the (g − r) colour and the Mr magnitude. Colour–magnitude diagrams of galaxies have been shown to cluster in two distinct regions: the red sequence and the blue cloud, which are both apparent. The red sequence is composed primarily of the CMASS galaxies, and the blue cloud is composed primarily of the WiggleZ galaxies. Although void and wall galaxies occupy both the red sequence and the blue cloud, we can make more qualitative statements using statistical testing, as we will show in Section 4.
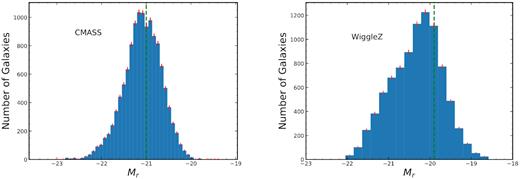
The magnitude distributions of galaxies in the CMASS (left) and WiggleZ (right) populations. Error bars are given by |$\delta = \sqrt{N}$| and shown in red. The chosen magnitude cuts are shown as the green dashed line, eliminating selection bias of faint galaxies.
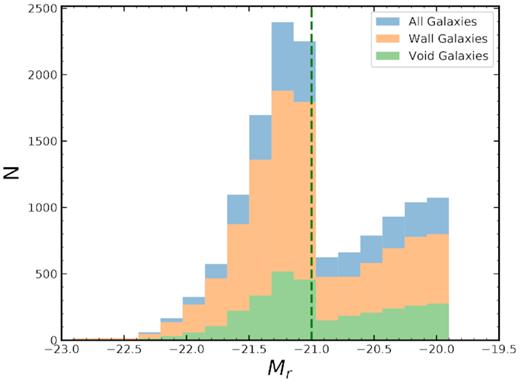
The absolute magnitude distributions of all, wall, and void galaxies. The dashed green line shows the faint magnitude limit of the CMASS sample, which is the reason for the jump in the distribution at magnitudes brighter than MR ≃ −21.0. Generally, the distributions of wall and void galaxies follow similar shapes.
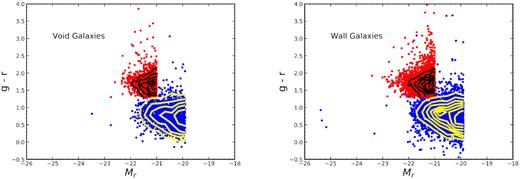
Colour–magnitude diagrams for both the wall (left) and void (right) galaxies, where we plot the g − r colour versus the absolute magnitude in the SDSS r filter. We apply the absolute magnitude cuts of MR < −21.0 to the CMASS sample and MR < −19.9 to the WiggleZ sample. The CMASS and WiggleZ magnitude cut values are chosen to correspond with the peak of the magnitude histograms, as shown in Fig. 2 The results are shown to be insensitive to the exact CMASS or WiggleZ magnitude cut value. The CMASS galaxies are plotted in red, while the WiggleZ galaxies are plotted in blue. Black and yellow contour lines help to identify the red sequence and blue cloud. It is apparent that the CMASS galaxies mainly occupy the red sequence, while the WiggleZ galaxies mainly occupy the blue cloud.
After these cuts, we are left with 7092 CMASS galaxies and 6652 WiggleZ galaxies. This is 51 per cent of the original CMASS sample and 73 per cent of the original WiggleZ sample. Of the 7092 CMASS galaxies, 5729 are wall galaxies, while 1363 are void galaxies. For comparison, the WiggleZ population has 4951 wall galaxies and 1701 void galaxies. While our void sample is not as large as the 88 000 void galaxies studied in Hoyle et al. (2012), it is larger than many other previous studies which have studied ∼1000 void galaxies. Further, by including the WiggleZ sample and detecting a marked increase in density as we move out of the void, we are able to validate the voids from Mao et al. (2017) with an independent sample. It is also noteworthy that the voids used here are generally larger than those used in Hoyle et al. (2012), which are based on the void catalogue from Pan et al. (2012).
We are now equipped with a large catalogue of blue and red void galaxies in the overlap region of CMASS and WiggleZ surveys.
Finally, we note that while we exclude voids with radius larger than 60 Mpc, all of our results are robust against including voids of larger radius.
4 STACKING RESULTS
We use our combined catalogue from CMASS and WiggleZ galaxies in the overlapping regions of the two surveys to complete the rest of our analysis. We first check the stacked galaxy density profile of the voids using two methods, stacking by the physical or effective radius units. We expect that the stacked galaxy density would increase as a function of distance from the void centre.
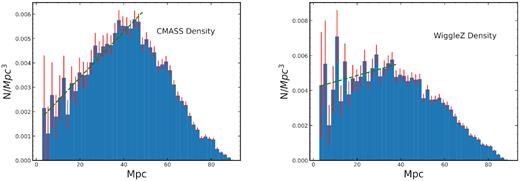
Galaxy number density as a function of void radius with the uncertainties shown in red. The left-hand plot shows the CMASS sample, and the right-hand plot shows the WiggleZ sample. Both plots generally show an increase in density up to 40–60 Mpc, close to our maximum void selection radius, then tamper off. Although the WiggleZ data are noisier, the increasing trend looks plausible though visual examination. Shown with the green dashed line, we fit both density profiles with a linear fit, given by equation (3). This fit is up to 50 Mpc for the CMASS sample and 40 Mpc for the WiggleZ sample, both corresponding to the maximum of the histograms. The CMASS fit deviates from zero by 13σ, while the WiggleZ slope deviates by 1.6σ.
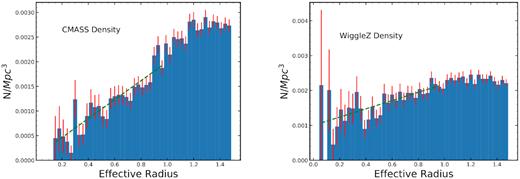
Galaxy number density as a function of void radius in Reff with the uncertainties shown in red. The left-hand plot shows the CMASS sample, and the right-hand shows the WiggleZ sample. The void signal is more apparent in these plots, with the density clearly increasing as we move out from the centre of the void in both. Shown by the green dashed line, we fit both density profiles with equation (4) up to Reff = 1. The CMASS fit deviates from zero by 10σ, while the WiggleZ plot deviates from zero by 4.2σ. The weaker void signal in the WiggleZ galaxies may be attributable to the fact that the void catalogue was constructed from CMASS galaxies. The plot shows that our catalogue of galaxies truly contains void galaxies and the surrounding shell of wall galaxies.
Fig. 6 particularly illustrates that we can be confident that the void catalogue we are using has truly identified underdense regions of the galaxy density field. However, it is important to keep in mind that the WiggleZ population has a slightly weaker void signal, interpreted as the slope’s deviation from zero. This may be attributable to the fact that the void positions are derived from the SDSS sample by Mao et al. (2017). We may now proceed with comparing properties of void and wall galaxies; of particular interest for our analysis are the red-to-blue galaxy number ratio and colour differences between void and wall galaxies. First, we plot the ratio of NCMASS/NWiggleZ galaxies in both the physical and Reff units in Fig. 7. While it is possible that the normalization of the ratios are biased due to survey incompleteness and the exact value depends on the magnitudes and other selections, the observed slope is less subjective to the selection biases. Fig. 7 shows that the red-to-blue galaxy ratio increases with increasing distance from the void centre. Using equation (3), the ratio versus Mpc plot has a slope of 701 ± 121 and thus a 5.8σ deviation from zero. Using equation (4), the ratio versus Reff has a slope of 585 ± 168 and a 3.5σ deviation from zero. Thus, the increase in the ratio with increasing distance from void centre is significant, implying that voids have a larger blue galaxy population percentage than walls. This is a result which has been found before (Szomoru et al. 1996; Popescu et al. 1997; Grogin & Geller 1999; Rojas et al. 2003, 2004; Sorrentino et al. 2006; Tavasoli et al. 2015), though here we use two distinct galaxy surveys.

The number ratio of CMASS (red) to WiggleZ (blue) galaxies in the cosmic voids. We plot the ratio versus distance from void centres in both the physical (Mpc) and Reff units. There is clearly a positive correlation between the ratio and the distance from the void centres. The linear fits are shown in green lines and the fit range for the Mpc and Reff are up to 60 Mpc and Reff = 1, respectively. The Mpc plot has a slope of 701 ± 121, while the Reff plot has a slope of 585 ± 168, yielding 5.8σ and 3.5σ deviations from the zero slope, respectively. This correlation implies a deficit of red galaxies in voids compared to walls.
Next, we perform the KS and student’s t-tests between void and wall galaxies in either the CMASS or WiggleZ sample, separately. This is a more likely analysis for detecting any true colour evolution between void and wall galaxies, because this is testing in a much smaller colour range and largely removes the colour changing effect from a pure density evolution. The KS test yields a KS-statistic of 0.030 and a p-value of 0.21 for g − r colour between void and wall galaxies for the WiggleZ population. For the CMASS sample, the corresponding numbers are 0.016 for the KS-statistic and 0.93 for the p-value. Thus, we cannot reject the null hypothesis that the colour of the both blue and red galaxies across the void and wall populations do not significantly differ from each other. The WiggleZ wall galaxies have a mean g − r colour of 0.800 ± 0.002, while the WiggleZ void galaxies have a g − r colour of 0.793 ± 0.003. The uncertainties of these mean colours are once again given by equation (5). A student’s t-test of the g − r colour in the WiggleZ sample yields a t-statistic of 0.78 and a p-value of 0.44. Again, we cannot conclude that blue galaxies in either the wall or void populations have different mean colours. The CMASS wall galaxies have a g − r colour of 1.729 ± 0.001 and the CMASS void galaxies have a g − r colour of 1.731 ± 0.003. A student’s t-test of the g − r colour in the CMASS sample yields a t-statistic of −0.24 and a p-value of 0.81. Similar to what we have just seen, we cannot conclude that red galaxies in either the wall or void populations are significantly redder. All of our statistical test results are outlined in Table 1.
A comparison of wall and void galaxy colour statistics using the CMASS and WiggleZ samples individually or jointly.
| Wall versus void population | Wall mean g − r | Void mean g − r | KS p-value | KS-value | t-test p-value | t-value |
|---|---|---|---|---|---|---|
| CMASS g − r | 1.729 | 1.731 | 0.93 | 0.016 | 0.81 | −0.24 |
| WiggleZ g − r | 0.80 | 0.79 | 0.21 | 0.030 | 0.44 | 0.78 |
| Combined g − r | 1.298 | 1.210 | 6.9 × 10⁻¹⁸ | 0.092 | 3.3 × 10⁻¹⁵ | 7.9 |
Combining these results with the increasing ratios demonstrated in Fig. 7 shows that the result of measuring an apparent average bluer colour in the void population is the result of varying population densities for red and blue galaxies, but not a true colour difference. Since our samples have been pre-selected to only include luminous and normal galaxies, our analysis results only apply to those galaxies as well. It should also be noted that these results were found to be dependent on the initial void sample, in particular the probability threshold imposed to make sure the voids are not the result of Poisson noise. When the probability threshold is relaxed (more voids but less certain of their validity), we find that blue galaxies in voids are significantly bluer than blue galaxies in walls. Since this result is based on a less pure void sample, we will not discuss its implications further. We find that our results are robust against nearly all other sample cuts we have made, including our choice for the minimum void radius, absolute magnitude bright and faint cut-offs for both the CMASS and WiggleZ samples, colour cut for the CMASS sample, histogram bin sizes, and survey boundaries.
5 COMPARING VOIDS OF VARIOUS SIZES
We also split the void catalogue into three bins of varying sizes to investigate whether the red-to-blue galaxy number ratio depends on the void effective radius. In this analysis, we use all voids with effective radius between 25 and 100 Mpc. We then split these voids into three bins: 25 < Reff < 50, 50 < Reff < 75, and 75 < Reff < 100, which we will refer to as the small, medium, and large voids, respectively. The small void bin contains 128 voids with 4372 CMASS galaxies and 3362 WiggleZ galaxies. The medium void bin contains 64 voids with 4017 CMASS galaxies and 4638 WiggleZ galaxies. The large void bin contains nine voids with 696 CMASS galaxies and 1082 WiggleZ galaxies.
To test whether larger voids exhibit a larger amount of deficit of red galaxies than smaller voids, we compare the red-to-blue galaxy ratios for each of the three bin sizes. Fig. 8 shows the three void bins densities as a function of the Mpc radius, while Fig. 9 uses effective radius. With such few voids and relatively few galaxies, the 75–100 Mpc bin does not yield much useful insight. We once again fit the ratios with linear fits to characterize them – the Mpc plots are fit with equation (3) and the Reff plots are fit with equation (4). The Mpc plots seem to show evidence that the small voids actually have a larger deficit of red galaxies than the medium voids, opposite of what one might suspect. It would seem natural for larger voids to be more sparse than smaller voids. The small voids ratio versus Mpc fit has a slope of 1143 ± 262 and the medium voids a slope of 285 ± 135. This yields a 4.4σ and 2.1σ deviation from zero, respectively. The small voids ratio versus Reff fit has a slope of 612 ± 286 and the medium voids a slope of 427 ± 252, yielding a 2.1σ deviation from zero for the small voids and a 1.7σ deviation from zero for the medium voids.
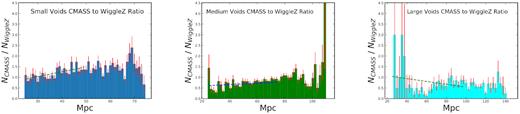
CMASS-to-WiggleZ galaxy ratio plots as functions of distance from void centre in Mpc for small, medium, and large voids, respectively, from the left to right. We fit all the plots with the linear equation (3) to test if the slope is dependent on void size. The small voids’ fit has a slope of 1143 ± 262, 4.4σ deviation from the zero slope, and the medium voids’ fit has a slope of 285 ± 135, 2.1σ deviation from zero. The slopes of small voids and medium voids differ by 2.9σ. The large voids’ ratio profile is dominated by measurement uncertainties.
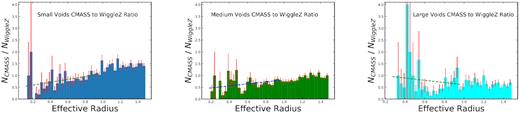
CMASS-to-WiggleZ galaxy number ratio plots as functions of distance from the void centre in Reff for small, medium, and large voids, respectively, from the left to right. The small voids fit has a slope of 612 ± 286 with a 2.1σ deviation from zero, while the medium voids fit has a slope of 427 ± 252 and deviates from zero by 1.7σ. We cannot conclude that there is a significant difference between the small and medium voids red-to-blue ratio profiles. Once again, the large voids ratio profile is dominated by measurement uncertainties.
5.1 Comparison to theoretical predictions
We compare the observational results in Table 1 to results from a theoretical prediction utilizing the Dark Semi-Analytic Galaxy Evolution (SAGE) model (Stevens, Croton & Mutch 2016). Dark SAGE treats the evolution of baryons, and hence galaxies, as a post-processing step of an N-body simulation. While fine structural detail of galaxies is lost, orders of magnitude of computational efficiency is gained through the semi-analytic approach. The details of the Dark SAGE model can be found in Stevens et al. (2016) and we run the model on the Millenium simulation (Springel et al. 2005). For the sake of simplicity, we only present Dark SAGE as run on one simulation and we chose Millennium because the underlying SAGE code base is well tested on this simulation, the data are readily available, and this makes the results of this paper more closely comparable to the multitude of semi-analytic publications that have used this simulation.
In Fig. 10, we demonstrate agreement between the prediction of the semi-analytic model with the results from our analysis. In particular, we calculate SDSS g − r colours for all haloes in the simulation volume as a function of the number of neighbours within an 8 Mpc sphere. We then use the number of neighbours to distinguish between void and wall galaxies (denoted by dashed lines), where void galaxies have fewer than 25 neighbours in 8 Mpc, and wall galaxies have between 50 and 400 neighbours. The gold stars denote the mean colour for void and wall galaxies, resulting in an average colour difference of 0.1 mag, in good agreement with the value determined in this paper (0.09 mag; see Table 1). The green lines on Fig. 10 are the binned data from the model, where each bin contains the same number of galaxies and the length of the line represents the range of neighbour counts included within the bin. Fig. 10 also clearly demonstrates that void galaxies are bluer than their counterparts in more dense environments.
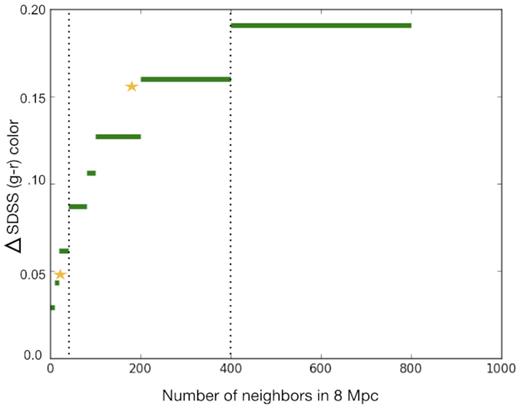
Void and wall galaxy colour differences from a semi-analytic simulation model, where void galaxies (left to the first dotted line) and wall galaxies (between the two dotted lines) are defined based on their number of neighbours within 8 Mpc in the simulation. Stars show the average colours for the void and wall galaxies, and the average colour difference of 0.1 in the model matches the observed value 0.09 (Table 1).
6 DISCUSSION AND CONCLUSIONS
We construct a catalogue of void galaxies along with nearby wall galaxies to probe galaxy densities and colour differences between the two populations. Our sample is selected from a publicly available void catalogue produced by Mao et al. (2017), BOSS CMASS data, and the WiggleZ Dark Energy Survey. After identifying void galaxies through their accurate distances from spectroscopic redshifts, we test for the void signal to demonstrate that our catalogue galaxies lie in and around voids. We then analyse the number ratio between CMASS and WiggleZ galaxies as a function of distance from the void centres, demonstrating that voids tend to have proportionally fewer red galaxies than walls galaxies. Finally, we use KS and student’s t-tests to compare galaxy colours between void and wall galaxies either using the CMASS and WiggleZ samples jointly or individually. While significant colour difference is found between void and wall galaxies in the CMASS–WiggleZ joint sample, we find no significant colour difference between the void and wall galaxies when analysing the CMASS or WiggleZ samples individually. This shows that void galaxies do not tend to be truly bluer than wall galaxies at our magnitude range of MR ≲ −20, indicating that true colour difference between wall and void galaxies does not contribute to the observed average colour difference when combining the red and blue galaxy samples. This, combined with our red-to-blue galaxy number ratio analysis, indicates that a deficit of red galaxies, and not a true colour difference, is the driver of the observed colour difference between void and wall galaxies.
These results have implications for how the environment affects the evolution of galaxies – the deficit of red galaxies in the void environment can be the results of less frequent mergers in voids compared to high-density regions. However, galaxies assembled in voids, while more likely to be late-type blue galaxies, may follow evolution paths similar to their counterparts in walls, since we do not find significant intrinsic colour difference between the void and wall galaxy samples for either red or blue galaxies to absolute magnitude limits of ∼−20 to −21 for blue and red galaxies, respectively, which is close to the M* ∼ −21.8 of galaxies at z ∼ 0.5 (e.g. Bell et al. 2003; Dai et al. 2009). Thus, our analysis results apply to luminous and normal galaxies.
There are several previous analyses on the topic of colour difference between void and wall galaxies. While studies of nearby voids have the advantage of probing the low end of the luminosity function to dwarf galaxies, these analyses do not have large enough sample volume to build up a large sample of luminous void galaxies. Our analysis, in contrast, has the largest sample of luminous and normal galaxies, and has no sensitivity for dwarf galaxies. Ideally, we should combine the advantage from both analyses from nearby or higher redshift void studies to comprehensively understand void galaxies.
Rojas et al. (2004) showed that there is an observable g − r colour difference between nearby (comoving − distance < 260 Mpc) void and wall galaxies in the luminosity range of −22.5 < Mr < −13.5 with a KS p-value of 0.002, while having no statistically significant difference in their Sérsic indices. Further, their void and wall galaxy samples have similar surface profiles, indicating that the colour difference may have some ground in true colour difference, in contrast to our analysis results. When splitting the samples by Sérsic indices at n = 1.8, as a proxy for splitting by galaxy type, they found void galaxies were significantly bluer in both of the child populations, even when accounting for magnitude differences. Hoyle et al. (2012) performed much of the same analysis as Rojas et al. (2004), though with the advantage of using the later data releases of SDSS, increasing population size of both the voids and void galaxies. They largely find results similar to Rojas et al. (2004), though with more statistical significance. Again, the sample studied by Hoyle et al. (2012), with a max redshift of zmax = 0.107, is still significantly less distant than the void galaxies we study in this analysis. This allows the authors to study much more faint galaxies than we have access to, −22.5 < Mr < −13.5 for Rojas et al. (2004) and −23 < Mr < −12 for Hoyle et al. (2012). It is worth noting that our lack of colour difference is consistent with the findings in Penny et al. (2015), wherein the authors found no significant colour difference between void and non-void galaxies sub-classified as strong active galactic nucleus (AGN), weak AGN, star-forming, retired, and passive galaxies. These results were found with galaxies up to z ∼ 0.1 and Mr < −18.4. The key difference then, between our study, Penny et al. (2015), and those of Rojas et al. (2004) and Hoyle et al. (2012), seems to be the magnitude depth achieved, though the lack of colour difference between our blue void and wall galaxies is still in tension with Hoyle et al.'s (2012) findings of a colour difference at all luminosities, possibly due to their relatively small sample size for normal and luminous galaxies.
Combining the results from this study, which has the largest sample for the normal and luminous galaxies, and those from local voids, a converging picture is that there is little environmental-dependence galaxy evolution for normal and luminous galaxies between the void and wall environments, except that the red galaxy numbers are dictated by the mergers which is environmental-dependent. For dwarf galaxies, the environmental effects are much stronger and can result in intrinsic colour differences for dwarf galaxies in the void or wall regions.
It is of importance to emphasize that in this study, the void catalogue is produced using CMASS data. This may well introduce a selection bias between the red and blue populations. It would be informative to reproduce these results with a void catalogue produced from a blue galaxy survey, as this study, as well as most other void studies, derive their voids from surveys which favour red galaxies, particularly due to SDSS’s large sample size. Future surveys, or even the full WiggleZ catalogue, could make such analysis possible.
ACKNOWLEDGEMENTS
We thank J. N. Bregman, C.-H. Chuang, and Y. Wang for the helpful discussion and comments. We acknowledge the financial support from the National Areonautics and Space Administration Astrophysics Data Analysis Programs NNX15AF04G, NNX17AF26G, and National Science Foundation grant AST-1413056.
