-
PDF
- Split View
-
Views
-
Cite
Cite
Rashi Jain, S Vig, S K Ghosh, Investigation of the globular cluster NGC 2808 with the Ultra-Violet Imaging Telescope, Monthly Notices of the Royal Astronomical Society, Volume 485, Issue 2, May 2019, Pages 2877–2888, https://doi.org/10.1093/mnras/stz544
Close - Share Icon Share
ABSTRACT
Globular clusters represent stellar laboratories where observations can be used to validate models of stellar evolution. In this study, we put forth new ultraviolet (UV) photometric results of stars in the Galactic globular cluster NGC 2808. NGC 2808 is known to host multiple stellar populations that include at least four distinct groups of horizontal branch (HB) stars. We have observed this cluster with the AstroSat-UltraViolet Imaging Telescope in two far-UV (FUV) and five near-UV (NUV) filters, respectively. These UV filters enable the identification of HB populations of stars. The results from four NUV filters exhibit bimodal distributions in magnitude histograms. The nature of bimodality has been investigated on the basis of distinct stellar types contributing to those bands. The colour–magnitude diagrams constructed using FUV and NUV filters enable the location of hot stellar populations, viz. stars belonging to red HB (RHB), blue HB, extreme HB, blue hook branch, and post-asymptotic giant branch. Prominent gaps are observed in the UV colour–magnitude diagrams. We report for the first time a photometric gap in an NUV colour–magnitude diagram that segregates the RHB population of this cluster into two groups that are likely to be associated with distinct generations of stars. We also investigate the spatial density distributions of various groups of stars in the cluster and comment on the proposed formation models of multiple populations.
1 INTRODUCTION
Stars in globular clusters (GCs), being the oldest population in the Galaxy, form an ideal test bed for stellar evolution theories owing to their sheer numbers, metallicities, assorted stellar populations, and visibility due to negligible interstellar medium in the halo. In addition, having a statistical advantage of millions of stars as members, most of the stars are well resolved for a detailed scrutiny leading to a sampling of even the short-lived populations (van den Bergh 1993). Although significant advances have been made in our understanding regarding the evolution of stars, ambiguities and gaps remain (Moehler 2001). Unlike the optical wavebands, where a large body of work on GCs has been carried out, ultraviolet (UV) studies of globular clusters have been relatively sparse (Dieball et al. 2005; Dalessandro et al. 2012). Certain evolved populations are brighter in the UV as compared to the optical, due to various effects that include significant mass loss and metallicity. The main UV contributors in GCs are the horizontal branch (HB) stars, the asymptotic giant branch (AGB) population, the blue stragglers (BSs), and the white dwarf stars (Zinn, Newell & Gibson 1972; Harris, Nemec & Hesser 1983).
The HB stars are central core helium burning low-mass stars whose effective temperatures are expected to reach up to ∼45 000 K (Castellani, degl’Innocenti & Pulone 1995). They produce copious amounts of UV flux during this core He burning (CHeB) stage. The horizontal branch itself is not comprised of a simple stellar population and it is an aggregate of groups of stars separated by gaps in the colour–magnitude diagrams (CMDs), i.e the red horizontal branch (RHB), blue horizontal branch (BHB), and extreme horizontal branch (EHB; Catelan et al. 1998; Ferraro et al. 1998; Dalessandro et al. 2011). Among the HB group of stars, the RHB stars are the cooler stars, which lie towards the red end of the HB. Their effective temperatures are expected to be in the range ∼5000–6200 K (Afşar, Sneden & Fo 2013). These have also been referred to as ‘red clump stars’ (D’Antona & Caloi 2008; eg. Brown et al. 2016). In accordance with the definition of Catelan (2009) and following Marino et al. (2014), we address these stars as ‘RHB’ in this work. These stars are cooler than the RR Lyrae instability strip. The BHB stars lie on the hotter bank of the instability strip. In addition, there is a group of stars that are very luminous in the far-UV (FUV), and these are believed to be in their post core helium burning stage or post-AGB phase.
It is still not understood how various parameters affect the HB morphology. One of the parameters is the mass loss during the red giant branch (RGB) phase. The HB stars have a core mass of ∼0.5 M⊙ surrounded by a hydrogen-rich envelope (Iben & Rood 1970; Moehler 2010). The mass of the hydrogen envelope that surrounds the core could be related to the spread of stars along the blue HB, and those with thinner envelopes are expected to reside towards the farther end of the BHB. If the mass of the H-rich envelope exceeds 0.02 M⊙, the H shell burning is expected to remain active during the HB lifetime and later as it evolves towards the AGB phase, subsequent to the exhaustion of helium in its core. These represent the BHB stars. On the other hand, if the mass of the H envelope is less than 0.02 M⊙, the H shell burning cannot be sustained and the star directly evolves towards the white dwarf sequence. These hot but faint stars that are lower in mass are called EHB stars. They do not ascend along the AGB but proceed towards becoming white dwarfs. They have effective temperatures ranging between 20 000 and 31 500 K (Moehler, Heber & Rupprecht 1997). The transition from BHB to EHB stars takes place at the fainter end of the blue tail of a globular cluster in UV–optical CMDs (Ferraro 2010; Moehler 2010). Unlike the RHB and BHB stars, which have undergone helium flash at the tip of the red giant branch (TRGB), the EHB stars are those that have suffered heavier mass loss and are likely to experience helium flash anywhere between the TRGB and the top of the white dwarf cooling curve. Stars that suffer from even higher mass loss undergo a helium flash at even later stages of their descent along the white dwarf cooling curve. These stars are known as ‘late hot flashers’ or blue hook stars (Brown et al. 2001). Blue hook (BHk) stars constitute a rare group of stars that have been found in a few GCs (Moehler et al. 2002). Metallicity is another parameter that is believed to play a key role in determining the morphology of the HB. Metal-poor clusters tend to have a HB that is extended farther out towards the bluer end, with a conspicuous EHB and BHk population (Dalessandro et al. 2011).
The presence of an RHB and BHB is found in many GCs, although the fractional populations and HB morphology may vary by degrees. High-resolution spectroscopy of a few GCs have revealed metallic abundances and chemical inhomogeneities that are expressed as multiple main sequences, broadened subgiant branches, and split red giant branches, which are referred to as ‘multiple stellar populations’ (Bedin et al. 2004; Bellini et al. 2010; Piotto et al. 2012; Milone 2016). The puzzling chemical compositions analysed through extensive spectral and photometric investigations have been ascribed to mechanisms such as multiple star formation bursts (Carretta et al. 2007), rotation effects (Renzini 1977), pollution by AGB stars (Gratton, Sneden & Carretta 2004), and unusually high mass loss (Brown et al. 2001).
The UV arena provides a unique opportunity to investigate the hot stellar populations of globular clusters, thus enabling a glimpse into processes dominating in the later evolutionary stages of stars. The UV studies (λ ≲ 300 nm) are difficult to accomplish owing to atmospheric opacity, and our understanding of globular clusters has benefitted immensely from the few UV space missions that have been achieved, such as the Hubble Space Telescope (HST; Dalessandro et al. 2013), the Galaxy Evolution Explorer (GALEX; Schiavon et al. 2012), the International Ultraviolet Explorer (IUE; Code 1982), and the SWIFT-Ultraviolet/Optical Telescope (UVOT; Holland 2007), to name a few. The latest observatory to join the group isAstroSat, which houses the Ultra-Violet Imaging Telescope (UVIT). UVIT, with its multiple far- and near-UV (NUV) filters provides a novel opportunity to analyse the hot populations of globular clusters. The combination of a large field of view (∼28 arcmin) and a moderately high angular resolution (1.2 arcsec) facilitates the imaging and examination of intermediate and outer radial regions of globular clusters in exceptional detail. Towards this end, we have investigated NGC 2808, an old globular cluster with intermediate metallicity that possesses an extended horizontal branch and hosts multiple stellar populations.
NGC 2808 is an old Galactic globular cluster (age 10.9 ± 0.7 Gyr) with a distance modulus (m − M)V = 15.79 (Bedin et al. 2000) and metallicity [Fe/H] = −1.24 (Carretta & Gratton 1997). This GC displays a multimodal HB star distribution (Harris 1974). The HB exhibits three distinct gaps in the CMDs with an anomalous blue tail extending considerably towards very high temperatures. The blue HB of the cluster is found to have clumpy distribution with two narrow gaps (Sosin et al. 1997) that bifurcate the HB stars into four distinct populations. These represent the RHB, BHB, EHB, and BHk contents of the cluster. Dalessandro et al. (2011) correlated these branches of HB to the multiple populations of the main sequence in the cluster, reported by Piotto et al. (2007). The BHB stars were correlated to models with high helium content, Y = 0.3 [progeny of normal-main-sequence (MS) population], while RHB stars were matched by models with Y = 0.24 (red MS) and EHB stars were mapped to blue MS (Y = 0.4) by D’Antona & Caloi (2008). It is now established that NGC 2808 hosts at least five populations of stars (Carretta 2015; Milone et al. 2015). An elaborate study has been carried out by Moni Bidin et al. (2011) to identify HB stars in NGC 2808 using spectroscopy. In addition, Gratton et al. (2011) spectroscopically classified HB stars of NGC 2808 using Na–O anticorrelation. The UV wavebands provide a singular platform to testify the origin of a clumpy distribution of hot stars. Using GALEX, Schiavon et al. (2012) investigated a number of GCs including NGC 2808 and distinguished post-AGB (PAGB) and post-(early)-AGB stars in these clusters using CMDs. TheGALEX field of NGC 2808 in the FUV is shown in Fig. 1. In this study, we investigate the hot population of the cluster in the ultraviolet realm of UVIT.
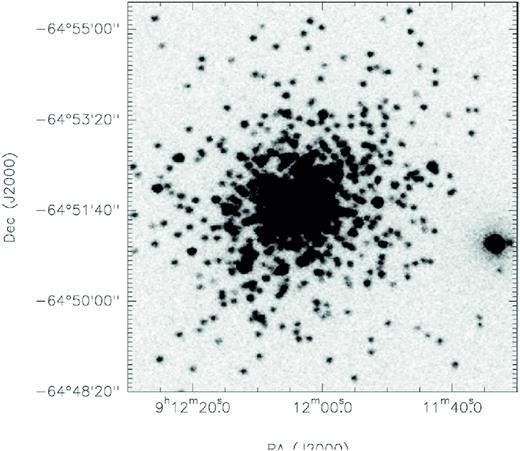
The Galex FUV broad-band image of the globular cluster NGC 2808.
In Section 2, we present the UV observations and procedures adopted for data reduction and analysis. The results are described in Section 3 and discussed in Section 4. The article concludes with a brief summary in Section 5.
2 OBSERVATIONS AND DATA REDUCTION
2.1 AstroSat – UVIT observations and pipeline reduction
The UVIT onboard AstroSat has been used to image the globular cluster NGC 2808. AstroSat is India’s first space-based multiwavelength mission (Agrawal 2004) that observes simultaneously in UV, visible, and X-rays. UVIT has a twin telescope system with a diameter of 38 cm, in Ritchey–Chretien configuration. One of the telescopes is dedicated for observations in the FUV and the second telescope observes in the NUV and visible channels. UVIT is primarily an imaging instrument and covers a circular field of view of ∼28 arcmin. The spatial resolution achieved by UVIT in the FUV and NUV is <1.5 arcsec, while it is <2.2 arcsec in the visible channel. Each channel (FUV, NUV, and visible) consists of a number of selectable filters with smaller passbands. Further details about UVIT and the instrument performance can be found in Tandon et al. (2017b).
NGC 2808 was observed by UVIT on 2017 April 4, in two FUV and five NUV filters. The data from simultaneous imaging in a neutral density visible filter were used for aspect reconstruction during the post-observation data-processing stage. The filters used during the observations were F154W and F169M in the FUV and N242W, N219M, N245M, N263M, and N279N in the NUV. The details of the filters are listed in Table 1. The exposure times of observations through various filters are also listed in the table. The Level-1 data products made available by the Indian Space Science Data Centre (ISSDC/ISRO) were processed using the UVIT Level-2 Pipeline (ul2p) version V5.6. The final products generated by the ul2p include fits images of the sky. The images cover the field of view with a pixel size 0.41 arcsec × 0.41 arcsec. These images have been used for this study. The pipeline corrects for various instrumental effects such as spacecraft drifts, jitters, thermal effects, and other corrections required for astronomical imaging. The final output comprises an image through each (NUV/FUV) filter along with the corresponding uncertainty image. The intensity unit of the images is in counts s−1. The angular resolution achieved in the images is ∼1.2 arcsec, superior to that of GALEX (∼6 arcsec).
| Band . | Filter . | Alternate . | λmean . | δλ . | ZP mag . | Exposure time . | Sensitivity limit . | Number of . | Number of . |
|---|---|---|---|---|---|---|---|---|---|
| . | . | name . | (Å) . | (Å) . | . | (sec) . | (AB mag for SNR = 3.5) . | stars . | saturated stars . |
| FUV | F154W | BaF2 | 1541 | 380 | 17.77 ± 0.01 | 4172 | 24.034 | 905 | 1 |
| FUV | F169M | Sapphire | 1608 | 290 | 17.45 ± 0.01 | 3553 | 23.548 | 855 | 1 |
| NUV | N242W | Silica | 2418 | 785 | 19.810 ± 0.002 | 403 | 23.542 | 1556 | 21 |
| NUV | N219M | NUVB15 | 2196 | 270 | 16.59 ± 0.02 | 3494 | 22.667 | 905 | 2 |
| NUV | N245M | NUVB13 | 2447 | 280 | 18.50 ± 0.07 | 477 | 22.415 | 1379 | 5 |
| NUV | N263M | NUVB4 | 2632 | 275 | 18.18 ± 0.01 | 348 | 21.752 | 1275 | 10 |
| NUV | N279N | NUVN4 | 2792 | 90 | 16.50 ± 0.01 | 2639 | 22.155 | 1810 | 1 |
2.2 Additional data reduction and photometry
Long (>2000 s) on-target observations of UVIT are generally split into exposures in multiple orbits (as UVIT can operate only during the ‘dark’ part of each orbit when the spacecraft is in Earth’s shadow). The ul2p processes data sets from individual orbits to generate sky images from each of them as well as combined products from all orbits contributing to the on-target integration. The ul2p pipeline includes an astrometry block at the very end of the processing sequence, which uses a set of brightest stars detected in the UV image and their coordinates are correlated with entries in the optical catalogue USNO-A2.0. In our case, the astrometry block of ul2p was unable to refine the absolute aspect of the sky images due to the crowded field of NGC 2808. Accordingly, an additional reduction scheme was employed to improve the aspect. This scheme used the iraf task ccmap by considering 10 bright stars from the USNO-A2.0 catalogue distributed across the field of view. The positions of the sources are found to be uncertain up to ∼1.0 arcsec after the corrections were applied.
The images of NGC 2808 through the FUV filter F154W and NUV filter N242W are displayed in Fig. 2. A comparison between the images shows that the NUV is substantially crowded across the field whereas the FUV is relatively sparse, as expected. Thus, the stars in the inner central region were resolved in the FUV, whereas in the NUV the field is considerably crowded near the cluster core.
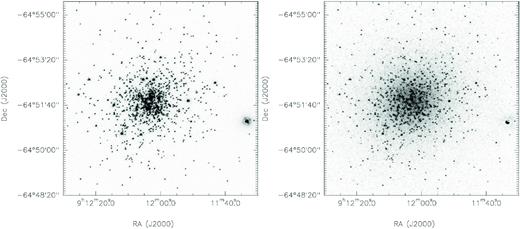
The UVIT images of the globular cluster NGC 2808. The FUV F154W image is shown in the left-hand panel, while the NUV N242W image is displayed in the right-hand panel.
2.2.1 Photometry
We performed photometry on the images in order to extract the magnitudes of stars in all the UV filters. For this, we used a combination of daophot and SExtractor (se). We employed the daophot subroutine, daofind, to locate the stars in the field and phot for the initial-level aperture photometry. The results from phot are used to construct a point spread function (PSF) model using bright stars in the field and then the subroutine allstar was used to perform the PSF photometry.
Here, mZP represents the zero-point magnitude of the filter, taken from Tandon et al. (2017a), and CPS is the integrated counts s−1 due to the star. The ZP magnitudes as well as their uncertainties are listed in Table 1. The error in AB magnitude for each UV filter has been estimated considering (i) the uncertainties in CPS arising from Poisson noise of the photon-counting detector and (ii) the error in the ZP magnitude from calibration uncertainties. A plot showing the variation of errors as a function of magnitude is displayed in Fig. 3, each line representing one UV filter.
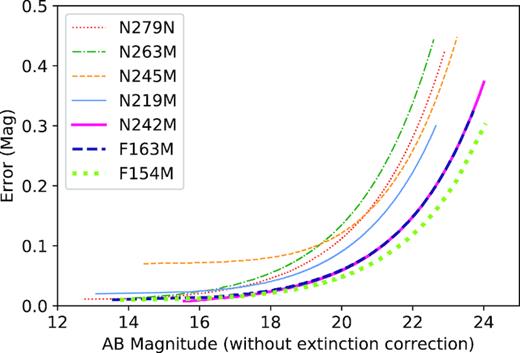
The variation of error as a function of AB magnitude (without extinction correction) for the sources detected in the UVIT filters.
The bright stars in the field are likely to be affected by saturation. In particular, stars that are brighter than the zero-point magnitude by 1.95 mag or more (in a given filter) are likely to be severely affected. We have corrected for saturation using the procedure described by Tandon et al. (2017a). The number of stars saturated in each filter is listed in Table 1. We find that the brightest star is heavily saturated in all the UV filters. This star is located at (α, δ)J2000 = 9h11m33|${^{\rm s}_{.}}$|32, −64°51′03|${^{\prime\prime}_{.}}$|30, which is 3.25 arcmin from the cluster centre. It was not possible to correct for saturation for this star and therefore, the given magnitudes of this stars represent lower limits to its brightness.
In addition to the above procedures, the field of NGC 2808 was also visually scrutinized through each filter in order to separate out closeby stars that were identified as a single star by daophot and se. The magnitudes of these stars were estimated manually through aperture photometry. Aperture photometry was also carried out for a few faint stars that were not picked by either of the software. Finally, the stars detected through each filter were compiled to construct a catalogue of UV stars. It is to be noted that the number of stars detected through a given filter depends on the exposure time and effective area of the filter. In order to have a magnitude-limited sample through each filter, we considered those stars in this study that were brighter than the magnitude corresponding to a signal-to-noise ratio (SNR) of 3.5. The AB magnitudes corresponding to this sensitivity limit are given in Table 1. Note that these values represent native limits that have not been corrected for extinction. The total number of UV stars detected is 2253, of which 484 are common to all the UV filters. The number of stars detected through each UVIT filter is listed in Table 1. In the FUV, we detected more than 900 stars. Nearly double the number of stars were detected in a few NUV filters.
2.2.2 Extinction correction
Extinction correction of stellar magnitudes is important for ultraviolet wavebands. An accurate analysis requires the knowledge of foreground extinction of the cluster. The integrated colour and spectral type of the cluster gives the value of selective extinction (EB − V) to be 0.18 towards this cluster (Bedin et al. 2000). Adopting the ratio of total-to-selective extinction as R|$v$| = 3.1 (Whitford 1958) for the Milky Way, the extinction co-efficient in the visible is AV = 0.54. The AV is used to determine extinction co-efficients Aλ for all passbands using the reddening relation of Cardelli et al. (1989). Table 2 summarizes the values of Aλ estimated by interpolation.
Extinction values through the UVIT filters corresponding to A|$v$| = 0.54 based on the extinction law given by Cardelli, Clayton & Mathis (1989).
| Filter . | λmean (νm) . | Aλ(mag) . |
|---|---|---|
| F154W | 1541 | 1.46 |
| F169M | 1608 | 1.43 |
| N242W | 2418 | 1.40 |
| N219M | 2196 | 1.77 |
| N245M | 2447 | 1.36 |
| N263M | 2632 | 1.18 |
| N279N | 2792 | 1.09 |
| Filter . | λmean (νm) . | Aλ(mag) . |
|---|---|---|
| F154W | 1541 | 1.46 |
| F169M | 1608 | 1.43 |
| N242W | 2418 | 1.40 |
| N219M | 2196 | 1.77 |
| N245M | 2447 | 1.36 |
| N263M | 2632 | 1.18 |
| N279N | 2792 | 1.09 |
3 RESULTS
Having carried out photometry on the images of NGC 2808 and constructed a catalogue of UV stars, we proceed towards the understanding of hot stellar populations that contribute to the UV. We begin with understanding the magnitude distribution of stars through various filters.
3.1 UV magnitude distribution
The magnitude distributions of the UV stars of NGC 2808 through the various filters of AstroSat are displayed in Fig. 4. We observe that the distributions through both the FUV filters are unimodal and quite similar. Most of the stars lie in the magnitude range 16–9 mag, and the peak of the distribution is ∼18 mag. The magnitude distributions display a sharp decline from the peak towards the brighter magnitudes whereas the drop is more gradual towards the fainter side. We expect the FUV field to be dominated by the hottest sub-populations of HB stars, which is likely to explain the lack of bimodality in the distribution of the FUV magnitudes. The similarity in the magnitude distributions is attributed to the fact that the cut-off wavelengths of the two FUV filters are quite similar (1340 Å for F154W and 1420 Å for F169M). This implies that the presence of any absorption lines in the cut-off interval, 1340–1420 Å, is unlikely to play an important role in the hot stellar populations sampled by the FUV. The FUV spectroscopy of hot stars in this cluster by Brown et al. (2012) confirms this view.
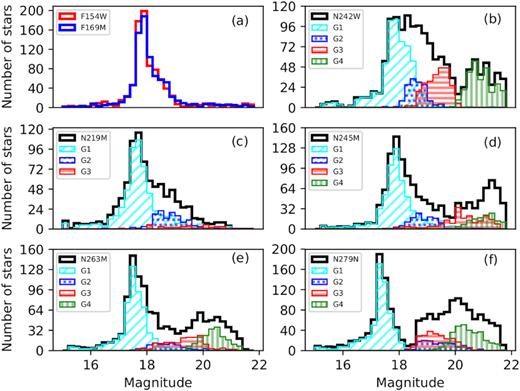
The magnitude distribution of the cluster members of NGC 2808 through various AstroSat-UVIT filters. The total number of stars in each magnitude bin for NUV filters has been decomposed into various sub-groups of stars based on the classification from the CMD of N242W-N279N versus N242W (see Section 3.3.2). Note that |${\sim }60{{\ \rm per\ cent}}$| of the total stars are detected in these two filters. The numbers of stars corresponding to each of the four sub-groups have been overplotted for each NUV filter. The histogram in panel (a) shows the magnitude distribution of both the FUV filters, while panels (b), (c), (d), (e), and (f) exhibit the magnitude distributions through the NUV filters N242W, N219M, N245M, N263M, and N279N, respectively.
The NUV filters, on the other hand, exhibit unimodal and bimodal distributions. The filter N219M shows a single broad peak unlike the other NUV filters that display bimodality in their magnitude distributions. The presence of bimodal peaks primarily points towards the segregation of hot stellar populations in the respective filter, albeit in a complex way. The wide-band NUV filter N242W displays two peaks, wherein the brighter (primary) distribution peaks at ∼18.5 mag, has a larger number of stars, and is broad. The bimodal separation is observed at 20 mag in this filter. We note that sensitivity prevents the detection of cluster members beyond 22 mag; hence, we refrain from commenting on the width of the secondary peak. The medium bandwidth filters include N219M, N245M, and N263M. Among them, N219M, which is the shortest waveband filter in the NUV, displays a single-peaked distribution centred around 17.5 mag. Moreover, the distribution is perceived to be skewed with a gradual decline towards the fainter side of the peak, unlike the lowering towards the brighter edge. The other two medium-band filters, N245M and N263M, both display bimodality, with the former showing a narrower secondary peak compared to the latter. N279N, the narrow-band filter at the longest NUV waveband, reveals a narrow primary distribution and broad secondary distribution. In the three NUV narrow- and medium-waveband filters displaying bimodality, we observe that the magnitude bin separating the primary and secondary distributions shifts towards the brighter side as the wavelength increases. This is likely to be related to the stellar population distribution and we discuss this in later sections.
3.2 Identification of hot stellar populations
NGC 2808 has been very well studied at a multitude of wavelengths, spanning from the UV to the near-infrared. Imaging as well as spectroscopy has led to an understanding of various stellar populations of this globular cluster. In this section, we elaborate on the identification of various hot stellar populations in our UV catalogue from other works in the literature. The purpose of the cross-identification is to understand and interpret the location of these populations in the colour–magnitude space of the UV filters of AstroSat-UVIT.
Red horizontal branch and blue horizontal branch stars: Gratton et al. (2011) spectroscopically identified 49 RHB stars and 36 BHB stars in NGC 2808. The identification is based on the anticorrelation between Na and O discerned in HB stars of globular clusters. The RHB stars are characterized by Na-poor and O-rich content while the BHB stars have an Na-rich and O-poor composition (Carretta et al. 2009; Gratton et al. 2011). We find a match of 34 RHB and 35 BHB stars in the cluster as the rest are from the central region excluded from our analysis.
Extreme horizontal branch stars: Moni Bidin et al. (2011) identified 8 EHB stars from the catalogue published by Momany et al. (2003). They employed a temperature criterion of the zero-age HB model in their optical colour–magnitude diagram to identify the association. We have identified all the 8 EHB sources in our catalogue.
Blue-hook stars: Moehler et al. (2004) performed ground-based spectroscopy for stars in NGC 2808 that were identified as BHk stars. All these stars are located beyond 2 arcmin from centre of cluster. All the 19 BHk stars from their sample have been matched in our catalogue.
Post-AGB, post-early-AGB, and AGB-manque stars: Schiavon et al. (2012) have studied several GCs in UV using GALEX, and published a list of PAGB, post-early-AGB, and AGB-manque stars in these clusters. Towards NGC 2808, their list comprises 22 stars belonging to this UV-bright category. All these UV-bright stars have been identified in our catalogue.
We observe that there are overlaps between classifications among our cross-matched samples: 5 BHB stars are also classified as BHk stars, 2 stars are classified as BHB and PAGB, and 1 star is common in the catalogues of BHk and PAGB.
3.3 UVIT colour–magnitude diagrams
In this section, we discuss the UV colour–magnitude diagrams and analyse them based on the known stars of different stellar populations. We continue to refer to the term ‘colour’ in spite of the fact that responses of some filters overlap in wavelength. In other words, the ‘colour’ derived from overlapping filters cannot be directly used as a proxy of effective temperature, although they are expected to be related in an intricate way. In certain cases, where the filter responses are completely non-overlapping (e.g. colours corresponding to FUV–NUV and N245M–N279N), they can directly probe the effective temperatures.
3.3.1 FUV–NUV colour–magnitude diagram
Considering that we have 2 FUV filters and 5 NUV filters, a large number of colour–magnitude diagrams CMDs are feasible. However, in this work, we consider only those diagrams where we discern a notable segregation of stars. Among the two FUV filters, we can select any one, as the number of stars and magnitude distributions are similar. We consider F154W for the present case. Among the NUV filters, we use N279N as we find that the colours associated with this filter exhibit a bimodal distribution, unlike the other filters. The CMD of F154W – N279N versus N279N is displayed in Fig. 5. Also overplotted on this CMD are the BHB, EHB, BHk, and PAGB stars identified from the literature (Section 3.2). The known RHB stars were not detected in the FUV and hence they are not present among the sample. We observe that the various stellar groups appear well separated.
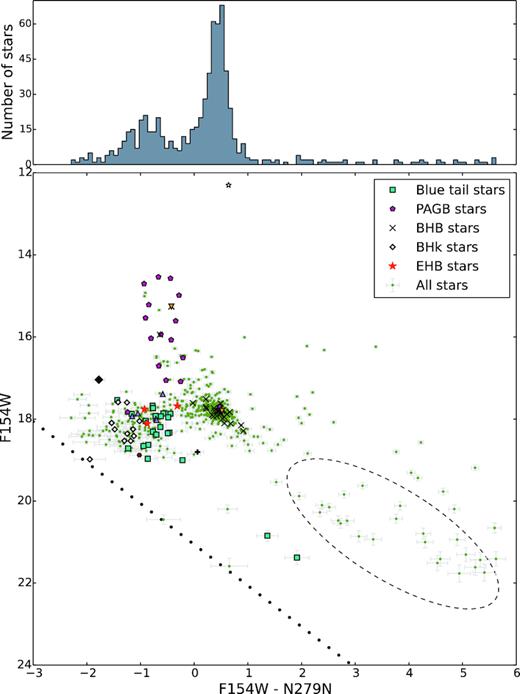
The FUV–NUV CMD constructed using F154W – N279N versus F154W. The histogram on the colour axis exhibits the colour distribution of all the stars plotted here. Stars identified using other catalogues (see text for details) are marked using symbols shown on the top-right in the CMD. The stars that have overlaps between catalogues are represented by black filled diamonds (BHk as well as PAGB), orange inverted triangles (BHB and PAGB), violet triangles (EHB as well as BHk), filled hexagon (BHk and blue tail), and ‘ + ’ (BHB and blue tail). The dashed elliptical region encircles the region likely to be occupied by blue straggler stars. The green filled circles are the other stars common to F154W and N279N filters that have not been identified earlier. The unfilled asterisk represents the brightest star in the cluster, which is saturated in all bands. The sensitivity limit is translated to the dotted line shown in the figure.
The BHB group of stars occupies the region associated within the colour range −0.7–1 in the FUV–NUV colour–magnitude plane. A majority of the stars detected in these two filters belong to the BHB group, evident from the colour histogram. The stars hotter than BHB stars occupy a region within the colour range −2.5 – −0.5 on the colour axis. This group of hotter HB stars comprises EHB and BHk stars of the cluster. The BHB group is separated from the group of EHB and BHk stars by a jump, which is reported to be a ubiquitous feature of the GCs hosting BHB and EHB stars (Brown et al. 2001). This jump, also known as the ‘Momany jump’ (M-jump; Momany et al. 2004), corresponds to a temperature ∼20 000 K. In our filters, we associate this jump with a colour corresponding to −0.7 mag. The BHks occupy the hotter end of the CMD while the EHB group is intermediate, between the BHk and BHB stars. There is a superluminous sub-population that occupies the magnitude range 17–14 in the FUV. These stars belong to the PAGB and post-early-AGB stages. The number of stars belonging to this group is smaller than the HB population, and they are sparsely distributed towards the brighter side of the magnitude range. There are a few stars that are subluminous in the FUV and and are very red in the CMD, encircled within a dashed ellipse in Fig. 5. It is possible that a few of these belong to the blue straggler category (Brown et al. 2001). BS stars are more massive than the main-sequence turn-off stars, and their presence is ascribed to mass transfer or collision (Carney et al. 2001; Mapelli et al. 2006). The blue square symbols in the figure represent stars classified as blue-tail stars, defined later in Section 3.3.2.
3.3.2 NUV–NUV colour–magnitude diagrams
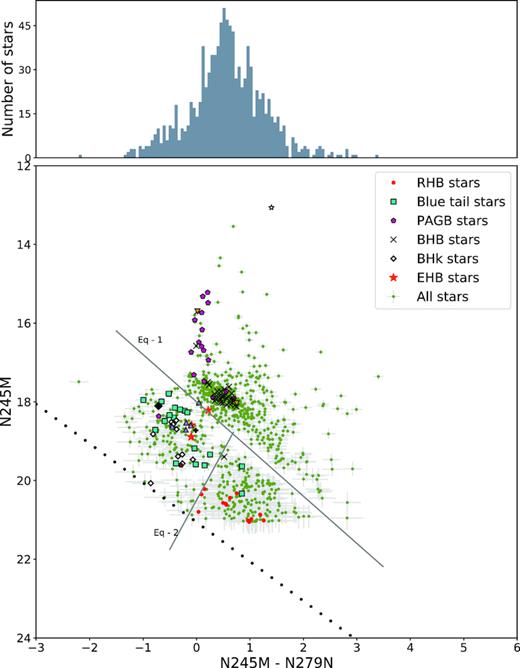
The CMD constructed using N245M – N279N versus N279N. The green filled circles represent stars common to N245M and N279N filters that have not been identified in earlier studies. The other symbols are the same as those shown in Fig. 5. The solid lines are used to demarcate the gaps (discussed in the text) and are represented by equations (1) and (2).
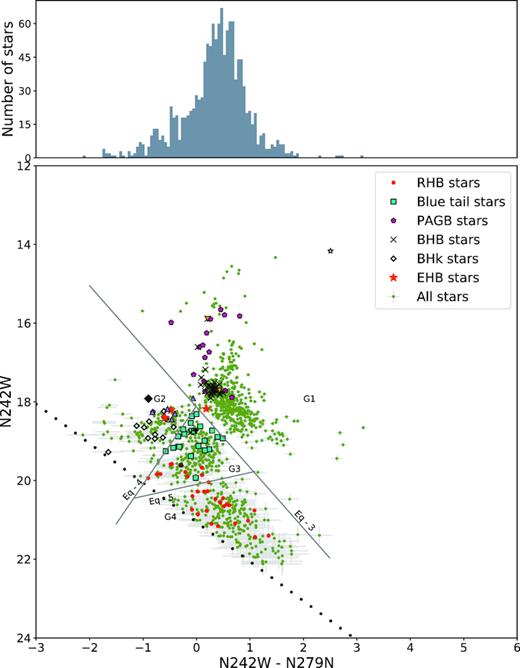
The CMD constructed using N242W – N279N versus N242W. The green filled circles represent stars common to N242W and N279N filters that have not been identified in earlier studies. The other symbols are the same as those shown in Fig. 5. The solid lines are used to demarcate the gaps (discussed in the text) and are represented by equations (3), (4), and (5).
In order to validate this segregation, we located the positions of these groups of RHB stars in the NUV–NUV CMD considered earlier, i.e. N245M – N279N versus N245M (Fig. 6). The various groups of stars in the CMD are distinguished by different colours in Fig. 8. The two groups of RHB stars are clearly differentiated in this CMD although no gap is present between the two groups. The G4 stars are bluer than the RHB stars of G3 in the N245M – N279N colour and the merging of the two classes appears gradual. This visibly demonstrates the presence of two groups of RHB stars in this cluster. We notice that a few G4 stars also belong to the EHB–BHk categories of stars. We speculated on the nature of these stars and found that these stars are FUV bright. This group of stars is unlikely to be affiliated to the RHB group since they are hot enough to be observed in FUV filters. Their distribution in the CMD constructed using filters F154W and N279N indicates that these belong to the hot HB group. We term these stars ‘blue-tail stars’, as their nature (EHB/BHk member) is not certain.
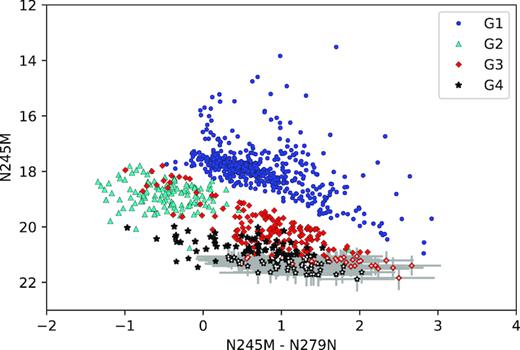
The CMD constructed using N245M – N279N versus N245M. The colours represent different groups of stars identified from Fig. 7. The open symbols with errorbars (shown in grey) represent stars below the sensitivity limit considered, i.e. stars identified in these two filters (N245W and N79N) whose 2.5 ≲ SNR ≲ 3.5.
We distinguish between the two RHB groups (excluding the blue-tail members), by naming the RHB stars in G3 ‘RHBI’ and those in G4 ‘RHBII’. We note that a few RHB members detected in the N242W and N279N filters are not detected above the considered sensitivity limits of N245M. However, they are faint and have been detected, albeit with a lower signal-to-noise ratio, 2.5 ≲ SNR ≲ 3.5. These have also been plotted with their respective errorbars in Fig. 8 to increase the sample size of these RHB groups in the CMD. We find that the broad progression of RHBI and RHBII towards red colour continues to hold. Our group classification based on detection in filters N242W and N279N leads to the identification of 621 stars in G1, 143 stars in G2, 247 stars in G3 (24 blue-tail stars and 223 RHBI stars), and 267 stars in G4.
3.4 GAIA colour–magnitude diagram of UVIT counterparts
We plot the hot UVIT stars in an optical CMD to distinguish their location. We use the GAIA-DR2 catalogue (Gaia Collaboration 2018) to identify and cross-match the UVIT sources. For a search radius of 1 arcsec, we find that 1267 UVIT stars have GAIA counterparts. The photometric magnitudes of these stars through the GAIA Blue-Photometer (BP: 330–680 nm) and Red-Photometer (RP: 640–1000 nm) passbands (Gaia Collaboration 2016) have been used to create a colour–magnitude diagram (BP – RP versus BP) as the wavelength overlap is minimal. The GAIA CMD is shown in Fig. 9. A gap is evident in the BP – RP colour corresponding to ∼7.5 mag. The counterparts of UVIT stars belonging to various groups, G1, G2, G3, and G4, are marked with different symbols. We notice a conspicuous trend among the UVIT groups. Most of the G1 stars are concentrated towards the blue bank of the gap and there are few that lie on the brighter side of the BP magnitude range. This is in accordance with the expectation as G1 comprises BHB as well as bright PAGB and post-early-AGB stars. G2, comprising of EHB and BHk stars, lies towards the fainter end of the blue branch. G3 and G4, which comprise RHB stars, are congregated towards the redder precincts of the CMD. G3 and G4 stars occupy distinct regions in the CMD although the transition from G3 to G4 is progressive in terms of brightness. They occupy the same range in colour: 0.8–1.2. As the overlap between the BP and RP filters is small (∼40 nm), the colour can be used as an approximate temperature proxy. The notion that the two RHB groups have similar temperature ranges corroborates well with our findings from the UVIT CMD of N245M – N279N versus N245M (Fig. 8).
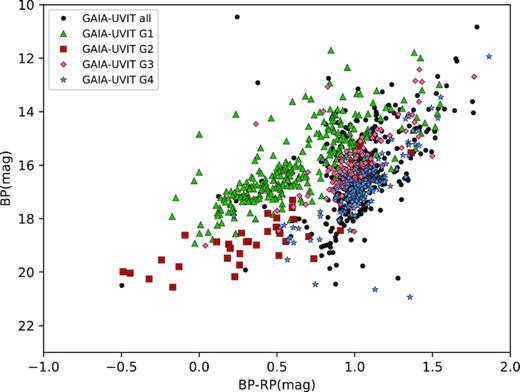
The CMD constructed using BP – RP versus BP passbands of GAIA showing stars detected with UVIT. The stars identified as G1, G2, G3, and G4 represent different groups of stars identified from Fig. 7. The black filled circles represent the other stars detected with UVIT.
3.5 Radial density distribution of UVIT cluster members
Having discerned the hot cluster members based on their location in the CMDs, we proceed towards inspecting the relative distributions of various stellar groups across the cluster. In order to accomplish this, we ascertain the radial distance of each star from the cluster centre, taken as (α, δ)J2000 = 9h12m03|${^{\rm s}_{.}}$|10, −64°51′48|${^{\prime\prime}_{.}}$|6 and estimate the surface density of stars in annular regions about the centre. The histogram displaying the radial surface density distribution of all stars in the cluster is shown in the top panel of Fig. 10. Stars have been detected up to an outer radius of 17.16 arcmin. Since the pointing of UVIT during our observations of NGC 2808 was not centred at the cluster centre, we consider a symmetric region about the centre, which corresponds to a radius of 10.82 arcmin. We note that the tidal radius of the cluster is 15.55 arcmin (Bedin et al. 2000). The radial region within the two vertical dashed lines (corresponding to 60 arcsec and 10.82 arcmin, respectively) represents the region where the stars extracted are believed to be largely complete. We have tested the completeness of our sample by adding artificial stars of varying intensity to the images and extracted them using the methods described earlier. For instance, we find that the extraction is 100 per cent complete in N242W for stars up to the extinction-corrected magnitude of 20.2 mag from the central 60 arcsec outwards. We find that this completeness magnitude represents the brighter edge of the G4 group of stars (see Fig. 7). It is to be noted that 100 per cent completeness is achieved at fainter magnitudes in the outer regions as the cluster spatial density decreases. The radial profile plot of G4 is therefore for a sample that is incomplete in the inner regions.
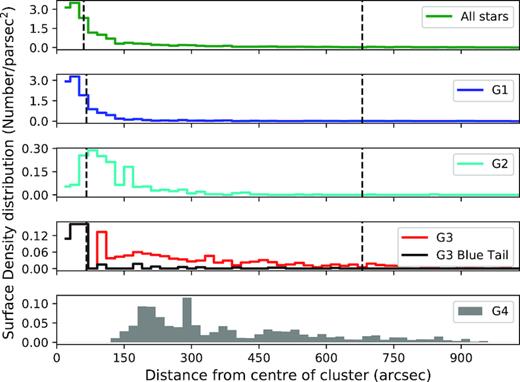
Histogram representing the radial distribution of the stellar surface density in steps of 20 arcsec. The regions in the top panel window display the surface density distribution of all the stars that are detected through UVIT. The other panels represent the distribution of stars belonging to G1, G2, G3, and G4, respectively. In the window displaying G3, red indicates all the G3 stars while the black line outlines the distribution of stars that belong to G3 but are also observed in FUV filters. The distribution plot of the detected G4 stars is shown in grey as the sample is incomplete towards the central regions.
The surface radial density distributions of the total number of stars as well as various groups of stars are displayed in Fig. 10. The radial density distribution of the total number of stars is seen to decline with distance from the cluster centre. We observe that G1 or the number of PAGB as well as BHB stars falls off with radial distance monotonically. The stars belonging to the G2 category, i.e. EHB and BHk, display a flattened distribution till ∼100 arcsec and the number declines thereafter. This is in contrast to the radial distributions of G3 and G4 that appear to be nearly uniformly distributed across the cluster. G3 comprises RHBI stars as well as blue-tail stars, while G4 consists of RHBII stars. We observe that in G3, the blue-tail stars group close to the centre. Both RHBI and RHBII stars are found to extend to outer radial regions till the cluster tidal radius.
4 DISCUSSION
Gaps and jumps have been demonstrated to be ubiquitous features in the CMDs and colour-index diagrams (CIDs) of HB populations in globular clusters. These are believed to be intricately linked to inherent processes in stellar interiors and atmospheres (Brown et al. 2016). We have observed this cluster anew in the near- and far-ultraviolet space using UVIT filters spanning across the wavelength range 130–300 nm.
4.1 Bimodality in the NUV magnitude distribution
We observe a bimodality in the magnitude distributions of stars detected in most of the NUV filters. We investigate the nature of the bimodality observed in different filters based on our classification of the cluster members into distinct groups. It is to be noted that the group classification is applicable to the sub-population (|${\sim }60{{\ \rm per\ cent}}$|) that has been detected in both the filters N242W and N279N. Fig. 4 displays the contributions of G1 (BHB and PAGB), G2 (EHB and BHk), G3 (RHBI and blue tail), and G4 (RHBII) populations to the total number of stars in the magnitude distribution. For all the NUV filters, we find that the BHB or G1 stars always lie on the brighter end of the magnitude range whereas the RHB stars from G4 and G3 constitute the red edge of the histograms.
We perceive that the contributions of various group of stars giving rise to bimodality are different in the UV wavebands (filters) under consideration. In the broad-band N242W filter, the bimodality essentially arises due to differences in luminosities of RHBI and RHBII, leading to a gap that defines the bimodality. The blue-tail population of G3 has an overlap with the G2 population. The luminosities of EHB and BHk stars (G2 population) are intermediate to those of the RHB and BHB stars. The latter constitute the brighter extremity of the primary peak. In N245M and N263M, we notice that the bimodality appears to be due to the contrast in luminosities between the RHB and hot HB populations. In N279N, the narrow primary peak is composed of hot BHB stars (i.e. G1) while the broad secondary peak has contributions from the remaining populations. Another striking feature is the shift of the magnitude distribution of G2 stars from the N219M to N279N filters. The median of the G2 magnitude distribution becomes fainter (by ∼0.8 mag) from the N219M to N279N filters, i.e. as wavelength increases. Considering that they represent the hottest HB populations, this is in accordance with the expectation. The RHB group of stars are barely detected in N219M filter. This particular waveband effectively probes the shortest of the NUV wavelengths. Hence, we attribute the relative lack of detection of RHB stars to their lower photospheric temperatures.
The magnitude corresponding to the minimum between the peaks of the bimodal distribution also shifts with wavelength: 19.8 mag in N245M, 19.1 mag in N263M, and 18.3 mag in N279N. In other words, the specific flux density establishing the bimodality becomes larger with increasing wavelength. As the flux contribution by specific groups to a given filter is a reflection of the underlying stellar atmospheric processes, detailed stellar evolution modelling is vital for understanding the nature of the bimodality and the specific flux density defining the bimodality. The evolution of bimodality with wavelength observed for NGC 2808 demonstrates the power of UVIT’s multiple filters to advance our understanding of stellar atmospheric processes of the RHB group.
4.2 Gaps in UVIT CMDs
The UV magnitude distributions also manifest as gaps and accumulations of stars in specific regions of CMDs. In the F154W–N279N CMD, the gap that separates the BHB from the EHB and BHk stars can be attributed to the bimodality in the magnitude distribution of the N279N filter. This specific FUV–NUV CMD can be compared to that constructed by Brown et al. (2001) for the same cluster using filters similar to the ones used in this work: the HST STIS FUV/F25QTZ and NUV/F25CN270 filters for the same cluster. It is to be noted that a direct comparison of CMDs is difficult in the absence of colour equations connecting the two photometric systems with different filter characteristics. Consequently, the gap separating the BHB stars from the EHB and BHks stars is perceived at different values of colour and magnitude.
The BHB population provides a tighter clustering, unlike the EHB and BHk populations of stars (see Fig. 7). We note that the blue-tail stars appear to belong to the group of EHBs and lie close to the gap. However, they are different from EHBs and BHks, as is evident from the N242W–N279N CMD. In addition, we observe from the FUV–NUV CMD that there are a group of objects located in the region where the zero-age main sequence track is expected. These are encircled in Fig. 5 and we suspect them to be BS candidates. These stars are expected to lie at the fainter end of the extension of zero-age HB loci, as demonstrated by Brown et al. (2001).
The gap separating the BHBs from the EHBs is the M-jump (Momany et al. 2004), corresponding to T ∼ 20 000 K. This gap is prevalent in numerous globular clusters (Brown et al. 2016). This M-jump appears between G1 and G2 stars in the N245M–N279N CMD (Fig. 6). This CMD shows a broad starless gap separating the BHBs (G1) from other groups of stars that include EHBs, BHks, and RHBs. The progression from RHBs (G3 and G4) to G2 is gradual and a tentative paucity of stars is seen between the RHB group and G2. The same M-jump that separates BHBs from EHBs and BHks also extends further and segregates the BHBs and RHBs. This would suggest a similar underlying mechanism for separation between both groups. Thus, the UV CMDs enable us to analyse the gaps as a common feature unlike the optical and UV–optical CMDs (Ferraro et al. 1998) and CIDs, which divulge the gaps as discrete, i.e. in distinct locations.
The two RHB groups of stars are set apart by a marginal gap (described by equation 5) in the N242W–N279N CMD. This gap is not apparent in the CID of this cluster described by Brown et al. (2016). It is likely that this is analogous to the two RHB groups observed in other metal-rich globular clusters such as NGC 6637, NGC 6352, and NGC 5927. While there is a large body of work on the extended HB morphology of NGC 2808, we could not find any work that substantiates the presence of two RHB groups of stars in this cluster. There is, however, the tantalizing spectroscopic evidence provided by Marino et al. (2014) based on Na abundances of 96 HB stars that indicated that there could be two groups of RHB stars. Based on the Na content, they observed a bimodality that is not consistent with a single RHB population. They also observed a gradient in colours of these RHB stars but the uncertainties did not allow the confirmation about the nature of star-formation histories. With our N242W–N279N diagram, we distinctly perceive two groups of RHB stars. It is difficult to gauge their temperatures as the progression is gradual and both groups occupy similar temperature ranges evident from the CMDs of N245M–N279W and BP – RP. It is likely that this is responsible for the lack of a distinct bimodality in the Na abundance. We also observe that the G3 stars are brighter compared to the G4 stars. Thus, our photometric method enables the segregation of 490 RHB stars into the two groups.
4.3 Multiple UV populations in view of evolutionary scenarios
We next speculate on the origin of the RHB groups of stars. The distinct RHB groups in UV CMDs appear to point towards distinct star formation histories. The main sequence of this GC is comprised of quintuplet stellar populations, labelled A, B, C, D, and E by Milone et al. (2015). The mid-blue and extreme-blue MS (D and E, respectively), associated with higher helium enrichments, are believed to give rise to the BHB and EHB stars. The red MS (rMS) comprises three branches (A, B, and C) and we anticipate that the two RHB groups are plausibly related to the rMS branches discerned. The rMS branches are likely to have evolved to distinct RHB populations. However, which rMS groups and/or their combinations are responsible for the RHBI and RHBII is not known with the information available and detailed investigation is required to ascertain this.
In case of NGC 2808, different stellar populations show distinct spatial distributions. While the hotter G1 and G2 are concentrated in the core, the cooler RHB stars (G3 and G4) have a distribution extending outwards. Earlier studies investigating the radial distribution of HB stars (Bedin et al. 2000; Iannicola et al. 2009) did not find any significant radial trend from the centre to outward regions. However at the 1.5σ level, Iannicola et al. (2009) did find a trend, i.e. a deficiency in RHB stars towards the centre (radius ≲ 35 arcsec). An alternate study by Simioni et al. (2016) compares the radial distributions of the multiple populations of MS stars (i.e. A, B, C, D, E). These authors find that the D and E stars are concentrated towards the centre while the A + B + C stars extend outwards with a progressive scarcity towards the central region (they investigated annular regions between 45 arcsec and 9 arcmin). As the D and E are believed to be the precursors of a G1 and G2 helium-enhanced second generation of stars, these results are in agreement with our observations. This is because according to multiple population formation models (D’Antona & Caloi 2008), the intermediate and blue MS would give rise to BHB and EHB stars. The scarcity of A + B + C stars towards the centre observed by Simioni et al. (2016) is difficult to directly corroborate with the spatial distribution of RHB stars from this work. However, the fact these groups of stars are extended to a large radial distance suggests that the RHB groups of stars could represent the evolved populations of the rMS.
The spatial distribution of cluster members from this study can be used to comment on the evolutionary scenarios proposed for the formation of multiple populations. We consider the AGB ejecta scenario where the formation of multiple generations of stars in globular clusters has been investigated through simulations (D’Antona & Caloi 2008; D’Ercole et al. 2008). In this framework, the gas near the centre is cleared by the supernova explosions of first-generation stars. A cooling flow develops, as a result of which the CNO-processed winds from massive AGBs are retained by the cluster potential as they are slow. This provides the gas necessary for the formation of second-generation stars. The first-generation stars, associated with the RHB, have a normal helium abundance while the later generation BHB, EHB, and BHk stars have enhanced helium abundances as they are formed from processed gas. Thus, it is expected that the later generation stars would be concentrated within the inner core of a more extended first-generation population.
More recently, D’Antona et al. (2016) have attempted to explain the five generations of stars using the same model. In addition to AGB ejecta, they also invoke the accretion of pristine gas to explain the multiple populations. They arrive at the BEDCA scenario for the main sequences A, B, C, D, and E. According to this scenario, the rMS type B corresponds to the first generation, while the C and A types of rMS correspond to the last generation. The mid- and extreme-blue MSs (D and E) correspond to the stars of the second and third generations, respectively. From our spatial distribution, we find that the hot HB population (G1 and G2) is abundant near the centre, which is consistent with the premise that it is related to the D and E types. The G1 population that corresponds to the MS type D is more centrally concentrated than G2, associated with EHBs and BHks (MS type E). The normalized spatial density distribution is shown in Fig. 11 for comparison. This is in excellent agreement with the suggestion that G1 stars that are more centrally concentrated formed later than G2 with a broader distribution.
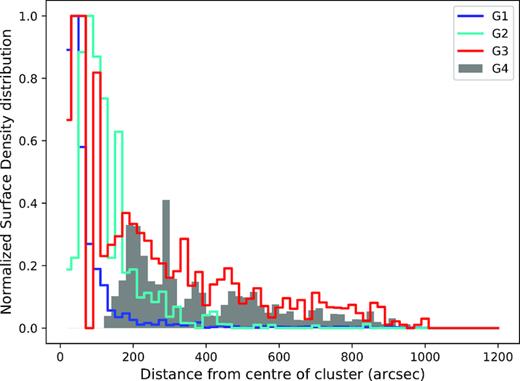
Histograms of the radial stellar surface density, normalized at the value corresponding to a radial bin of 60 arcsec for G1, G2, and G3. The distribution of G4 is normalized at the value of G3 corresponding to a radial distance of 200 arcsec.
The spatial distribution of the RHB classes are similar and show broad radial distributions compared to G1 and G2. If the RHB groups of stars correspond to evolution associated with the A and/or C rMS, then it is expected that a few of these stars would be more concentrated towards the centre than G1 and G2, rather than distributed in the outer radial regions. It is possible that G3 RHBI stars are related to the B rMS. Whether G4 type RHBII stars are associated with the earliest B rMS or later AC rMS is difficult to authenticate due to a lack of detected stars near the central region. The spatial densities of RHBI and RHBII stars in the outer radial regions are higher compared to those of G1 and G2 stars. If the rMS stars are believed to be the precursors to the RHB stars (as suggested from the similar spatial distributions of the rMS and RHB stars), then it would appear that all groups of rMS stars formed within short time intervals of each other, unlike what has been proposed in the BEDCA model. With the current RHB identification, it should be possible to carry out detailed spectroscopic studies and ascertain abundances that will shed light on the formation scenario in greater detail.
5 CONCLUSIONS
The photometric results for the Galactic globular cluster NGC 2808 from an ultraviolet study using multiple filters of UVIT show that the cluster is an abode to an exotic stellar population that includes EHB and BHk stars apart from the classic HB stars (BHB and RHB). We have identified for the first time the split in the RHB population photometrically. This is another piece of supporting evidence for the multiple stellar populations that reside in the GC. Based on CMDs constructed using multiple FUV and NUV filters, we conclude the following.
There is a bimodal distribution of stars on the FUV–NUV CMD, which divides the group of stars into BHB and hot blue stars such as EHB and BHk stars.
A third group of stars is also seen in the N245M–N279N CMD, which comprises relatively cooler RHB stars.
In the N242W–N279N CMD, the RHB of the cluster segregates into two subgroups (RHBI and RHBII).
Based on the gaps seen in the N242W–N279N CMD, we have divided the stars into four groups: G1 is the BHB and PAGB stars; G2 comprises the EHB and BHk stars; G3 has a mixed population of blue-tail stars and RHBI stars; and G4 consists of cool RHBII stars.
The presence of stellar groups that may belong to various generations of stellar populations is backed by the spatial extent of various group of stars and conforms broadly with the suggested evolutionary scenarios. The hotter stars are concentrated towards the centre of the cluster, while the cool stars are spread uniformly across the field of view away from the cluster centre. There is a need to understand the formation as well as spatial distribution of the RHB groups of stars in the cluster as it does not comply with the current AGB ejecta models of formation of RHBs. This study provides new information and insights regarding NGC 2808, which can be useful to understand the genesis of globular clusters.
ACKNOWLEDGEMENTS
We thank the referee for providing useful comments that have helped in the improvement of the paper. This publication uses data from the AstroSat mission of the Indian Space Research Organisation (ISRO), archived at the Indian Space Science Data Centre (ISSDC).


