


ABSTRACT
Stark widths and shifts of Mn ii lines with wavelengths in the range 2300–3500 Å have been measured by laser-induced breakdown spectroscopy. The use of fused glass samples with varying Mn concentrations has allowed minimization of the error due to self-absorption in the Stark width measurements, which has made it possible to include resonance lines in the study. The laser-induced plasmas are characterized along their temporal evolution, showing electron densities in the range (0.60–6.75) × 1017 cm−3 and temperatures in the range 11 000–13 900 K. The results are compared with experimental and theoretical values available in the literature.
1 INTRODUCTION
Stark broadening and shift parameters are of interest for the analysis of astrophysical data, the diagnostics of laboratory plasmas, and the validation of atomic structure theories. In the case of ionised manganese, these data are essential for the analysis and modelling of Hg–Mn star atmospheres, where Stark broadening is the main pressure-broadening mechanism (Popović et al. 2008). Despite their importance, there is a lack of data for Mn ii Stark widths and shifts.
Calculations were performed by Popović & Dimitrijević (1997) for 16 Mn ii multiplets with a modified semi-empirical approach. The first experimental measurements were reported by Djeniže et al (2006) for 11 spectral lines using a low-pressure arc as the plasma source at 49 000 K. The results showed Stark width values of the resonance lines much higher than the aforementioned calculations. Bredice et al. (2007) measured the same lines using a laser-induced plasma and obtained similar results although their plasma temperature was only 10 000 K. In 2008, Popović et al. recalculated the Stark widths and shifts performing more sophisticated calculations for the intense lines of the multiplets a7S–z7Po and a5S–z5Po by means of the semiclassical perturbation theory. This work achieved a better agreement with the former experiment but large differences were still present for some of the lines. In fact, they conclude that new measurements are needed to explain large discrepancies existing between experimental and theoretical values.
The aim of this work is to provide accurate experimental Stark widths and shifts of Mn ii spectral lines. In previous works our group has measured these parameters by laser-induced breakdown spectroscopy (LIBS) using a methodology that allows controlling the self-absorption of the lines, based on the selection of the concentration in the sample (Aragón & Aguilera 2014). In this work, we take advantage of this methodology to report Stark parameters of Mn ii spectral lines for weak and strong lines, including resonance lines, with wavelengths in the range 2300–3500 Å.
2 EXPERIMENT
To generate the laser-induced plasmas, a Nd: YAG laser (wavelength 1064 nm, pulse energy 60 mJ, pulse width 4.5 ns) is focused on to the sample surface by a lens of 126-mm focal length. The lens-to-sample distance is 122 mm. A system of flat and concave mirrors forms an image of the plasma emission with magnification m = 1 on to the entrance slit of a Czerny–Turner spectrometer (focal length 0.75 m, grating 3600 lines mm−1). The detector is an intensified charge-coupled device having 1200 × 256 effective pixels. For a slit width of 20 |$\mu$|m in the spectrometer entrance, the instrumental width at 3000 Å is 15 pm. The spectral efficiency of the system is measured using radiance-calibrated tungsten and deuterium lamps. The spectra result from the accumulation of the emission from 100 laser shots, while the sample rotates at 100 rpm.
The samples are fused glass discs prepared from pure MnO in powder form. As discussed later, we have selected the Mn concentration in the samples to minimize self-absorption. Six fused glass samples with Mn concentrations between 0.01 atomic per cent and 0.5 atomic per cent have been prepared for the experiment.
3 RESULTS AND DISCUSSION
To determine the Stark widths and shifts, we have measured spectra of the emission from the laser-induced plasma at six time windows. The time delay from the laser pulse has varied from 0.57 to 3.1 |$\mu$|s, the corresponding time widths ranging from 0.06 to 0.6 |$\mu$|s. The average time finally assigned to each time window varies from 0.6 to 3.4 |$\mu$|s. Fig. 1 shows typical line profiles obtained at the different time windows. Note that the wavelength scale is the same in both plots. As can be seen, the profile of the Mn ii line at 2575.104 Å (Fig. 1a) shows lower broadening and shift compared to that of the line at 3488.675 Å (Fig. 1b). To determine the Lorentzian widths and the shifts, the line profiles are fitted to Voigt profiles in which the Gaussian component includes the instrumental and Doppler profiles. An additional spectrum measured with an average time of 10 |$\mu$|s is used as a reference to obtain the shifts. The electron density of the plasma at each time window is determined from the Stark broadening of the H α line, whose emission comes from the water vapour content of the ambient air (Aragón & Aguilera 2010). The tables reported by Gigosos & Cardeñoso (1996) for plasma diagnostics using the Lyman and Balmer hydrogen lines are used to determine the electron density from the line width of the H α line. The resulting electron density decreases from 6.75 × 1017 cm−3 at 0.6 |$\mu$|s to 0.60 × 1017 cm−3 at 3.4 |$\mu$|s. The error of the electron density is estimated as 11 per cent. The plasma temperature is measured using Boltzmann plots constructed from seven Mn ii lines having a range of upper level energies around 2.9 eV. The temperature decreases from 13 900 ± 700 K at 0.6 |$\mu$|s to 11 000 ± 100 K at 3.4 |$\mu$|s.
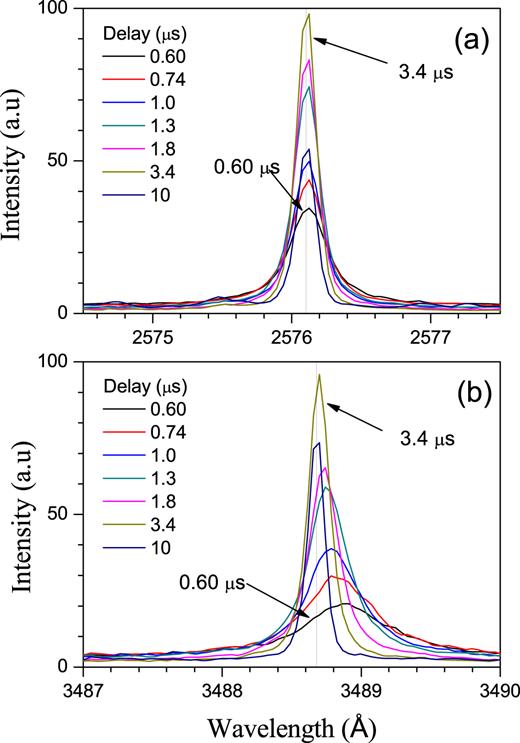
Spectra of the Mn ii lines at 2576.104 Å (a) and 3488.677 Å (b), measured at different time windows.
We have taken special care to minimize self-absorption of the line profiles, which is one of the main causes of error in Stark width measurements, especially for intense lines. The use of the methodology based on CSigma graphs (Aragón & Aguilera 2010) has allowed us to estimate the Mn concentration required for each line to maintain the error in line width due to self-absorption below 10 per cent. Moreover, for three lines, we have performed a direct check of self-absorption by measuring the Lorentzian width obtained for six samples of increasing Mn concentration. The results are shown in Fig. 2 for the intense Mn ii line at 2576.104 Å. In this figure, the ratio of the Lorentzian width w to the electron density Ne is plotted as a function of the Mn concentration for the different time windows. The increase of w/Ne for increasing concentration reflects the distortion of the line profile due to self-absorption. As can be seen, the effect is more pronounced for increasing delay. The convergence of all the curves at low concentration evidences that the error has been strongly reduced. In Fig. 3, plots of w/Ne versus concentration at 1.0 |$\mu$|s are shown for three lines of different intensities. As expected, the increase of w/Ne with concentration is stronger for the more intense line at 2576.104 Å, whose Stark width was therefore measured with the sample having the smaller concentration of 0.01 atomic per cent. Opposite, for the line at 2610.202 Å, the increase of w/Ne takes place smoothly at concentrations above 0.2 atomic per cent. For this weak line, the sample with concentration 0.2 atomic per cent has been used.
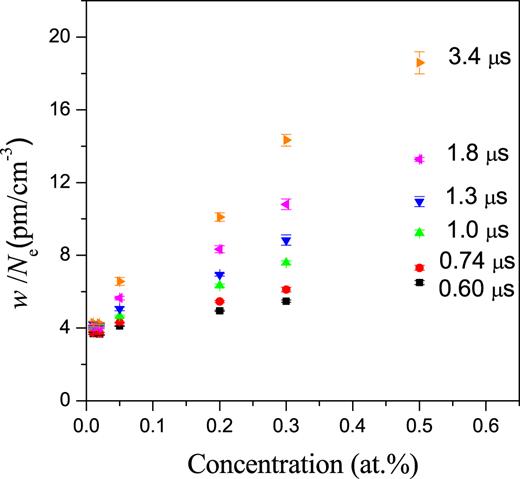
Ratio of the Lorentzian width to the electron density at different time windows for the Mn ii line at 2576.104 Å, as a function of the Mn concentration in the sample.
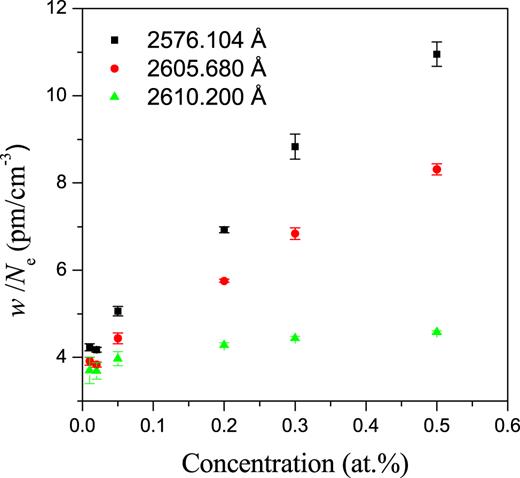
Ratio of the Lorentzian width to the electron density at 1.0 |$\mu$|s for three Mn ii lines having different intensities, as a function of the Mn concentration in the sample.
The Lorentzian line width w and the shift d determined from the spectra of Fig. 1 are plotted in Figs 4 and 5 as a function of the electron density obtained for each time window. As was observed by inspection of the spectra, the two parameters are very different for the two lines shown as examples. In all cases, linear plots passing through the origin have been obtained, which reveal that we have not observed the weak dependence of w and d on temperature within our experimental error. Thus, we have determined the final values for the Stark width and shift as the slopes of the linear fittings of these plots with zero intercept. The results for Stark widths and shifts of Mn ii spectral lines are reported in Tables 1 and 2, respectively, together with previous data from the literature, existing only for four multiplets. To allow fast tracking of the lines, Tables 3 and 4 ordered by wavelength have been included and added in ASCII code as online supporting information.
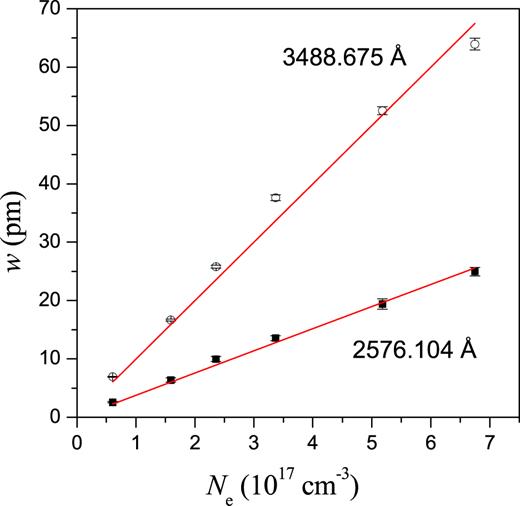
Line width versus electron density for two Mn ii lines. The Stark widths are determined as the slopes of the linear plots with zero intercept.
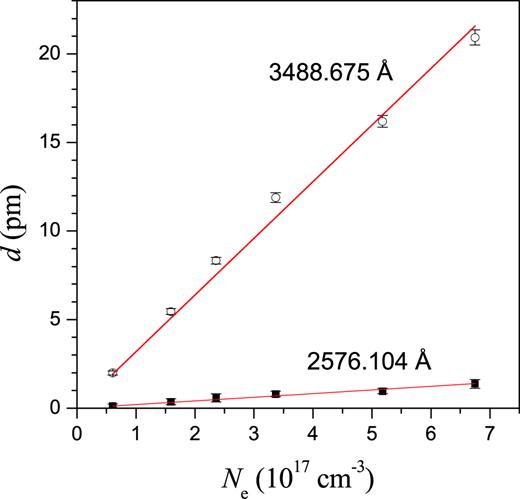
Line shift versus electron density for two Mn ii lines. The Stark shifts are determined as the slopes of the linear plots with zero intercept.
Stark widths (full width at half-maximum, FWHM) w (pm) of Mn ii spectral lines at electron density 1017 cm−3 and for a temperature range of 11 000–13 900 K. The available data in the literature are shown for comparison. The estimated relative error of w is 15 per cent.
| Experimental | Theoretical | ||||||||
|---|---|---|---|---|---|---|---|---|---|
| No | Transitiona | Multipleta | λ (Å) a | w | wb | wc | wd | w´d | we |
| 1 | 3d5(6S)4s–3d5(6S)4p | a7S–z7Po | 2576.104 | 3.8 | 9.37 | 10.1 | 5.91 | ||
| 2593.721 | 4.0 | 16.0 | 14.0 | 9.48 | 10.2 | 5.91 | |||
| 2605.680 | 3.7 | 18.0 | 14.8 | 9.67 | 10.3 | 5.91 | |||
| 2 | a5S–z5Po | 2949.205 | 6.3 | 15.0 | 16.0 | 16.5 | 13.0 | 8.51 | |
| 2939.308 | 6.3 | 15.0 | 12.2 | 13.6 | 12.9 | 8.51 | |||
| 2933.054 | 6.1 | 13.0 | 16.3 | 13.6 | 12.9 | 8.51 | |||
| 3 | 3d6–3d5(6S)4p | a5D–z5Po | 3495.833 | 11.3 | |||||
| 3482.904 | 11.8 | 13 | 20.0 | ||||||
| 3488.675 | 11.0 | ||||||||
| 4 | 3d5(4 G)4s–3d5(4 G)4p | a5G–z5Go | 2705.732 | 5.6 | |||||
| 2708.452 | 4.8 | ||||||||
| 2707.544 | 4.4 | ||||||||
| 5 | a5G–z5Ho | 2610.200 | 4.0 | 13 | 8.0 | ||||
| 2618.148 | 4.7 | 9.2 | |||||||
| 2625.606 | 4.7 | ||||||||
| 6 | a5G–z5Fo | 2563.642 | 4.7 | ||||||
| 2565.219 | 3.6 | ||||||||
| 7 | 3d5(4P)4s–3d5(4 G)4p | a5P–z5Fo | 2716.796 | 4.7 | |||||
| 8 | 3d5(4P)4s–3d5(4P)4p | a5P–z5Do | 2672.581 | 4.5 | |||||
| 2724.465 | 5.0 | ||||||||
| 9 | a5P–z5So | 2698.989 | 5.4 | ||||||
| 10 | 3d5(4P)4s–3d5(4D)4p | a5P–y5Do | 2373.357 | 3.5 | |||||
| 11 | 3d6–3d5(4 G)4p | a3H–z3Go | 2507.598 | 6.8 | |||||
| 12 | a3F–z3Fo | 2750.126 | 6.4 | ||||||
| 13 | 3d5(4D)4s–3d5(4P)4p | b5D–z5Do | 2897.068 | 5.7 | |||||
| 14 | b5D-y5Po | 2816.329 | 5.8 | ||||||
| 15 | 3d5(4D)4s–3d5(4D)4p | b5D–y5Fo | 2639.849 | 4.4 | |||||
| 2677.851 | 4.5 | ||||||||
| 16 | b5D–y5Do | 2532.781 | 4.3 | ||||||
| 17 | 3d5(4 G)4s–3d5(4 G)4p | a3G–z3Ho | 2886.671 | 6.3 | |||||
| 18 | a3G–z3Fo | 2892.389 | 6.1 | ||||||
| 19 | a3G–z3Go | 2684.539 | 5.5 | ||||||
| 20 | 3d6–3d5(4 G)4p | b3G–z3Go | 2815.025 | 6.9 | |||||
| 21 | 3d5(4P)4s–3d5(4P)4p | b3P–z3Po | 3050.654 | 6.6 | |||||
| 22 | b3P–z3Do | 2900.154 | 5.9 | ||||||
| 2891.332 | 5.8 | ||||||||
| 2885.131 | 7.0 | ||||||||
| 23 | 3d6–3d5(2I)4p | a1I–z1Io | 2320.420 | 5.7 | |||||
| 24 | 3d5(2I)4s–3d5(2I)4p | b1I–z1Ko | 2870.085 | 6.9 | |||||
| 25 | 3d5(2F)4s–3d5(a 2D)4p | b3F–z1Fo | 2740.786 | 5.3 | |||||
| 26 | 3d5(2 G)4s–3d5(a 2 G)4p | c3G–x3Ho | 2846.036 | 5.4 | |||||
aData from Kramida et al. (2018).
bBredice et al. (2007). Data reported for a temperature of 10 000 K.
cDjeniže et al. (2006). Data reported for a temperature of 49 000 K.
dPopović et al (2008). The w value is calculated including contributions from allowed and forbidden transitions; the w´value is calculated including only dipole allowed transitions. Data reported for a temperature of 10 000 K.
ePopović & Dimitrijević (1997). Data reported for a temperature of 10 000 K.
Stark shifts d (pm) of Mn ii spectral lines at electron density 1017 cm−3 and for a temperature range of 11 000–13 900 K. The available data in the literature are shown for comparison. The estimated relative error of d is 11 per cent.
| Experimental | Theoretical | |||||||
|---|---|---|---|---|---|---|---|---|
| No | Transitiona | Multipleta | λ (Å) a | d | db | dc | d´c | dd |
| 1 | 3d5(6S)4s–3d5(6S)4p | a7S–z7Po | 2576.104 | 0.21 | −0.0401 | −0.0669 | −1.30 | |
| 2593.721 | 0.24 | −0.62 | −0.0996 | −0.0756 | −1.30 | |||
| 2605.680 | 0.33 | −0.92 | −0.631 | −0.0816 | −1.30 | |||
| 2 | a5S–z5Po | 2939.308 | < 0.1 | −1.5 | −0.174 | −0.244 | −1.79 | |
| 3 | 3d6–3d5(6S)4p | a5D–z5Po | 3495.833 | 3.6 | ||||
| 3482.904 | 3.5 | |||||||
| 3488.675 | 3.5 | |||||||
| 4 | 3d5(4 G)4s–3d5(4 G)4p | a5G–z5Go | 2705.732 | < 0.1 | ||||
| 2708.452 | < 0.1 | |||||||
| 5 | a5G–z5Ho | 2610.200 | 0.37 | −0.62 | ||||
| 2618.148 | 0.24 | |||||||
| 2625.606 | 0.14 | |||||||
| 6 | a5G–z5Fo | 2563.642 | 0.10 | |||||
| 2565.219 | < 0.1 | |||||||
| 7 | 3d5(4P)4s–3d5(4 G)4p | a5P–z5Fo | 2716.796 | < 0.1 | ||||
| 8 | 3d5(4P)4s–3d5(4P)4p | a5P–z5Do | 2672.581 | < 0.1 | ||||
| 2724.465 | −0.3 | |||||||
| 9 | 3d5(4P)4s–3d5(4D)4p | a5P –y5Do | 2373.357 | 0.4 | ||||
| 10 | 3d6–3d5(4 G)4p | a3H–z3Go | 2507.598 | 2.7 | ||||
| 11 | a3F–z3Fo | 2750.126 | 1.8 | |||||
| 12 | 3d5(4D)4s –3d5(4D)4p | b5D–y5Fo | 2639.849 | 0.2 | ||||
| 13 | 3d5(4 G)4s–3d5(4 G)4p | a3G–z3Ho | 2886.671 | 0.9 | ||||
| 14 | a3G–z3Fo | 2892.389 | 0.9 | |||||
| 15 | a3G–z3Go | 2684.539 | 0.9 | |||||
| 16 | 3d6–3d5(4 G)4p | b3G–z3Go | 2815.025 | 1.8 | ||||
| 17 | 3d5(4P)4s–3d5(4P)4p | b3P–z3Po | 3050.654 | −0.3 | ||||
| 18 | b3P–z3Do | 2900.154 | 0.1 | |||||
| 2891.332 | 0.4 | |||||||
| 19 | 3d6–3d5(2I)4p | a1I–z1Io | 2320.420 | 1.9 | ||||
| 20 | 3d5(2I)4s–3d5(2I)4p | b1I–z1Ko | 2870.085 | < 0.1 | ||||
aData from Kramida et al. (2018).
bDjeniže et al. (2006). Data reported for a temperature of 49 000 K.
cPopović et al (2008). The d value is calculated including contributions from allowed and forbidden transitions; the d´ value is calculated including only dipole allowed transitions. Data reported for a temperature of 10 000 K.
dPopović & Dimitrijević (1997). Data reported for a temperature of 10 000 K.
List of lines for which the Stark width is measured, ordered by wavelength, and their multiplet number for faster location in Table 1.
| λ (Å) | No |
|---|---|
| 2320.420 | 23 |
| 2373.357 | 10 |
| 2507.598 | 11 |
| 2532.781 | 16 |
| 2563.642 | 6 |
| 2565.219 | 6 |
| 2576.104 | 1 |
| 2593.721 | 1 |
| 2605.680 | 1 |
| 2610.200 | 5 |
| 2618.148 | 5 |
| 2625.606 | 5 |
| 2639.849 | 15 |
| 2672.581 | 8 |
| 2677.851 | 15 |
| 2684.539 | 19 |
| 2698.989 | 9 |
| 2705.732 | 4 |
| 2707.544 | 4 |
| 2708.452 | 4 |
| 2716.796 | 7 |
| 2724.465 | 8 |
| 2740.786 | 25 |
| 2750.126 | 12 |
| 2815.025 | 20 |
| 2816.329 | 14 |
| 2846.036 | 26 |
| 2870.085 | 24 |
| 2885.131 | 22 |
| 2886.671 | 17 |
| 2891.332 | 22 |
| 2892.389 | 18 |
| 2897.068 | 13 |
| 2900.154 | 22 |
| 2933.054 | 2 |
| 2939.308 | 2 |
| 2949.205 | 2 |
| 3050.654 | 21 |
| 3482.904 | 3 |
| 3488.675 | 3 |
| 3495.833 | 3 |
List of lines for which the Stark shift is measured, ordered by wavelength, and their multiplet number for faster location in Table 2.
| λ (Å) | No |
|---|---|
| 2320.420 | 19 |
| 2373.357 | 9 |
| 2507.598 | 10 |
| 2563.642 | 6 |
| 2565.219 | 6 |
| 2576.104 | 1 |
| 2593.721 | 1 |
| 2605.680 | 1 |
| 2610.200 | 5 |
| 2618.148 | 5 |
| 2625.606 | 5 |
| 2639.849 | 12 |
| 2672.581 | 8 |
| 2684.539 | 15 |
| 2705.732 | 4 |
| 2708.452 | 4 |
| 2716.796 | 7 |
| 2724.465 | 8 |
| 2750.126 | 11 |
| 2815.025 | 16 |
| 2870.085 | 20 |
| 2886.671 | 13 |
| 2891.332 | 18 |
| 2892.389 | 14 |
| 2900.154 | 18 |
| 2939.308 | 2 |
| 3050.654 | 17 |
| 3482.904 | 3 |
| 3488.675 | 3 |
| 3495.833 | 3 |
We have estimated the total experimental error as 15 per cent and 11 per cent for the Stark width and shift values, respectively. It has been obtained as a result of adding quadratically the uncertainty due to the plasma inhomogeneity (3 per cent), the electron density measurement (11 per cent), and the self-absorption of the plasma (10 per cent only for width measurements). In any case, the minimum absolute error for shift measurements is 0.1 pm taking into consideration the wavelength resolution. For some lines, the shift is very small, so it is reported as an upper limit. The reason is that, although the linear dependence between shift and electron density is clear, the error is limited by the wavelength resolution.
Comparison of our results with previous data shows that our width values are around 35 per cent lower than the calculations performed by Popović & Dimitrijević (1997) using a modified semiempirical theory, and considerably lower, up to a factor 2.5, than the results obtained more recently by Popović et al. (2008) using a new semiclassical perturbation approach. A similar behaviour is noticed with experimental data, where our measurements are lower by a factor 2.5 for the a5S–z5P multiplet and even a factor 4 for the a7S–z7P multiplet. It is worth highlighting the importance and experimental difficulty of measuring these resonant lines, which experience very strong self-absorption. The disagreement for the a5G–z5H multiplet is around a factor 2 and 3 for the measurements by Djeniže et al. (2006) and Bredice et al. (2007), respectively. Finally, for the line at 3482.904 Å, with the lowest absorption coefficient of the aforementioned lines, the agreement is better, having width values 9 per cent and 40 per cent lower than the measurements of Bredice et al. (2007) and Djenize et al. (2006), respectively. Our Stark shifts have the opposite sign to previous experimental and theoretical data, which show large discrepancies in values.
4 CONCLUSIONS
We report experimental Stark widths and shifts for Mn ii lines. Widths are obtained for 41 lines, 33 of them measured for the first time, while shifts are given for 30 lines, 26 corresponding to first measurements. The use of fused glass sample preparation, combined with self-absorption control by the CSigma graph methodology, has allowed us to include intense as well as weak lines belonging to 26 multiplets in the experiment. Our width data show satisfactory agreement with previous calculations based on modified semi-empirical theory, but are much lower than previous experimental data, only available for intense Mn ii lines. The difficulty of controlling self-absorption for the narrow and intense Mn ii lines is pointed out as the possible reason for disagreement with the previous measurements.
SUPPORTING INFORMATION
Table S5. List of measured Stark widths, ordered by wavelength (ASCII).
Table S6. List of measured Stark shifts, ordered by wavelength (ASCII).
Please note: Oxford University Press is not responsible for the content or functionality of any supporting materials supplied by the authors. Any queries (other than missing material) should be directed to the corresponding author for the article.
ACKNOWLEDGEMENTS
This work has been supported by project FIS2014–54285-P of the Spanish Ministerio de Economía y Competitividad.
