-
PDF
- Split View
-
Views
-
Cite
Cite
C van Rensburg, P P Krüger, C Venter, Spatially dependent modelling of pulsar wind nebula G0.9+0.1, Monthly Notices of the Royal Astronomical Society, Volume 477, Issue 3, July 2018, Pages 3853–3868, https://doi.org/10.1093/mnras/sty826
Close - Share Icon Share
Abstract
We present results from a leptonic emission code that models the spectral energy distribution of a pulsar wind nebula by solving a Fokker–Planck-type transport equation and calculating inverse Compton and synchrotron emissivities. We have created this time-dependent, multizone model to investigate changes in the particle spectrum as they traverse the pulsar wind nebula, by considering a time and spatially dependent B-field, spatially dependent bulk particle speed implying convection and adiabatic losses, diffusion, as well as radiative losses. Our code predicts the radiation spectrum at different positions in the nebula, yielding the surface brightness versus radius and the nebular size as function of energy. We compare our new model against more basic models using the observed spectrum of pulsar wind nebula G0.9+0.1, incorporating data from H.E.S.S. as well as radio and X-ray experiments. We show that simultaneously fitting the spectral energy distribution and the energy-dependent source size leads to more stringent constraints on several model parameters.
1 INTRODUCTION
Pulsar wind nebulae (PWNe) are true multiwavelength objects, observable from the highest γ-ray energies down to the radio waveband, sometimes exhibiting complex morphologies in the different energy domains. Discoveries during the last decade by ground-based Imaging Atmospheric Cherenkov Telescopes (IACTs) have increased the number of known very high energy (VHE; E > 100 GeV) γ-ray sources to nearly 200.1 Hewitt & Lemoine-Goumard (2015) note that nearly 40 of these are confirmed PWNe. Following the 9 yr H.E.S.S. Galactic Plane Survey (HGPS; Carrigan et al. 2013), H.E.S.S. published a paper describing the properties of 19 PWNe and 10 strong PWN candidates, as well as empirical trends between several PWN/pulsar parameters (Abdalla et al. 2018). It is expected that the future Cherenkov Telescope Array (CTA), with its order-of-magnitude increase in sensitivity and improvement in angular resolution, will discover several more (older and fainter) PWNe and reveal many more morphological details. A systematic search with the Fermi Large Area Telescope (LAT) for GeV emission in the vicinity of TeV-detected sources yielded 5 high-energy γ-ray PWNe and 11 PWN candidates (Ferrara et al. 2015). In the X-ray to VHE γ-ray energy range, there are 85 PWNe or PWN candidates with 71 of them having associated pulsars (Kargaltsev, Pavlov & Durant 2012).
For slower moving pulsars, one might observe a composite supernova remnant (SNR), with nebular and shell emission visible in both radio and X-ray bands. Such young systems (having ages of a few thousand years) exhibit a high degree of spherical symmetry and it is possible that the SNR reverse shock has not yet interacted with the PWN (e.g. SNR G11.2−0.3 and G21.5−0.9). The PWN around PSR B1509−58 provides a counter example, exhibiting a strong anticorrelation between the radio and X-ray emission morphology. This system is reminiscent of older PWNe associated with fast-moving pulsars and γ-ray sources that exhibit complex morphologies (e.g. the Rabbit Nebula and G327.1−1.1; Roberts et al. 2005; Slane 2017). In even older PWNe (with ages of tens of thousands of years), a rapidly decreasing B-field may lead to γ-ray emission dominating the observed radio and X-ray emission (e.g. HESS J1825−137; Slane 2017).
High-resolution observations by Chandra X-ray Observatory have furthermore revealed complex substructures such as toroidal structures, bipolar jets, and filaments (Helfand, Gotthelf & Halpern 2001; Roberts et al. 2003). Similarly, high-resolution radio images sometimes reveal complex PWN morphology including filaments, knots, and holes (Dubner, Giacani & Decourchelle 2008). Complementary optical and infrared observations may uncover spectral features in the particle spectrum, information about the shocked supernova ejecta, and newly formed dust (Temim & Slane 2017).
PWNe (plerions) have historically been identified based on their observational properties, i.e. having a filled-centre emission morphology, a flat spectrum at radio wavelengths, and a very broad spectrum of non-thermal emission ranging from the radio band to high-energy γ-rays (e.g. Weiler & Panagia 1978; de Jager & Djannati-Ataï 2009; Amato 2014). Apart from the Galactic population of PWNe, H.E.S.S. has detected a powerful extragalactic PWN in the Large Magellanic Cloud lying at a distance of ∼50 kpc (Abramowski et al. 2012). Galactic PWNe are interesting laboratories due to the fact that they are nearby sources that are well resolved, especially in the X-ray band. The knowledge that we gain from studying them also has a strong impact in many other fields, ranging from γ-ray bursts (GRBs) to active galactic nuclei.
Current spectral models (mostly leptonic) attempt to reproduce the observed spectral energy distributions (SEDs) of PWNe. These models, however, differ slightly from one another. Most of them model the structure of the PWN as a single sphere (i.e. one-zone models) by assuming spherical symmetry (see e.g. Venter & de Jager 2007; Zhang, Chen & Fang 2008; Tanaka & Takahara 2011; Martín, Torres & Rea 2012; Torres et al. 2014), although time dependence is an important feature of these models. The majority of models assume that the injection spectrum of particles is in the form of a broken power law. Using a particle-in-cell code, Sironi & Spitkovsky (2011) found that the particle injection spectrum may be a modified Maxwellian with a power-law tail with index ∼1.5. This is the result of magnetic reconnection at the termination shock due to the striped wind of the PWN. Vorster et al. (2013), on the other hand, model the injection of particles as a type of broken power law, with the exception that the flux at the break energy may vary discontinuously (i.e. assuming a multicomponent injection spectrum). Some authors model the injection of particles including acceleration due to the SNR shock and their subsequent emission. This is also known as thermal leakage, see Fang & Zhang (2010).
The particle transport is also handled differently. Some works calculate the particle population solving a differential equation involving diffusion, convection, and adiabatic and radiation losses (e.g. Tanaka & Takahara 2011; Torres et al. 2014), while other models only consider particle escape (e.g. Zhang, Chen & Fang 2008; Qiao, Zhang & Fang 2009). Some models omit adiabatic losses (e.g. Venter & de Jager 2007), and there are different specifications for the time-dependent PWN B-field. Different models also consider different types of emission; for example, Tanaka & Takahara (2011) take synchrotron-self-Compton (SSC) emission into account and others consider bremsstrahlung (e.g. Martín et al. 2012) in addition to inverse Compton (IC) scattering and synchrotron radiation (SR). While these models have been reasonably successful at reproducing observed SEDs, these one-zone spectral models cannot reproduce any of the observed morphological properties of PWNe.
Conversely, magnetohydrodynamic (MHD) models are also being developed that can model the morphology of PWNe in great detail (e.g. Bucciantini 2014), but they in turn cannot predict the SED from the PWNe. These models describe the geometry and environment of the PWN and not the high-energy particle spectrum and therefore the information about the radiation spectrum is lost. There are, however, models that follow a hybrid approach (e.g. Porth et al. 2016): they model the morphology of the PWN in great detail using an MHD code, and then use a steady-state spectral model to produce the SED of the PWN.
In light of the above, there is a void in the current modelling landscape for a spatiotemporal and energy-dependent PWN model that models both morphology and the SED of a PWN. By adding a spatial dimension to an emission code, one is able to constrain the model more significantly using available data such as surface brightness profiles, spectral index versus radius, and energy-dependent source size, and thus probe the PWN physics more deeply. For example, current spectral models have degenerate best-fitting parameters. Since they are not spatially dependent, they cannot constrain functional dependences such as B-field and diffusion coefficient profiles. Our newly developed time-dependent, multizone model aids in breaking some degeneracies by first constraining the profiles of, e.g. the PWN B-field and then fitting the observed SED in a more constrained parameter space, thus making use of both spectral and spatial data. Further motivation to develop this type of model comes from observations of a PWN population. Kargaltsev et al. (2015) found that the measured γ-ray luminosity (1–10 TeV) of PWNe does not correlate with the spin-down luminosity of their embedded pulsars. Alternatively, they found that the X-ray luminosity (0.5–8 keV) is correlated with the pulsar spin-down luminosity. Furthermore, there are indications that a strong correlation exists between the TeV surface brightness of the PWNe and the spin-down luminosity of their embedded pulsars (Abdalla et al. 2018). A spatially dependent spectral model will yield the flux as a function of radius, allowing one to model the surface brightness and thus probe this and other relationships. Furthermore, one would be in a position to interpret the anticipated morphological details that will be measured by future experiments. In light of the above, we implemented such a model (Van Rensburg, Kruger & Venter 2014; Van Rensburg 2015) and discuss its behaviour in this paper.2
In this paper, we describe the development of our PWN model. In Section 2, we describe some technical details and assumptions of our model. Section 3 details the calibration of our code against independent models, while we perform a parameter study in Section 4. We discuss spatially dependent results in Section 5, and our conclusions follow in Section 6.
2 THE MODEL
In this section, the development and implementation of the multizone, time-dependent code, which models the transport of particles through a PWN, is described. We make the simplifying assumption that the geometrical structure of the PWN may be modelled as a sphere into which particles are injected and allowed to diffuse and undergo energy losses. Another assumption is that particle transport is spherically symmetric and thus the only changes in the particle spectrum will be in the radial direction (apart from changes in the particle energy). The model therefore consists of three dimensions in which the transport equation is solved: the spatial or radial dimension, the lepton energy dimension, and the time dimension.
2.1 The transport equation
2.2 The particle injection spectrum
2.3 Energy losses
The particles in the PWN also lose energy due to adiabatic processes caused by the bulk motion of the particles in the PWN as energy is expended to expand the PWN. The adiabatic energy losses are given by |$\dot{E}_{\rm {e,ad}} = \frac{1}{3}(\nabla \cdot \boldsymbol {V})E_{\rm {e}}$| (e.g. Zhang et al. 2008). The two radiation loss rates and the adiabatic energy loss rate can be added to find the total loss rate |$\dot{E}_{\rm {e,tot}}$| used in equation (2).
2.4 Diffusion
2.5 Bulk particle motion and magnetic field
2.6 Numerical solution to the transport equation
2.7 Boundary conditions
2.8 Radiation spectrum
2.9 Line-of-sight calculation
Next, the radiation per unit volume can be calculated by dividing the radiation spectrum by the volume of the zone where the radiation originated. This is used to perform the line-of-sight (LOS) calculation to project the radiation on to the plane of the sky in order to find the surface brightness and flux as a function of 2D projected radius. This allows us to estimate the size of the PWN and also study this size as a function of energy.
We multiply the radiation per unit volume by the volume in a particular LOS (VLOS) as viewed from Earth (Fig. 1).
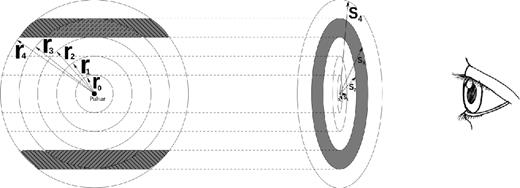
This expression, however, holds only when s < r. If s is larger or equal to r, then the intersection volume will simply be the volume of the sphere of radius r. The total radiation for the specific LOS, or annulus, can be calculated by adding the radiation for all the segments (Fig. 1). To find the total radiation at Earth from the PWN, the radiation from all the different LOSs (annuli) may be added.
As a test of this LOS calculation, we summed the total flux from all the spheres to find the total flux from the PWN and then also added the flux from all the cylinders after the LOS calculation. Both these calculations yielded the same flux. We can now use this projected flux to calculate the surface brightness profile and thus calculate the size of the PWN (Section 5).
3 CODE CALIBRATION VIA SED FITS
PWN G0.9+0.1 will be used as a case study to calibrate our newly developed code and here we briefly summarize some of its observational properties. Becker & Helfand (1987) observed G0.9+0.1 for 45-min integrations at 20 and 6 cm, which led to the discovery of the composite nature of this bright, extended source near the Galactic Centre (GC) in the radio band. SNR G0.9+0.1 has since become a well-known SNR, with an estimated age of a few thousand years. This source exhibits a flat-spectrum radio core (∼2 arcmin across) corresponding to the PWN, and also clearly shows steeper shell components (|$\sim\!\! {} 8{\rm \,arcmin}$| diameter shell). While performing a survey on the GC, Sidoli et al. (2004) serendipitously observed SNR G0.9+0.1 using the XMM–Newton telescope. Their observations provided the first evidence of X-ray emission from PWN G0.9+0.1. Sidoli et al. (2004) fit an absorbed power-law spectrum that yielded a photon index of Γ ∼ 1.9 and an energy flux of F = 4.8 × 10⁻¹² erg cm−2 s−1 in the 2–10 keV energy band. This translates to a luminosity of LX ∼ 5 × 1034 erg s−1 for a distance of 10 kpc. Aharonian et al. (2005) studied VHE γ rays from the GC with the H.E.S.S. telescope. During the observation of Sgr A*, two sources of VHE gamma rays were clearly visible, with SNR G0.9+0.1 being one of these sources. They performed a power-law fit to the observed spectrum and found a photon index of 2.29 ± 0.14stat with a photon flux of (5.5 ± 0.8stat) × 10−12 cm−2 s−1 for energies above 200 GeV. This flux is only |$\sim\! {} 2 \,{per\,cent}$| of the flux from the Crab nebula, making PWN G0.9+0.1 one of the weakest sources detected at TeV energies to date. Some years later, the radio pulsar PSR J1747−2809 was discovered in PWN G0.9+0.1 with period6P = 52 ms and |$\dot{P} = 1.85\times 10^{-13}$| (Camilo et al. 2009).
In the next section, we calibrate our new model against a previous more basic model (Venter & de Jager 2007). This model only assumed a parametric form for the B-field, and did not take into account work done by the B-field and the effect thereof on its time dependence. The calibration with this older model is a first point of reference and is also done for historical reasons, since our new model incorporates many of the basic elements of the Venter & de Jager (2007) model. We also calibrated our new model against a more modern model (Torres et al. 2014). Both of these earlier works assumed one-zone models (no spatial dependence). We decided to add another calibration using the model of Lu et al. (2017, results not shown since we focused on PWN G0.9+0.1). The fact that the respective predicted spectra are in reasonable agreement increases our confidence in the accuracy of our model.
3.1 Calibration against the model of Venter & de Jager (2007)
The assumed model parameters used to calibrate our model against that of Venter & de Jager (2007) are listed in Table 1. In Table 1, n is the braking index given by |$n = \Omega \ddot{\Omega }/\dot{\Omega }^2$|, with |$\Omega = 2 {\pi} /P$| the angular speed and P the period of rotation of the pulsar; βVdJ is the B-field parameter as in equation (33); and B(tage) is the present-day B-field. In this first calibration with Venter & de Jager (2007), we use |$B(t_{\rm {age}})=40.0\, {\mu}$|G, noting that their model was developed before the discovery of PSR J1747−2809 associated with PWN G0.9+0.1. The more reasonable value for the present-day B-field, 14.0 |${\mu}$|G, is used in the calibration against the model of Torres et al. (2014) in the next section as we now know P and |$\dot{P}$| for the embedded pulsar, as mentioned above. Also, ε is the conversion efficiency as mentioned in equation (4), tage is the age of the PWN, τ0 is the characteristic spin-down time-scale of the pulsar, d is the distance to the PWN, α1 and α2 are the spectral indices, and L0 is the birth spin-down luminosity. The sigma parameter (σ) is the ratio of the electromagnetic to particle energy density and is used to calculate the maximum particle energy. We chose three soft-photon components: the CMB with a temperature of T1 = 2.76 K and an average energy density of u1 = 0.23 eV cm−3, Galactic background infrared photons as component 2, and optical starlight as component 3 (with Ti and ui as given in Table 1). For these assumed model parameters, we find the SED as shown in Fig. 2. The radio data are from Becker & Helfand (1987), the X-ray data from Porquet, Decourchelle & Warwick (2003) and Sidoli et al. (2004), and the gamma-ray data from Aharonian et al. (2005). The solid line represents our predicted SED, while the dashed line shows the output from the model of Venter & de Jager (2007).
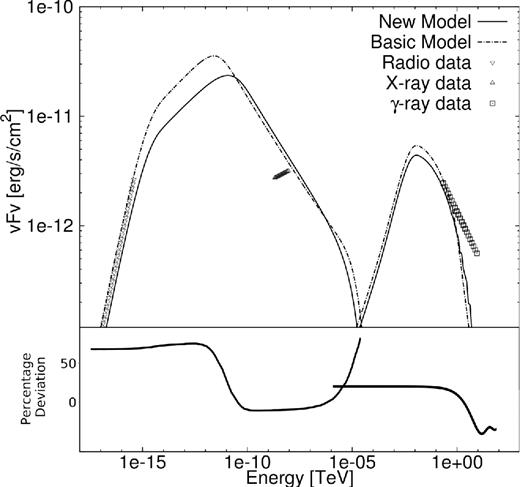
Calibration against the model of Venter & de Jager (2007) for PWN G0.9+0.1. Bottom panel indicates the percentage deviation between the two SEDs.
Values of model parameters as used in the calibration against the model of Venter & de Jager (2007) for PWN G0.9+0.1.
| Model parameter . | Symbol . | Value . |
|---|---|---|
| Braking index | n | 3 |
| B-field parameter | βVdJ | 0.5 |
| Present-day B-field | B(tage) | 40.0 |${\mu} \rm {G}$| |
| Conversion efficiency | ε | 0.6 |
| Age | tage | 1 900 yr |
| Characteristic time-scale | τ0 | 3 681 yr |
| Distance | d | 8.5 kpc |
| Q index 1 | α1 | −1.0 |
| Q index 2 | α2 | −2.6 |
| Initial spin-down power (|$10^{38}\,\rm {erg}$||$\rm {s^{-1}}$|) | L0 | 0.99 |
| Sigma parameter | σ | 0.2 |
| Soft-photon component 1 | T1 and u1 | 2.76 K, |$0.23\, \rm {eV\,cm^{-3}}$| |
| Soft-photon component 2 | T2 and u2 | 35 K, |$0.5\, \rm {eV\,cm^{-3}}$| |
| Soft-photon component 3 | T3 and u3 | 4500 K, |$50\, \rm {eV\,cm^{-3}}$| |
Our time-dependent, multizone PWN model does not reproduce the results of Venter & de Jager (2007) exactly, but the SEDs are quite close. The reason for this is the fact that the older model did not take into account IC losses in the particle transport, since it assumed SR losses to dominate. This led to particle energy losses being underestimated, leaving an excess of high-energy particles. Their IC radiation is therefore slightly higher than our new model prediction. Other differences may result from our very different treatment of the particle transport as we solved a full transport equation and Venter & de Jager (2007) solved a linearized transport equation using energy losses, diffusion and effective time-scales.
One thing to note here is that in Table 1, the two variables ε and σ are independent. They are, however, in reality related by ε = 1/(1 + σ). This inconsistency is only present in the calibration with Venter & de Jager (2007) and is correctly implemented in the rest of the paper.
Our model fits the data quite well, but still has trouble in fitting the slope of the X-ray spectrum. Vorster et al. (2013) modelled PWN G21.5−0.9 where they also encountered this problem when using a broken-power-law injection spectrum that connects smoothly at some break energy. They therefore used a two-component particle injection spectrum that does not transition smoothly (instead the low-energy component cuts off steeply in order to connect to the lower-flux, high-energy component), allowing them to fit both the radio and X-ray spectral slopes. This is something worth noting for future development of our code.
3.2 Calibration against the model of Torres et al. (2014)

Comparison of the predicted SED for the parametric versus analytical treatment of the temporal evolution of the B-field.
Values of model parameters as used in the calibration against the model of Torres et al. (2014) for PWN G0.9+0.1.
| Model parameter . | Symbol . | Value . |
|---|---|---|
| Braking index | n | 3 |
| B-field parameter | αB | 0.0 |
| B-field parameter | βB | −1.3 |
| V parameter | αV | 1.0 |
| Present-day B-field | B(tage) | 14.0 |${\mu} \rm {G}$| |
| Conversion efficiency | ε | 0.99 |
| Age | tage | 2 000 yr |
| Characteristic time-scale | τ0 | 3 305 yr |
| Distance | d | 8.5 kpc |
| Q index 1 | α1 | −1.4 |
| Q index 2 | α2 | −2.7 |
| Initial spin-down power (|$10^{38}\,\rm {erg}$||$\rm {s^{-1}}$|) | L0 | 1.1 |
| Sigma parameter | σ | 0.01 |
| Soft-photon component 1 | T1 and u1 | 2.76 K, |$0.23\, \rm {eV\,cm^{-3}}$| |
| Soft-photon component 2 | T2 and u2 | 30 K, |$2.5\, \rm {eV\,cm^{-3}}$| |
| Soft-photon component 3 | T3 and u3 | 3000 K, |$25\, \rm {eV\,cm^{-3}}$| |
Fig. 4 compares our predicted SED with the model prediction of Torres et al. (2014), with their results shown by the dashed–dotted line and our model SED shown as the solid line. The differences between the two models stem from the different ways in which the transport of particles is handled. In our code we incorporated a Fokker–Planck-type transport equation, and Torres et al. (2014) modelled the transport by using average time-scales.
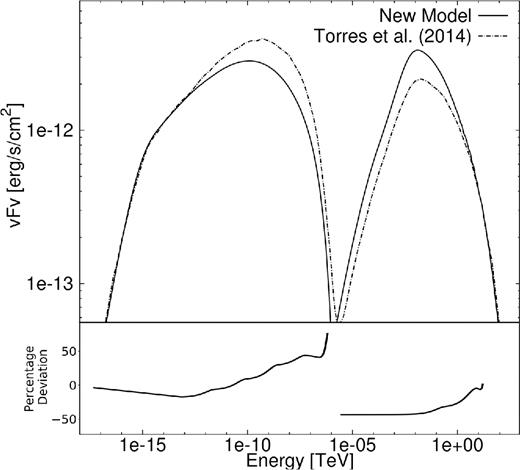
Calibration against the model of Torres et al. (2014) for PWN G0.9+0.1. Bottom panel indicates the percentage deviation between the two SEDs.
During the calibration of the code, other sources were also modelled (e.g. G21.5-0.9, G54.1+0.3, and HESS J1356-645). We found that the model yields reasonable fits for most of the chosen sources as long as they are young PWNe. These results will be shown in a subsequent paper where we will perform a more detailed PWN population study.
4 PARAMETER STUDY
We can now investigate the effects of several of the free model parameters on the predicted particle spectrum and SED. As a reference model for this section, we use the same parameters that were used in the calibration against Torres et al. (2014) for G0.9+0.1, as in Fig. 4. The SED of the PWN is calculated at Earth for each spherical zone and then these are added to find the total flux from the PWN.
4.1 Time evolution (age)
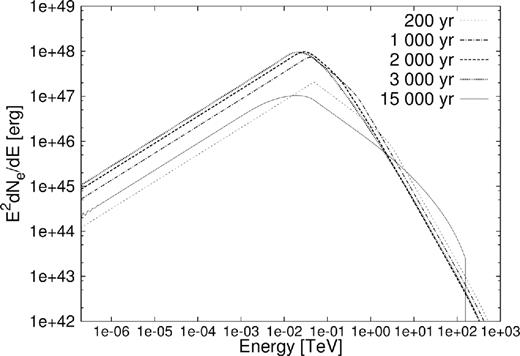
In Fig. 5, the time evolution of the lepton spectrum is shown. From this figure, it can be seen that when the PWN is still very young (tage ∼ 200 yr) the particle spectrum closely resembles the shape of the injection spectrum apart from the spectral break at a few TeV that develops due to radiation losses. As the PWN ages, however, it starts to fill up with particles (giving an increased |$E^2_{\rm {e}}{\rm d}N_{\rm {e}}/{\rm d}E_{\rm {e}}$|) and at some stage the PWN is totally filled, at an age in the order of a few thousand years. After this the level of the particle spectrum decreases. This is due to the particles losing energy over time due to SR, IC, adiabatic energy losses, and escape, and also due to the fact that the embedded pulsar is spinning down, resulting in fewer particles being injected into the PWN. The effect of the spun-down pulsar can be clearly seen in Fig. 5 by observing the spectrum at 15 000 yr. By this time, the embedded pulsar has significantly spun down so that the total particle spectrum is lower than it was at ≈200 yr due to the fact that now more particles are escaping from the modelled region at rmax than are being injected by the pulsar. Also, note the leftward shift of Eb due to radiative losses. The bump at high energies for 15 000 yr is due to a pile-up of particles. This occurs due to the decreased B-field B(t), resulting in an increased diffusion coefficient and also decreased SR energy losses. These losses are energy dependent and therefore the high-energy particles will be most affected. The increased diffusion will cause the particles to resemble the injection spectrum more and more due to suppressed SR losses.
4.2 Magnetic field
The B-field B(r, t) inside the PWN (which determines the diffusion) plays a large role in determining the shape of the SED (level and break energy of SR and IC component), and is characterized by the free parameters Bage, αB, and βB (Table 2). As a default, the present-day B-field is set to |$14 \,{\mu} {\rm G}$| and is then changed to 10, to 20, and to |$40\,{\mu} {\rm G}$| to see what effect this will have. Here, we fix the values for αB and βB to 0.0 and −1.3, respectively, as mentioned earlier, so only the value of Bage was changed (see Section 5.2 for a discussion on the changes in αV and αB). As the B-field increases from 10 to 40 |${\mu} {\rm G}$|, the particle spectrum becomes softer at high energies, since |$\dot{E}_{\rm {SR}} \propto E_{\rm {e}}^2B^2$|. Thus, higher energy particles lose more energy so that there are fewer particles at high energies left to radiate. The high-energy tail of the IC spectrum in Fig. 6 is therefore lower for a larger B-field. The SR power is directly proportional to the B-field strength squared and thus as the B-field increases, so does the SR.
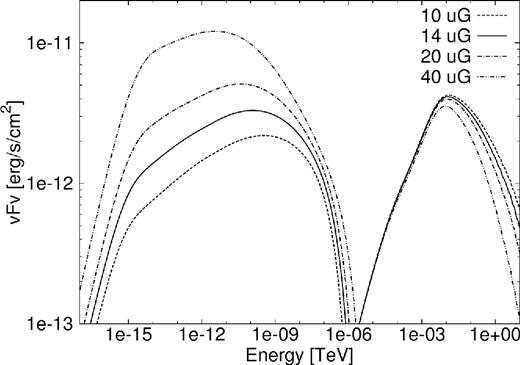
SED for PWN G0.9+0.1 with a change in the present-day B-field.
4.3 Bulk particle motion
The bulk particle motion (particle speed) in the PWN is modelled by equation (11) and the value for αV = 1 is kept constant here, although the value of V0 is changed to V0 = 0, 2V0, and V0/2 as can be seen in Figs 7 and 8. To compare our results with those of Torres et al. (2014), we need the same form for the bulk particle motion (see equation 36). The adiabatic time-scale that Torres et al. (2014) used for G0.9+0.1 was ∼2000 yr, giving V0 = 5 × 10⁻⁵ pc yr−1 for r0 = 0.1 pc and τad = 2000 yr.
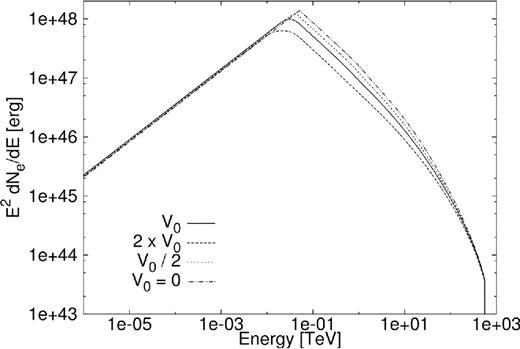
Particle spectrum for PWN G0.9+0.1 for a change in the bulk speed of the particles.
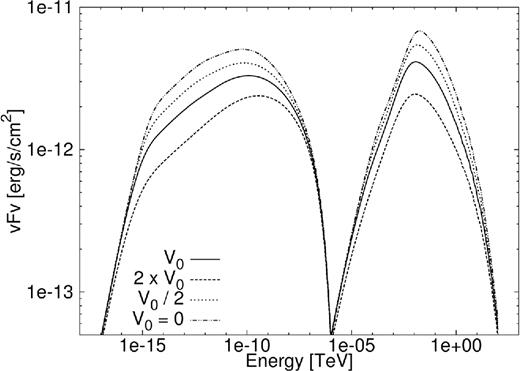
SED for PWN G0.9+0.1 for a change in the bulk speed of the particles.
In Fig. 7, the particle spectrum increases as V0 is lowered. This is due to the fact that for a lower speed, the particles lose less energy due to adiabatic losses. The adiabatic energy losses also account for the leftward shift of the peak in the particle spectrum. The radiation spectrum is linked to the particle spectrum and therefore a lower particle spectrum results in a lower radiation spectrum. This effect can be seen in Fig. 8 where the radiation decreases with an increase in the bulk speed of the particles. For high energies, SR energy losses dominate over adiabatic losses and therefore the high-energy tail of the radiation spectrum is independent of changes in V0 and the tails converge.
4.4 Injection rate/initial spin-down rate
4.5 Soft-photon fields
Table 2 shows the three different soft-photon components used to model the IC scattering in the PWN. These components can be turned on and off at will, and Fig. 9 shows the contribution of each of these components. The CMB target field produces a flat spectrum that causes the first small bump on the left-hand side of the total IC flux component. The starlight at 3000 K, with an energy density of 25 eV cm−3, produces the highest peak and plays the largest role in the overall IC flux.
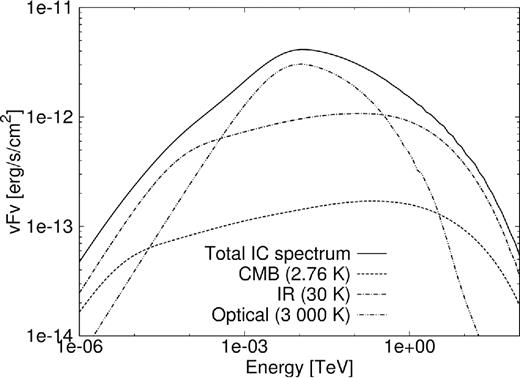
IC spectrum for PWN G0.9+0.1 showing the contribution of different soft-photon components in Table 2. The solid line is the total radiation, dashed line is the 2.76K CMB component, dashed–dotted line is the 30 K component, and the dashed-dot–dotted line shows the 3000 K component.
4.6 The effect of changing other parameters
The effects of changing most of the major parameters have been described, but the following are also free parameters worth noting. The free parameters α1 and α2 will influence the slopes and the normalization of the particle and radiation spectrum. Lastly, the flux from the PWN at Earth scales as 1/d2 and the sizes of the spatial bins are also linearly dependent on d (influencing the diffusion and convection time-scales for each zone), but the latter is a small effect on the emitted SED.
5 SPATIALLY DEPENDENT RESULTS FROM OUR PWN MODEL
In the previous sections, we showed the total particle spectrum and SED predicted by the code for different parameter choices. These calculations, however, were not the main aim of the code that we have developed, as we are especially interested in the spatial dependence of the radiation from the PWN. In this section, we will study the effects that changing some of the parameters have on the energy-dependent size of the PWN.
5.1 Effects of changes in the diffusion coefficient and bulk particle motion on the PWN’s morphology
The diffusion coefficient contains two free parameters, which can be seen in equation (10). Here, we consider the effects of changing the parameters κ0 and q (for Bohm diffusion, q = 1), with |$E^{\prime }_0$| set to 1 TeV (changing |$E^{\prime }_0$| is similar to changing κ0). We can now increase or decrease the value of κ0 (assuming it is not linked with the magnitude of the B-field) and thus change the normalization of the diffusion coefficient. We can also change q that has an influence on the energy dependence of the diffusion coefficient:
Fig. 10 shows how the size of the PWN changes with energy for three different scenarios. The thin solid lines indicate 5κ0, the thick solid lines indicate κ0, and the dashed lines indicate κ0/5. The left graphs show SR and the right graphs IC emission. For this set of scenarios, the size of the PWN increases with increased energy. In the first two scenarios, diffusion dominates the particle transport and causes the high-energy particles to diffuse outward faster than low-energy particles, filling up the outer zones and resulting in a larger size for the PWN at high energies. This effect is larger for high-energy particles due to the energy dependence of the diffusion coefficient (q > 0). For κ0/5, we see that the effect is not as pronounced. Here, the diffusion coefficient is so small that the SR energy loss rate starts to dominate diffusion. The particles therefore ‘burn off’ or expend their energy before they can reach the outer zones (cooling therefore dominates). Changes to q have similar effects on the SED than changes to κ0 but are more pronounced at higher energies.
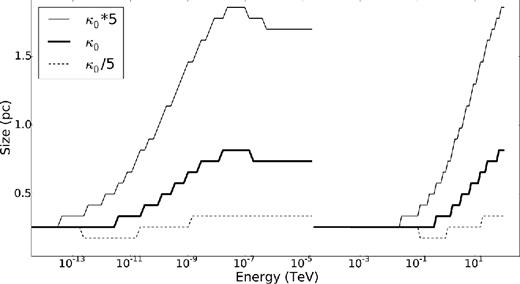
Size of the PWN as a function of energy when the normalization constant of the diffusion coefficient is changed.
Next, we studied the effect of varying the bulk motion on the energy-dependent size of the PWN by varying V0 for two different cases: the first as seen in Fig. 11 is for the model parameters given in Table 2, while the second as seen in Fig. 12 is for the parameters given in Table 3. If we consider V0 = 0 (Fig. 11), indicated by the dashed line, we find that the size of the PWN is determined by the energy-dependent diffusion and therefore the size increases with increasing energy. Adding a bulk flow to the code (e.g. non-zero V0 and thick solid line) increases the size of the PWN irrespective of the energy of the particles. However, for a very large bulk flow speed (e.g. 10V0 and thin solid line), the radio size is significantly larger than the X-ray size. This is due to the energy dependence of the SR energy losses that dominate at higher energies, thereby reducing the lifetime of these X-ray-emitting particles and resulting in a smaller source compared to the radio. In this first case, αV = 1, which is non-physical as mentioned in the discussion following equation (36). The bulk flow speed becomes so large in the outer zones that particle escape becomes significant. Therefore, if the normalization is increased beyond 10V0, the radio source size in fact starts to decrease. Next, we do a similar study by using the more physical set of parameters given in Table 3, where αV = −1. Fig. 12 shows the effect of changes to the normalization of the bulk motion of particles.
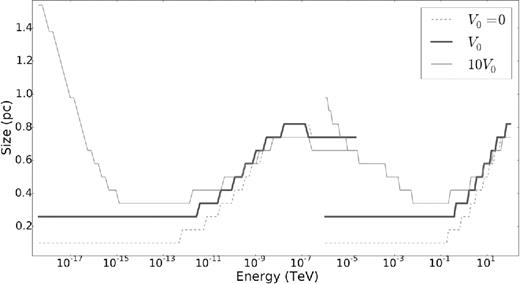
Size of the PWN as a function of energy for different normalizations of the bulk particle speed for the model parameters given in Table 2.
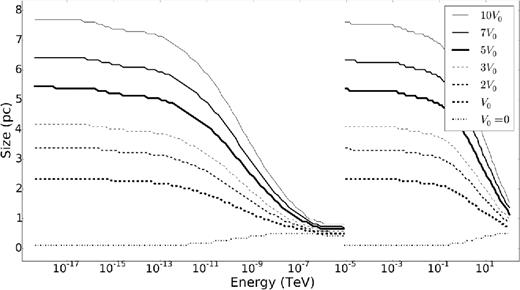
Size of the PWN as a function of energy for different normalisations of the bulk particle speed for the model parameters given in Table 3.
Modified parameters for PWN G0.9+0.1 for fitting the SED as well as the energy-dependent size of the PWN.
| Model parameter . | Symbol . | Value . | Torres et al. (2014) . |
|---|---|---|---|
| Present-day B-field | B(tage) | 15.98.0 |${\mu} \rm {G}$| | 14.0 |${\mu} \rm {G}$| |
| Age of the PWN | tage | |$3 227\, \rm {yr}$| | |$2 000 \rm {\,yr}$| |
| Initial spin-down power (|$10^{38}\,\rm {erg}$||$\rm {s^{-1}}$|) | L0 | 1.44 | 1.0 |
| B-field parameter | αB | 0.0 | 0 |
| B-field parameter | βB | −1.0 | −1.3 |
| V parameter | αV | −1.0 | 1.0 |
| Particle bulk motion | V0 | 0.0615c | 1.63 × 10⁻⁴c |
| Diffusion | κ0 | 3.356 | 1.0 |
Again, if V0 = 0 (dashed–dotted line, the same line as in Fig. 11), the PWN has a smaller size at lower energies than at higher energies. The size increases monotonically with V0. At the lower energies convection dominates the radiative energy losses and therefore the particles have a very long lifetime, allowing them to diffuse to the outer zones and still be able to radiate, resulting in a large source size. In contrast to this, at high energies, the SR losses dominate the convection, resulting in a very short lifetime for the high-energy particles; therefore, these particles radiate all their energy before they have time to convect to the outer zones. This leads to a relatively smaller X-ray source size.
5.2 Different cases of αV and αB
In equations (11) and (14), we assumed that the B-field may have a spatial and time dependences and that the bulk motion only has a spatial dependence. In this section, the effects of different spatial dependences for B(r, t) and V(r) are studied. Note that we have assumed the diffusion coefficient to be spatially independent throughout this work. However, since we are now considering the spatial dependence of the B-field in this paragraph, and κ ∝ 1/B(r, t), this assumption is technically violated here. The effect is small when the divergence of |$\vec{\kappa }$| is small, which we will assume to be the case in this section. This spatial dependence of the diffusion coefficient can be implemented in future by adding another convective term to the transport equation.
From equation (20), the following relationship is assumed to hold: αV + αB = −1. For this section, the time dependence of the B-field is kept unchanged, with βB = −1.3, and four different scenarios for αB and αV are shown. Here, the first situation is the same as Torres et al. (2014), with αB = 0 and αV = 1. We also considered the following three situations: αB = 0 and αV = −1, αB = −0.5 and αV = −0.5, and αB = −1 and αV = 0. These three situations all comply with equation (20), with the B-field kept constant in the first spatial zone. The B-field was limited to a maximum value, as the parametrization resulted in the B-field growing infinitely large during the early epochs of the PWN’s lifespan.
In Fig. 13, the particle spectrum is shown for the four different scenarios, with the solid line showing the result for αB = 0 and αV = 1 as is effectively assumed by Torres et al. (2014). In this case, the B-field is spatially constant over the entire PWN, but the bulk speed increases linearly with r. The particles move extremely fast, as they propagate farther from the centre of the PWN. They therefore lose more energy due to adiabatic energy losses relative to the other cases. Thus, the solid line is lower than the other situations and the peak of the spectrum is also shifted to the left.
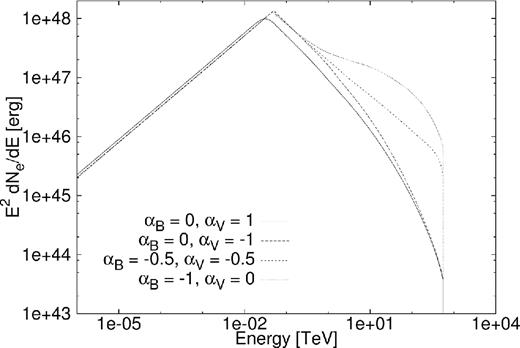
Particle spectrum for PWN G0.9+0.1 with a change in the parametrized B-field and bulk particle motion.
We can see from both Figs 13 and 14 that changes to the B-field have a more profound impact on the particle spectrum and SED than changes to the radially dependent speed. If the spatial dependence of the B-field changes from αB = 0 to αB = −0.5 and αB = −1, the B-field is first constant over all space and then decreases as r−0.5 and finally it reduces rapidly as r−1. The effect of this can be seen in the particle spectrum, as the number of high-energy particles increases for a decreased B-field and hence a lower SR loss rate. This effect is emphasized in the situation where αB = −1, resulting in a very small B-field at the outer edges of the PWN. This can also be seen in the radiation spectrum in Fig. 14 where a decreased B-field results in reduced radiation in the SR band (since |$\dot{E}_{\rm {SR}} \propto B^2$|), and the increased radiation in the IC band is due to more particles being present at those energies. This increase in the high-energy particles is quite large for αB = −1, though (possibly indicating a violation of our assumption that the divergence of |$\vec{\kappa }$| is small in this case). We note that our model currently does not take into account the fact that the cut-off energy due to particle escape (Emax) should also be a function of the B-field. This is because in reality σ ∝ B2 (we have assumed σ to be constant), and therefore |$E_{\rm {max}} \sim \sqrt{B^2/(1+B^2)}$|, which will have the effect that if the B-field is reduced, σ and therefore Emax will decrease. This may cause the high-energy particles to be cut-off at lower energies as the B-field decreases due to more efficient particle escape, and therefore the build-up of high-energy particles may be partially removed (we say ‘partially’ since the Larmor radius of the most energetic particles in the outer zones is still smaller than the PWN size by a factor of a few, inhibiting efficient escape of particles from the PWN). The question of particle escape may also be addressed by refining our outer boundary condition in future.
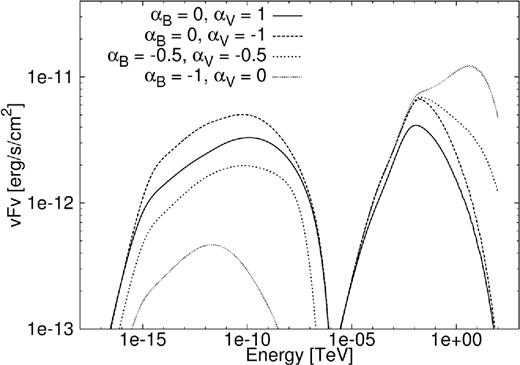
SED for PWN G0.9+0.1 with a change in the parametrized B-field and bulk particle motion.
From Fig. 15, we can see that in scenario one (dashed line, αB = 0 and αV = 1) the PWN size for low energies is always larger than for all the other scenarios. This is due to the bulk speed being directly proportional to r in this case, resulting in the particles moving faster as they move farther out from the centre of the PWN. This will result in the outer zones filling up with particles, while not escaping. This may point to our outer boundary that was chosen to be much larger than the radius of the PWN (rmax ≫ RPWN). For scenario two (thick solid line, αB = 0 and αV = −1), the size of the PWN at low energies follows the same pattern as for both low-energy and high-energy photons, since the energy-dependent diffusion now dominates convection. At lower energies, we see that PWN is smaller than in scenario one, as the speed is now proportional to r−1, which results in a slower bulk motion and thus fewer low-energy particles moving to the outer zones. In scenario three (thin solid line, αB = −0.5 and αV = −0.5) and four (dotted line, αB = −1 and αV = 0), the B-field has a spatial dependence, reducing as one moves farther away from the centre of the PWN. This reduced B-field will lead to increased diffusion and decreased SR losses as mentioned in the first part of this section. For these two scenarios, the dependence of the bulk motion on radius is weaker and therefore diffusion dominates the particle transport. Once again we can see the energy dependence of the diffusion, since the PWN is initially smaller and then increases for higher energies. At very high energies, the PWN size becomes very large, which is not the case for the SR component. The first is due to the pile up of high-energy particles (leading to substantially increased IC emission, Fig. 14), while the second is due to the fact that SR is severely inhibited for the very low B-field.
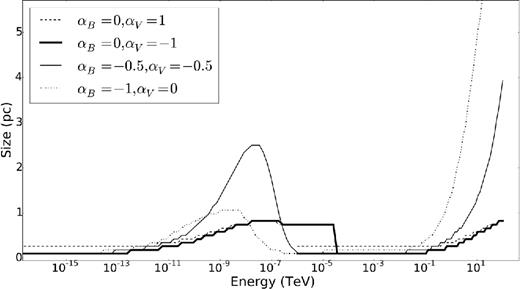
Size of PWN G0.9+0.1 as a function of energy for changes in αB and αV.
5.3 Size versus energy fits
Figs 16 and 17 show the radiation spectrum and the size versus energy graphs for PWN G0.9+0.1 for the calibration parameters (black lines) as in Table 2 modelled by Torres et al. (2014), with the dots indicating the estimated radio and the square the estimated X-ray size.9 The upper limit on the predicted TeV size is 10.4 pc, i.e. we use the point spread function of the H.E.S.S. telescope (not shown). The radio data are from Becker & Helfand (1987) and Dubner et al. (2008), the X-ray data are from Porquet et al. (2003) and the TeV data from Aharonian et al. (2005). The model provides reasonable fits to the spectral radio, X-ray, and TeV data; however, it is clear that the predicted size of the PWN does not fit the data at all. After adjusting some parameters, we found a better fit and this can also be seen in Figs 16 and 17 (grey lines). Table 3 shows the new parameters used for this fit.
The process of finding a better fit to the both the SED of the PWN and the energy-dependent size was facilitated by our prior parameter study. The only way in which we could increase the size of the PWN at lower energies was to increase the bulk speed of the particles. This, however, increased the adiabatic energy losses, and resulted in a lower radiation spectrum. This was then countered by increasing the age of the PWN (which effectively leads to an increase in L0). The bulk speed of the particles had to be increased substantially to fit the data, but given the large errors on the size of the PWN in the radio band, we could still fit the data with a bulk speed as small as 0.073c. The profile trends for the B-field as well as the bulk speed of the particles were also changed. To increase the size of the PWN further we also increased the normalization of the diffusion coefficient of the particles. This is not a bad assumption as the diffusion was originally modelled to be Bohm-type diffusion, which is a very slow perpendicular diffusion with respect to the B-field. All these changes produced the grey lines in Figs 16 and 17. Here, we see that we have a good fit for the radio size, which according to data, does not change with energy and the model reproduces this trend as well as the trend where the size of the PWN decreases with increasing energy. This is a common feature of PWNe.
In a future paper, a more robust statistical method may be used to find the best fit to this source’s SED and energy-dependent size and to also investigate the parameter degeneracy.
6 CONCLUSIONS
This study focused on modelling the evolution of PWNe, with the main aim being to create a spatially dependent temporal code to model the radiation morphology of PWNe. We solved a Fokker–Planck-type transport equation to model the particle evolution inside a PWN, injecting a broken power-law particle spectrum and allowing this spectrum to evolve over time taking into account energy losses due to SR, IC scattering, and adiabatic cooling of the PWN due to expansion. We also took into account particle diffusion and convection in the form of a bulk particle motion.
We calibrated the code by comparing it to results by two independent codes (Venter & de Jager 2007; Torres et al. 2014), using PWN G0.9+0.1 as calibration source. We found that our model was well calibrated. Our model is now able to not only fit the observed radiation spectra from the PWN but also yields results concerning the morphology of the PWN (i.e. it is able to reproduce the size of the PWN as a function of energy). Thus, we can potentially derive stronger constraints on key quantities characterizing the PWN.
The spatiotemporal-energetic model we presented is a first approach to modelling PWNe for multiple spatial bins, thus there are a number of improvements that can be made. For example, the code currently has a problem with a build-up of particles at high energies when the B-field decreases rapidly with radius. This is partially due to the fact that we chose a fixed rmax ≫ RPWN. We will revise this boundary condition in future. One way in which this could be refined is by using an MHD code to model the morphology of the PWN in more detail and to find a more realistic time-dependent radius of the PWN. This will allow us to use this radius as the outer boundary that will enable the particles to escape more efficiently from the PWN. One can also obtain more realistic spatial and time dependences for the B-field and bulk flow speeds using an MHD code. This will yield refined SR and adiabatic losses and convection. Furthermore, treating σ as being dependent on the B-field will aid by lowering the maximum energy of particles that are contained within the PWN. The code should also be generalized in future to handle a spatially dependent diffusion coefficient by adding another convective term to the transport equation.
In future, we will perform a population study to investigate currently known trends, e.g. the X-ray luminosity that correlates with the pulsar spin-down luminosity and its anticorrelation with the characteristic age of the pulsar. We could also probe other trends, e.g. investigate whether there is a correlation between the TeV surface brightness of the PWN and the spin-down luminosity of the pulsar (Abdalla et al. 2018), as well as the surface brightness versus age. Some follow-up projects or refinements to the model are as follows. The code currently assumes spherical symmetry. This can be revised by expanding the model to two or three spatial dimensions. One could also add anisotropic effects such as considering distinct equatorial and polar outflows (injection) of particles. Some older PWNe are offset from the pulsar, revealing a bullet shape. This is either due to an inhomogeneity in the interstellar medium (ISM) in which the PWN expands causing an asymmetric reverse shock and thus an offset PWN, or to the pulsar receiving some kick velocity at birth, thus moving away from the PWN centre. The radiation peaks at the pulsar position, thus also causing the bullet shape. These effects could be added to the model to simulate a more realistic situation. The code is currently only applicable to young PWNe. This should be addressed so that all ages of PWNe can be modelled, e.g., by including a more complex parametrization of the B-field and adding the effect of an asymmetric reverse shock to the code.
The CTA will reveal more sources and more information regarding the morphology of PWNe due to its improved sensitivity and angular resolution. This will necessitate the continued development, application, and refinement of spatially dependent PWN codes such as the one discussed here.
Acknowledgements
We gratefully acknowledge fruitful discussions with Andreas Kopp, Harm Moraal, and Stefan Ferreira. This work is based on the research supported wholly/in part by the National Research Foundation (NRF) of South Africa (grant numbers 87613, 90822, 92860, 93278, and 99072). The grantholder acknowledges that opinions, findings, and conclusions or recommendations expressed in any publication generated by the NRF supported research is that of the author(s), and that the NRF accepts no liability whatsoever in this regard.
Footnotes
It has come to our attention during the final stages of our code development that an independent study has recently been published by Lu, Gao & Zhang (2017) describing a spatially dependent PWN model. Their code models the electron spectrum using a Fokker–Planck equation, similar to our code, and then predicts the SED from the PWN. They also assume spherical symmetry and take into account SR, IC, and adiabatic energy losses. They use free expansion to determine the radius of the PWN, while we in contrast use the surface brightness of the PWN to predict its size. Although they calculate the surface brightness, they only predict this for the X-ray band. We model the surface brightness for the entire electromagnetic spectrum and thus we predict the size of the PWN as a function of energy. We also perform a thorough parameter study to show the effects of all the model parameters. Lastly, they applied their model to MSH 15-52, while we studied G0.9+0.1. We therefore believe that our results are complementary to their work. Indeed, their work provides another independent calibration of our model, and we find very similar spectra for the same input parameters for MSH 15-52. See Section 3 for other calibrations of our code.
We neglect SSC and Bremsstrahlung as the energy losses due to these two effects are orders of magnitude smaller than SR and IC scattering for PWN G0.9+0.1.
We treat the B-field as predominantly azimuthal as is standard practice (e.g. Schöck et al. 2010; Vorster & Moraal 2014). This assumption is based on several arguments: in this case |$\nabla \cdot \boldsymbol {B} = 0$|, at typical PWN scales any dipolar field components have all but died out compared to the toroidal components (given their respective 1/r3 versus 1/r decay), and X-ray observations show ubiquitous polar and equatorial outflows supporting an azimuthal structure winding around the pulsar in the equatorial plane. Lastly, radio polarization measurements indicate that the magnetic field must be very ordered.
We assumed the parametric form for the B-field for mathematical expedience assuming the PWN is young. In fact, it is explicitly stated in the Torres et al. (2014) that at earlier times the B-field may be approximated using a power law in time [B ∼ t−1.3; see also Vorster et al. (2013) and references therein]. One could use the numerical solution as done by Torres et al. (2014), but the question then is what the effect of uncertainty on RPWN(t) will be on the eventual B(t); i.e. this approach is also not without some assumptions. Our simple approach of using a parametrized B-field is meant to be an approximation to the output of a complex MHD code. The solution to such a code is beyond the scope of the current paper and is avoided for the reason that we are focusing on emission physics. In future, one may consider the combination of emission and MHD codes to obtain even more realistic results. To test the effect of parametrizing the B-field versus calculating it numerically, we implemented the latter approach and found that respective results are very close (see Section 3.2). For older PWNe, a numeric approach will be better and the effect of the reverse shock will also have to be taken into account.
Below we discuss calibration of our model against that of Venter & de Jager (2007). To closer align with their procedure, for the sake of calibration, we fixed the value of L0 and birth period P0 = 43 ms van der Swaluw & Wu 2001, assuming no decay of the pulsar B-field, i.e. |$P_0 \dot{P}_0=PP_0$|. In the rest of the paper, however, we calculate τc using P and |$\dot{P}$|, we assume tage, and from this follows τ0 and L0 (without the need to calculate P0 and |$\dot{P}_0$| explicitly).
For simplicity, we assume this distant boundary for the PWN where particles escape. We restrict ourselves to modelling young PWN where free expansion of the wind should be justified. Later evolutionary phases may be characterized by a reverse shock, or reverberation phase where interaction with the ambient medium is much more important. If we would enforce particle escape at a moving boundary RPWN rather than following our approach of escape at a distant boundary, the particle density may be somewhat lower, leading to slightly lower fluxes than predicted by our model.
Whether a PWN’s morphology is energy-dependent seems to be closely linked with the evolutionary stage of the PWN and to whether particles efficiently escape from the system beyond RPWN(t). As mentioned in the Introduction section, young systems with slow moving embedded pulsars may manifest as composite SNRs with a high degree of spherical symmetry, prior to the interaction with the SNR reverse shock. In such systems, particles may not have had time to cool significantly due to radiation losses, leading to a morphology that seems to be largely energy independent. Middle-aged PWNe may exhibit complex morphologies (e.g. collimated X-ray emission versus more diffuse ambient radio emission), while in older PWNe, the γ-ray emission may dominate the radio and X-ray emission. This is probably due to the fact that high-energy particles are the ones that preferentially cool and escape from the PWN. Hinton et al. (2011) argue that while confinement of particles in PWNe may be effective during the early stages of evolution, the interaction with the SNR reverse shock may disrupt the PWN via, e.g. the growth of Rayleigh–Taylor instabilities, and diffusion of particles out of the PWN becomes possible. In the case of PWN G0.9+0.1, we may be witnessing an intermediate case. While this PWN is quite young and the radio and X-ray sizes are very similar, the X-ray morphology seems to be slightly smaller than the radio (Dubner et al. 2008). This hint of morphological evolution (Fig. 17) is consistent with the observed softening of the X-ray spectrum as one moves from the inner to outer regions of the PWN, indicating the effect of SR losses in this system (Porquet et al. 2003).
We directly infer the source sizes for the radio and X-rays bands from the respective images in the original papers. This procedure may be somewhat arbitrary and prone to error, and also dependent on the presentational choices or assumptions made in the original papers. The best way to determine these sizes would be to redo the data analysis and infer them in a systematic way. However, this is beyond the scope of the current modelling paper. Furthermore, we note that our model is spherically symmetric, while the data indicate that the source is not. To account for these uncertainties (i.e. source asymmetry and actual energy-dependent source size), we specified a sizable error on our estimated values.
REFERENCES
APPENDIX
We derive expressions for L(t) and L0(τ0) to show that τ0 = τc − tage. We make two assumptions: the first is that the B-field of the pulsar does not decay over short time-scales, i.e. |$\dot{P}P^{n-2} = \dot{P}_0P_0^{n-2}$| (e.g. Venter & de Jager 2007) and the second is a braking law of the form |$\dot{\Omega } = k \Omega ^n$| (e.g. Pacini & Salvati 1973; Rees & Gunn 1974; Gaensler & Slane 2006).


