


Abstract
The principal aim of this work is to study the velocity field in the Monoceros star-forming region using the radial velocity data available in the literature, as well as astrometric data from the Gaia first release. This region is a large star-forming complex formed by two associations named Monoceros OB1 and OB2. We have collected radial velocity data for more than 400 stars in the area of 8 × 12 deg2 and distance for more than 200 objects. We apply a clustering analysis in the subspace of the phase space formed by angular coordinates and radial velocity or distance data using the Spectrum of Kinematic Grouping methodology. We found four and three spatial groupings in radial velocity and distance variables, respectively, corresponding to the Local arm, the central clusters forming the associations and the Perseus arm, respectively.
1 INTRODUCTION
The third Galactic quadrant is one of the more interesting and conspicuous regions of the Milky Way. In the direction of Canis Majoris, a stellar overdensity was detected (Martínez-Delgado et al. 2005), the origin of which is not well established yet. Its origin might correspond to the core of a dwarf galaxy, which was not fully digested by the Milky Way and whose debris gave rise to the ring of Monoceros (Sollima et al. 2011). Other authors consider that the ring is the flared and warped outer Galactic population (Momany et al. 2006). The southern warp has its maximum amplitude in a direction close to 240° (Evans et al. 1998), and it is also in this region where the vertical structure of the young disc shows an extended deformation with a maximum depth of 500 pc, named Big Dent (Alfaro, Cabrera-Caño & Delgado 1991), with two main axes of 3 and 2 kpc, respectively, and whose nucleus is at 2 kpc from the Sun. The collision with high-velocity clouds (Tenorio-Tagle et al. 1987) or dark matter haloes (Bekki & Chiba 2006) could be the cause of this deformation and one of the possible machines generating the observed corrugations in the Galactic disc (Alfaro, Cabrera-Caño & Delgado 1992; Alfaro & Efremov 1996).
Furthermore, the third quadrant of the Galaxy is crossed by at least three spiral arms: Local, Perseus, and Outer (Vázquez et al. 2008). In the Local and Perseus arms, there are two well-defined areas (Orion and Monoceros), which have a peculiar distribution and high rate of star formation (Maddalena et al. 1986; De Zeeuw, Hoogerwerf & De Bruijne 1999; Lee & Chen 2005; Lombardi, Alves & Lada 2011).
In this paper, we study the spatial and kinetic structure of the Monoceros region. The first Gaia release (Gaia Collaboration et al. 2017), containing parallax data for the stars in common with the Tycho catalogue (ESA 1997), provides the astrometric values needed for our analysis. In addition, we have used a radial velocity compilation taken from the literature. With all these data, we have complete information of the phase space for a significant sample of the stellar population in the Monoceros region.
The main objective of our paper is the search for stellar groupings in the phase space, for which we make use of the methodology proposed by Alfaro & González (2016), which has been applied to the analysis of the Galactic structure in the directions of the cluster NGC 2264 (González & Alfaro 2017) and the Cygnus OB1 association (Costado et al. 2017). In this last work, the authors found evidences of two structures with different distance and radial-velocity values, associated with two main Hα shells included in the OB association. In the first work, apart from a high degree of internal structure, the authors found a group of giant stars with velocities close to 75 km s−1, which may be associated with the Outer arm or with the Monoceros Ring. We analyse a bigger area in this paper, including the area of the cluster NGC 2244, the central object of the Monoceros OB2 association (Mon OB2). We now aim to characterize the phase-space subspace (radial velocity and distance) to try to discover a new vision of the kinematic structure in this interesting area of the third Galactic quadrant.
The paper is therefore structured as follows. In Section 2, we give a summary of some previous studies devoted to the Monoceros region, and to the clusters and associations that compose it. In Section 3, we describe the stellar objects in the studied area and how the data were selected. The study of the kinematic and spatial structure in the region is discussed in Section 4. Lastly, in Section 5, we summarize the main conclusions of this work.
2 THE MONOCEROS STAR-FORMING REGION: ANTECEDENTS AND STELLAR POPULATIONS
The Monoceros star-forming region is located in the third Galactic quadrant between the Galactic coordinates l = 200–210 °; b = −3 to +3 °. This area contains a good sample of young clusters, H ii regions, dust clouds and emission nebulae, the typical elements of an active star-forming region. In Hα, the emission is dominated by the Rosette Nebula (negative latitude), a bright region, in the central part of which is located the cluster NGC 2244. To the northeast of the Rosetta nebula a region of low density of Hα emission can be seen, known as the Monoceros’ Loop (Mon Loop), with an angular size of 3.5°, which, together with a heterogeneous population of massive stars distributed in the area, constitutes the Mon OB2 association. The young open cluster NGC 2244 is located at α2000 = 06h31m55s, δ2000 = +04°56΄30″ (l = 206.306°, b = −2.072° in Galactic coordinates). The cluster is 8 Myr old and appears to be placed at a distance of 1.4 kpc with a non-negligible reddening E(B − V) of 0.463.
To the North, in positive latitudes, NGC 2264 dominates the Monoceros OB1 nebula (Mon OB1), a big and diffuse H ii region associated with the cluster. NGC 2264 is situated in the Equatorial coordinates α2000 = 06h40m58s, δ2000 = +09°53΄42″ (l = 202.936°, b = +2.196° in Galactic coordinates), with an age of 9 Myr at a distance of 667 pc and reddening E(B − V) of 0.051. All these values for both clusters are taken from the WEBDA Database. The Monoceros region is an excellent place to study the connection between the young stellar population and the associated inter-stellar medium around it, which still remains in the region after the star formation bursts. It can be seen a schematic map of the region containing the main components in the Fig. 1.
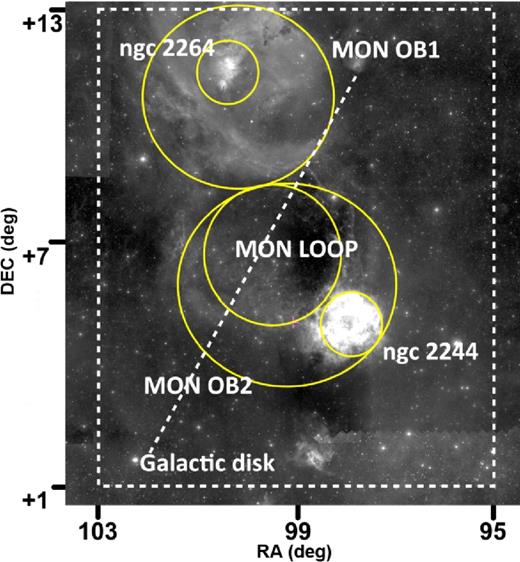
Composition of DSS9 image showing the most representative objects of the region using yellow circles. The dashed white rectangle is the analysed area of 8 × 12 deg2 centred on RA = 99.0 deg, DEC = +7.0 deg, and the discontinuous line represents the Galactic disc.
Previous papers studying the Monoceros region or the main clusters inside the area are diverse, from studies of extinction or cluster membership to studies of cluster distance and age, as well as its local or global kinematic structure. Regarding extinction in the Monoceros area, Turner (1976) did not find evidence of local anomalies, obtaining a value of R = 3.2 ± 0.2. Pérez, Thé & Westerlund (1987) found a very similar value (R = 3.35), suggesting a quite homogeneous nebulosity. With respect to cluster membership, to list the stars in our file as members of the different stellar clusters, we have used the works of Ogura & Ishida (1981), Marschall, Van Altena & Chiu (1982), Flaccomio et al. (1999), Chen, de Grijs & Zhao (2007), Kaltcheva, Kuchera & Hathaway (2010), and Turner (2012).
These studies show considerable differences for Mon OB2, specifically in the study of the distance of the cluster NGC 2244, unlike the distance of NGC 2264 (Mon OB1), which is better established at around 750–850 pc (Flaccomio et al. 1999; Kaltcheva et al. 2010; Turner 2012). However, NGC 2264 seems to be formed by two subgroups at different distances and ages, suggesting the presence of two different mechanisms of formation (Flaccomio et al. 1999). In the line of vision of the Mon OB1 association, there is a B-type star that actually is better considered to belong to Mon OB2 at around 800 pc (Turner 2012), and an interstellar medium located at about 500 pc with more reddened stars than the rest of the area (Kaltcheva et al. 2010; Turner 2012)
In contrast, the distance value established for NGC 2244 is not so unanimous, for example the value of 1.26 kpc given by Kaltcheva et al. (2010) compared to that of 1.67 kpc given by Pérez et al. (1987). The number of OB stars in the area of Mon OB2 is greater than in Mon OB1 (Pérez et al. 1987), and the most massive stars located randomly in the region are considered field stars (Kaltcheva et al. 2010). In the area of Mon OB2, there are three groups of different ages and distances: the youngest group corresponds to the cluster NGC 2244 (the compact nucleus of Mon OB2); the oldest group is located at the edges of the association (Mon Loop) and also in the southern part located around CV Mon; and the intermediate group is dispersed between the two previous groups (Turner 1976; Kaltcheva et al. 2010). Specifically, the Rosette Nebula (NGC 2244) is a cone or cylinder penetrating the HII region and there is no source in the foreground part (Li 2005). Inside this area, there are three different zones of CO emission associated with three different star formation evolutionary states of formation. The region shows a velocity gradient along the Galactic longitude, overimposed on a clumpy velocity distribution (Blitz & Thaddeus 1980), being the maximum extension of Mon OB2 approximately of 100 pc along the Galactic plane with negative latitudes.
Lastly, we want to mention the detailed work of Tobin and collaborators (Furész et al. 2006; Tobin et al. 2015) on the kinematic structure of the cluster NGC 2264. They obtain the radial velocity measurements of almost 700 stars, with more than 400 catalogued as members in an area of 1 deg2. They found a correlation between the cluster members and the molecular gas around them, showing groups with different velocities inside. The same was found by González & Alfaro (2017), where they, studying the same area, obtain four distinct structures corresponding to the cluster NGC 2264, the northern and southern parts corresponding to the old and young population, respectively, and another structure much farther away with the highest radial velocities.
3 KINEMATIC AND DISTANCE DATA
We study the spatial and kinematic structures of the Monoceros region. For this, we use the first Gaia release (DR1) (Gaia Collaboration et al. 2017), specifically the distance calculated by Astraatmadja & Bailer-Jones (2017), and the radial velocity data compiled from the literature, because in the first release Gaia does not provide radial velocity data. Therefore, we looked for radial velocity data in two big data bases: VIZIER1 and WEBDA2. As the WEBDA information is ordered by clusters, first we look at what object of this class can be located in the studied area, which is centred on the equatorial coordinates RA = 99.0 deg, DEC = +7.0 deg using a box of 8×12 deg2, the white square in Fig. 1.
3.1 Stellar clusters in the analysed area
In the aforementioned area, 38 stellar clusters are catalogued in the WEBDA data base, but only nine of them have radial velocity value measured. The schematic information taken from WEBDA about these nine objects can be found in Table 1. The name, Galactic and Equatorial coordinates, distance dist, reddening E(B − V), log age, and the RV mean values given by WEBDA and by SIMBAD, and the number of stars compiled by cluster are shown.
Data of the stellar clusters present in the analysed area with radial velocity data ordered by Galactic latitude. The coordinates, the distance, reddening, age, and RV1 are taken from the WEBDA data base, the RV2 value is given by the SIMBAD service and the number of compiled stars.
| Cluster | l | b | RA | DEC | dist | E(B-V) | Log Age | RV1 | RV2 | N. stars |
|---|---|---|---|---|---|---|---|---|---|---|
| (deg) | (deg) | (h:m:s) | (d:m:s) | (pc) | (mag) | (km s−1) | (km s−1) | |||
| ASCC 26 | 206.350 | 3.060 | 06:50:24 | +07:15:00 | 800 | 0.130 | 8.090 | 8.00 | – | 1 |
| NGC 2264 | 202.936 | 2.196 | 06:40:58 | +09:53:42 | 667 | 0.051 | 6.954 | 25.50 | 17.68 | 71 |
| NGC 2251 | 203.577 | 0.106 | 06:34:38 | +08:22:00 | 1329 | 0.186 | 8.427 | 24.70 | −16.00 | 6 |
| Collinder 95 | 201.810 | 0.030 | 06:31:04 | +09:53:59 | 556 | 0.100 | 8.360 | −11.00 | −11.00 | 1 |
| NGC 2270 | 208.980 | −0.070 | 06:43:58 | +03:28:48 | 1400 | 0.060 | 8.640 | 40.00 | 40.00 | 2 |
| Collinder 106 | 206.030 | −0.410 | 06:37:22 | +05:56:59 | 1600 | 0.230 | 6.740 | 28.72 | 28.72 | 14 |
| vdBergh 1 | 208.555 | −1.808 | 06:37:00 | +03:04:00 | 1687 | 0.710 | 8.025 | 18.90 | 19.20 | 1 |
| Collinder 110 | 209.649 | −1.978 | 06:38:24 | +02:01:00 | 1950 | 0.500 | 9.150 | 38.70 | 38.70 | 3 |
| NGC 2244 | 206.306 | −2.072 | 06:31:55 | +04:56:30 | 1445 | 0.463 | 6.896 | 36.60 | 26.16 | 105 |
The clusters with lower reddening are NGC 2270 and NGC 2264, and with higher are VdBergh1, Collinder 110, and NGC 2244, the last all situated in the area of Mon OB2 and with negative Galactic latitudes. We were able to make the same conclusion with respect to the distance, because the distant clusters are located in negative latitudes. The oldest cluster is Collinder 110 with an age of 1.4 Gyr, and the youngest are Collinder 106, NGC 2244 and NGC 2264, with an age of 5.5, 7.8, and 9 Myr, respectively, according to the WEBDA database. But some previous studies of NGC 2244 give a smaller value of 2–4 Myr (Ogura & Ishida 1981; Chen et al. 2007; Bruhweiler et al. 2010; Kaltcheva et al. 2010). There is the same problem for NGC 2264 because previous works calculate an age between 1 and 6 Myr (Flaccomio et al. 1999; Turner 2012). In short, the clusters situated in negative Galactic latitudes are older, more distant and with more reddening than in positive latitudes.
The typical age for an association is about 10 Myr. In this sense, the older clusters could not belong to the Monoceros star-forming region. The younger clusters that could form part of Monoceros are NGC 2264 (belonging to Mon OB1), NGC 2244 (nucleus of Rosette Nebula and part of Mon OB2) and Collinder 106 (located in Mon Loop).
Regarding the RV values, there are differences between the WEBDA and SIMBAD data bases for NGC 2264, NGC 2244 and, specifically, for NGC 2251. The RV values for these clusters for WEBDA (RV1) are taken from Rastorguev (1999), while for SIMBAD from Kharchenko et al. (2005).
3.2 Radial velocity measurements
For the RV data, we used a box of 8×12 deg2 centred on the coordinates RA = 99.0 deg, DEC = +7.0 deg to conduct a data search. This huge area was chosen in order to be completely sure that the Monoceros star-forming region is well covered. Eight independent catalogues were used from the VIZIER service: Barbier-Brossat & Figon (2000), Abt & Biggs (1972), Evans (1967), Fehrenbach et al. (1996), Wilson (1953), Anderson & Francis (2012), Gontcharov (2006), and Huang & Gies (2006). The basic data such as the equatorial coordinates, the HD number, the RV measurement and the spectral type (SpT), for the stars contained in the area in each catalogue were downloaded. We did a matching using the HD number if available or the equatorial coordinates.
We would like to mention that the radial velocity data of Tobin et al. (2015) are not included in our sample, because they are limited to a smaller region and only centred on the cluster NGC 2264, and which were analysed previously in detail by González & Alfaro (2017). Another reason is that the data from Tobin et al. introduce a bias in the sampling density, of a high concentration in a small area versus a sparse distribution for the rest of the sample compiled from literature. If we were to consider the data from Tobin, we would be giving more weight to the area of NGC 2264, instead of looking for a homogeneous sample, which is precisely what we are trying to obtain for this analysis.
We also carried out a search for the RV data of the clusters located in the Monoceros area from the WEBDA service. We generated a file containing a total of 412 stars in the area mixing the stars found in the WEBDA and VIZIER data bases. Although the differences between the compiled RV values for each star are not high for most of the stars, we prefer to calculate the median as representative of the RV data. We have also compiled the kind of object and SpT from the SIMBAD service3 for each star in our file, which can be catalogued as: 65 per cent single stars, 5 per cent binaries, and the remaining 30 per cent other types such as pulsating, variable, high proper motion, emission-line, carbon, blue supergiant or Be stars. Due to the binary character or to the high rotational velocity of some stars, the RV uncertainty is large and variable. Each catalogue has a specific internal error, sometimes given by a code letter, what makes it impossible to obtain an error for the compiled RV data.
Finally, if we do a study of the velocities for the stars that we have catalogued as members of NGC 2244 and NGC 2264 by several authors, we have 51 stars listed as members for NGC 2244 and its mean RV value is 35.85 km s−1. If we make the same calculations for NGC 2264, the median RV of cluster members is 16.94 km s−1.
3.3 Photometric and TGAS distances
It is difficult to find a homogeneous catalogue of individual stellar distances for objects in the sampled region. Up to a certain limit of magnitude, which includes the majority of stars in our sample, TGAS (Gaia Collaboration et al. 2017) is the most complete and up-to-date we have at our disposal. 212 stars are common to our RV compiled file of the region. Although TGAS does not provide distances but parallaxes, we have calculated the distance using the TGAS parallax (hereinafter PLX). Besides, Astraatmadja & Bailer-Jones (2017, hereinafter A&B) have estimated the distances from the Gaia parallaxes using a Bayesian inference model for different priors and uncertainties.
We want to emphasize that Astraatmadja & Bailer-Jones (2017) have another catalogue of calculated distances taking into account the systematic error of Gaia's parallax but, as they admit, this error may be overestimated. Nonetheless, we have calculated for our compiled file the differences between the distances of these two catalogues, with and without taking into account the systematic error, and they are practically equal up to about 1000 pc, the distances being calculated taking into account the systematic error greater than without it for values higher than 1000 pc. We therefore adopted the distance catalogue from Astraatmadja & Bailer-Jones (2017), which does not take into account the systematic error of parallax, because, as they state, this error could introduce more uncertainty for the values.
Kaltcheva et al. (2010) calculated the individual distances (hereinafter KAL) inside the field of Monoceros using Stromgren photometry. There are 49 stars in common between both catalogues, KAL and TGAS, in our RV file. Fig. 2 shows the differences (vertical axis) between the photometric KAL distances (horizontal axis) and those derived directly from TGAS parallaxes (red points), and those of A&B (blue triangles) without the inclusion of any systematic error. Making a comparison between the values of distance KAL, PLX, and A&B, the median difference is KAL−PLX ≈ 190 pc and KAL−A&B ≈ 330 pc. But the most curious is that the values are similar down to about 850 pc, being Gaia values (PLX and A&B) lower than those of Kaltcheva et al. (2010). But from that distance, which we could call critical, the difference increases, with KAL being greater than the other distances (Fig. 2).

Differences in distance versus KAL distance in parsecs (pc). The red circles correspond to the KAL−PLX difference and the blue triangles to the KAL−A&B difference.
While the distances derived from the TGAS catalogue (PLX and A&B) show, among themselves, small systematic differences except in a couple of cases, the comparison with the KAL distances indicate a prominent systematic effect for KAL values greater then 850 pc. This fact is prevalent in the analysis of the Gaia parallaxes carried out by Arenou et al. (2017) and indicates that, in the Monoceros region, parallax values are overestimated (see their fig. 30). This figure represents the sky distribution of open clusters more distant than 1000 pc: the overestimated parallaxes in red and the underestimated ones in blue. Our region is not drawn in their figure but we can infer its position in the red area. The stellar clusters NGC 2264 and NGC 2244 do not appear in the figure from Arenou et al. (2017), which would indicate that its TGAS estimated distance is less than 1000 pc. If we directly compare the parallax value derived from Kaltcheva et al. (2010) and the TGAS catalogue, we obtain, for stars with distance PLX > 1000 pc, that the median difference in parallaxes is -0.168 ± 0.069 mas for the Monoceros region, a similar value to that found by Arenou et al. (2017) of -0.16 ± 0.04 mas for l > 200°.
Despite the knowledge that this difference exists, we adopt the A&B values as distance data because it is a homogenous catalogue with a greater number of stars to analyse. In other words, we have a higher density of stars in the region than using the KAL distance.
Finally, in Table 3 we can see the compiled RV data and its median value calculated for each star, as well as our identification ID, the HD, and Hipparcos numbers when available, (RA, DEC) coordinates, and the A&B distance. The complete table is available online.
4 PHASE-SPACE STRUCTURE
In this section of the paper, we will examine whether the star-forming region of Monoceros, formed by the two associations, Mon OB1 and Mon OB2, shows some structure in the phase space. The dynamical state of a system is defined by the six components of its phase space, three velocities and three positions. In our case, we only have a subspace of the phase space available formed by the spatial coordinates (RA, DEC) and the radial velocity (RV) or the TGAS distance performed by Astraatmadja & Bailer-Jones (2017)
To look for the segregated groups in the RV data and distance values, we used a method developed by Alfaro & González (2016) and tested in González & Alfaro (2017) and Costado et al. (2017). To summarize, the methodology is based on calculating the kinematic index (Λ) and the Spectrum of Kinematic Groupings (SKG). After sorting the data by the analysed variable (RV or distance), the sample is divided into bins of equal size (|$\sqrt{N}$| is initially suggested). Then a Minimum Spanning Tree (MST) is obtained for each bin, whose edge-length median is compared with that obtained for a random selection, with the same bin size, taken from the full sample. The quotient between both lengths is called Λ, and it is expected that for RV or distance bins with high spatial concentration, this value would be clearly greater than 1. Two parameters fix the analysis: bin size (b) and step (s), the latter meaning the shift, in the sorted sample, between two consecutive bins.
For this particular case, we have chosen s = 1, so the coverage is the densest possible, and b will be a value close enough to the square root of the total number of objects, but increased to enhance the internal precision of Λ without losing the information contained in the kinematic index, a balanced choice between precision and uncertainty. We will consider that we have a segregated group when the kinematic index less twice its dispersion is greater than unity. We obtain the kinematic segregation spectrum of a region plotting the kinematic index versus the ordered data.
4.1 The kinematic structure
Using the aforementioned methodology (b = 23, s = 1), we calculated the kinematic spectrum of all the RV data, which is shown in the top left panel of Fig. 3, where the error bars represent the dispersion of each bin, and red dots are the segregated bins. There are four clear groups of segregated bins, with associated RV median of −15.50 km s−1 (group 4), 20.00 km s−1 (group 3), 37.63 km s−1 (group 2), and 46.70 km s−1 (group 1). There is another peak in this kinematic spectrum, close to RV values of 32.0 km s−1, but its kinematic index is not statistically significant, according to the criterion, to have a segregated group. The velocity difference between group 4 and the other significant groupings is larger than 30.0 km s−1, suggesting that this stellar concentration is not part of the Monoceros association but a foreground population.
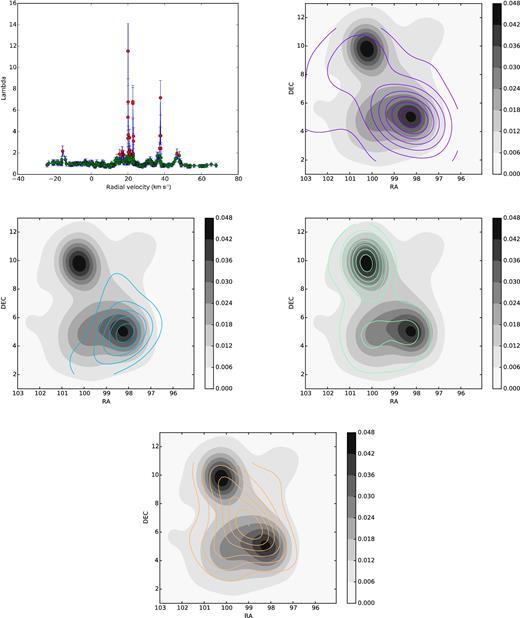
Top left: Λ parameter versus RV (km s−1) showing in red the significant segregated groups around the RV median values of −15.50 (group 4), 20.00 (group 3), 37.63 (group 2), and 46.70 (group 1) km s−1. The next plots show the iso-density map of the whole sample in grey-scale with the iso-density contours of each segregated grouping: group 1 (top right), group 2 (middle left), group 3 (middle right), and group 4 (bottom). The centre of group 4 (RV −15.50) is situated in the Galactic disc and its form of cross is in the direction of the disc and perpendicular to it. Group 1 follows the perpendicular direction to the disc with the centre situated in the line of sight of NGC 2244. The central places of groups 2 and 3 correspond to the clusters NGC 2264 and NGC 2244, respectively.
Fig. 3 shows the coloured spatial iso-density contours. Each colour represents a different phase-space group, drawn over the spatial density distribution of the whole sample as a grey map, which shows a concentrated distribution associated with the Monoceros region. Group 1 is represented in violet (top right); group 2 is shown in cyan (middle left); group 3 is drawn in green (middle right); and group 4 is shown in orange (bottom). We would like to note that the methodology applied to detect the segregated groupings in the phase-space subspace does not remove the possible outliers. Therefore, stars within the same radial velocity, but separated from the spatial concentration nucleus, could be contaminating the detected groupings.
We can make a different study of these RV groups from the point of view of members or not of the clusters and their spectral type. The data of these groups are gathered in the table 2. Group 1 has 23 stars of AKM spectral types, of which 2 are catalogued as members of NGC 2264, 7 are of NGC 2244 and 1 more of Collinder 110. For group 2, we have 28 stars, mostly OB spectral type, 12 of which are catalogued as members of NGC 2244 and two of Collinder 110. Group 3 has 101 stars of spectral types OB, where 45 per cent of the stars belong to Mon OB1 (15 stars members of NGC 2264), 30 per cent are in the area of Mon OB2, where only 8 stars are listed as members of NGC 2244. Finally, group 4 consists of 23 stars of types AFK and distributed throughout the total zone. This last group can be identified as stars near us, perhaps being part of our Local arm and which are located on the Galactic disc. Group 3, due to its characteristics, could be associated with the NGC 2264 cluster and part of the Mon OB2 association. Group 2 can be identified with the cluster NGC 2244, which could extend to the Perseus arm, which could be group 1, since they have similar speeds, although this should be studied in depth.
4.2 The TGAS distance structure
Now, if we apply the SKG methodology to the 212 stars that have A&B distances using parameters b = 17 and s = 1, we obtain that they are distributed into three spatial groupings, as we can see in Fig. 4 (top left). The rest of the plots in Fig. 4 correspond to the iso-contours of each segregated group, as in Fig. 3. The data of these groups are gathered in Table 2.
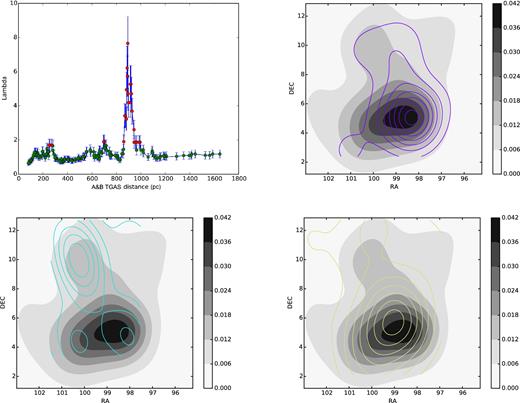
Top left: |$\tilde{\Lambda }$| parameter versus TGAS distance in parsecs (pc) calculated by Astraatmadja & Bailer-Jones (2017) showing in red the three significant segregated groups around the distance median values of 906.69 (group A), 698.80 (group B), and 263.35 (group C) pc. The next plots show the iso-density map of the whole sample in grey-scale with the iso-density contours of each segregated grouping: group A (top right), group B (bottom left), and group C ( bottom right). Group A represents the NGC 2244 cluster, group B is the Mon OB1 plus Mon OB2 associations and group C corresponds to the Local arm.
The centroid, RV median, or A&B distance median, number of stars of segregated groups and the cluster closer to the centre for each grouping detected by the SKG method.
| Group | RA | DEC | RV or Dist | N. stars | Localization |
|---|---|---|---|---|---|
| (h:m:s) | (d:m:s) | (km s−1) or (pc) | |||
| 1 | 06:34:08.0 | +05:06:58.9 | 46.70 | 23 | – |
| 2 | 06:33:12.6 | +05:01:47.8 | 37.63 | 28 | NGC 2244 |
| 3 | 06:40:50.6 | +09:15:31.6 | 20.00 | 101 | NGC 2264 |
| 4 | 06:37:48.0 | +06:29:26.4 | −15.50 | 23 | Local arm |
| A | 06:34:04.0 | +05:13:26.0 | 906.69 | 40 | NGC 2244 |
| B | 06:40:37.9 | +09:07:18.0 | 698.80 | 18 | NGC 2264 |
| C | 06:37:44.9 | +06:03:24.5 | 263.35 | 20 | Local arm |
The compiled data of each star. The columns RV + catalogue number are taken from VIZIER (references below) and the column WEBDA is the median value calculated using all measurements taken from WEBDA data base (references below for each cluster). We also show our identification number, the Equatorial and Galactic coordinates, HD number, and the total RV median value, which we will use in the kinematic analysis, and the distance calculated by Astraatmadja & Bailer-Jones (2017) using Gaia parallax. The full table is available online.
| ID | HD | HIP | RA | DEC | RV1 | RV2 | RV3 | RV4 | RV5 | RV6 | RV7 | RV8 | WEBDA9 | MEDIAN | |$A\&B$| distance |
|---|---|---|---|---|---|---|---|---|---|---|---|---|---|---|---|
| (deg) | (deg) | (km s−1) | (km s−1) | (km s−1) | (km s−1) | (km s−1) | (km s−1) | (km s−1) | (km s−1) | (km s−1) | (km s−1) | (pc) | |||
| 1050 | 47662 | 31917 | 100.056 | 10.441 | −999.9 | −999.9 | −999.9 | −999.9 | −999.9 | −9.0 | −999.9 | −999.9 | −999.9 | −9.0 | −999.9 |
| 1051 | 47732 | 31939 | 100.119 | 9.818 | 17.5 | −999.9 | −999.9 | −999.9 | 18.0 | 7.0 | −999.9 | −999.9 | 64.37 | 17.75 | −999.9 |
| 1052 | 47754 | 31951 | 100.152 | 10.392 | −999.9 | −999.9 | −999.9 | −999.9 | −999.9 | −3.0 | −999.9 | −999.9 | −999.9 | −3.0 | −999.9 |
| 1053 | 261783 | −999 | 100.155 | 9.595 | −999.9 | −3.0 | −999.9 | −999.9 | −999.9 | −999.9 | −999.9 | −999.9 | 14.6 | 5.8 | 587.35 |
| 1054 | 261782 | −999 | 100.160 | 9.962 | −999.9 | 14.0 | −999.9 | −999.9 | −999.9 | −999.9 | −999.9 | −999.9 | 27.01 | 20.505 | 832.75 |
| 1055 | 47777 | 31955 | 100.176 | 9.656 | 13.0 | −38.0 | 13.0 | −999.9 | 6.0 | 13.0 | −999.9 | −999.9 | 30.19 | 13.0 | −999.9 |
| 1056 | 261810 | −999 | 100.180 | 9.767 | 20.0 | 26.0 | 20.0 | −999.9 | 13.0 | −999.9 | −999.9 | −999.9 | 29.2 | 20.0 | 661.86 |
| 1057 | 261841 | −999 | 100.204 | 9.862 | 33.0 | −999.9 | −999.9 | −999.9 | −999.9 | −999.9 | −999.9 | −999.9 | −999.9 | 33.0 | −999.9 |
| 1058 | 48012 | −999 | 100.213 | 10.029 | 20.0 | 6.5 | −999.9 | −999.9 | 20.0 | −999.9 | −999.9 | −999.9 | 10.3 | 15.15 | 681.96 |
| 1059 | 261878 | −999 | 100.215 | 9.864 | 19.0 | −999.9 | −999.9 | −999.9 | 15.0 | −999.9 | −999.9 | −999.9 | 26.4 | 19.0 | 683.38 |
| 1060 | −999 | −999 | 100.230 | 12.582 | 60.5 | −999.9 | −999.9 | −999.9 | −999.9 | −999.9 | −999.9 | −999.9 | −999.9 | 60.5 | −999.9 |
| ... | |||||||||||||||
| 2020 | 46055 | 31089 | 97.858 | 7.822 | −999.9 | −999.9 | −999.9 | −999.9 | −999.9 | 12.1 | 12.1 | −999.9 | −999.9 | 12.1 | −999.9 |
| 2021 | 46056 | −999 | 97.837 | 4.835 | 21.5 | 45.0 | 21.0 | −999.9 | 18.0 | −999.9 | −999.9 | −999.9 | 31.485 | 21.5 | 1189.78 |
| 2022 | 46090 | 31083 | 97.839 | 2.911 | −999.9 | −999.9 | −999.9 | −999.9 | −999.9 | 5.4 | 5.4 | −999.9 | −999.9 | 5.4 | 31.11 |
| 2023 | 46105 | 31110 | 97.919 | 5.769 | −999.9 | −999.9 | −999.9 | −999.9 | −999.9 | 19.0 | 19.0 | −999.9 | −999.9 | 19.0 | −999.9 |
| 2024 | 46106 | 31106 | 97.910 | 5.027 | 21.5 | 27.0 | 22.0 | 4.0 | 13.0 | 21.5 | 21.5 | −999.9 | 31.1 | 21.5 | 799.79 |
| 2025 | 46107 | −999 | 97.901 | 4.933 | 30.0 | 29.5 | −999.9 | −999.9 | 30.0 | −999.9 | −999.9 | −999.9 | 29.5 | 29.75 | 383.79 |
| 2026 | 46122 | 31118 | 97.942 | 6.785 | −8.0 | −8.0 | −999.9 | −999.9 | −8.0 | −12.5 | −12.5 | −999.9 | −999.9 | −8.0 | 108.93 |
| 2027 | 46149 | 31128 | 97.969 | 5.033 | 36.6 | 38.9 | 36.5 | −999.9 | 33.0 | 36.6 | 36.6 | −999.9 | 41.17 | 36.6 | 1106.42 |
| 2028 | 46150 | 31130 | 97.981 | 4.943 | 35.6 | 35.9 | −999.9 | −999.9 | 36.3 | 31.83 | 35.6 | −999.9 | 32.22 | 35.6 | 899.42 |
| 2029 | 46179 | 31147 | 98.030 | 6.036 | 23.0 | 23.0 | 23.0 | 23.0 | −999.9 | 23.0 | 23.0 | −999.9 | −999.9 | 23.0 | 256.56 |
| 2030 | 46180 | −999 | 98.030 | 4.971 | −999.99 | −1.0 | −999.9 | −999.9 | −999.9 | −999.9 | −999.9 | −999.9 | −1.0 | −1.0 | −999.9 |
Notes.1[Barbier-Brossat & Figon (2000); 2[Abt & Biggs (1972); 3[Evans (1967); 4[Fehrenbach et al. (1996); 5[Wilson (1953); 6[Anderson & Francis (2012); 7[Gontcharov (2006); 8[Huang & Gies (2006); 9[For NGC 2244: Plaskett (1924); Hayford (1932); Feast, Thackeray & Wesselink (1957); Petrie & Pearce (1961); Conti, Leep & Lorre (1977); Garmany, Conti & Massey (1980); Liu, Janes & Bania (1989); Liu, Janes & Bania (1991); For NGC 2251: van Rensbergen, Hensberge & van den Heuvel (1978); Glushkova & Rastorguev (1991); Mermilliod, Mayor & Udry (2008); For Collinder 110: Pancino et al. (2010); For vd Bergh 1: Barnes, Moffet & Slovak (1988); Metzger, Caldwell & Schechter (1991); Gorynya et al. (1992); Gieren et al. (1996); Mermilliod et al. (2008); For NGC 2264: Plaskett (1924); Frost, Barrett & Struve (1926); Plaskett & Pearce (1935); Pearce & Petrie (1951); Petrie & Pearce (1961); Bearsdley et al. (1969); Conti et al. (1977); Beardsley & Jacobsen (1978); Bohannan & Garmany (1978); Garmany et al. (1980); Liu et al. (1989); Glushkova & Rastorguev (1991); Liu et al. (1991); Padgett & Stapelfeldt (1994); Gies et al. (1997); King (1998); Soderblom et al. (1999); Mermilliod et al. (2008)
The median distance for the groups C, B, A are 263.35, 698.80, and 906.69 pc, respectively. Group A is formed by 40 OB-type stars, of which 30 per cent belong to NGC 2244 and the rest are distributed in the zone. Its range of distances goes from 808 to 1121 pc. Group B, at an intermediate distance, consists of 18 BA-type stars, of which 10 belong to NGC 2264 (6) and Mon OB2 (4), and their distances range from 661 to 745 pc. Finally, the closest to us, group C, is composed of 20 stars where more than half are situated at the disc and AFGK types, with a range of distances between 227 and 313 pc. These groups could be identified as a Local Group (group C), the cluster NGC 2264 together with Mon OB2 (group B) and a third structure (group A), wider than the others which could correspond to Mon OB1 and to its associated cluster NGC 2244.
The fact that NGC 2264 and Mon OB2 were at the same distance is precisely something stated by Turner (2012). We obtain a similar scheme for Mon OB1 and NGC 2244, in good agreement with Kaltcheva et al. (2010). NGC 2244 is around 900 pc and the rest of the stars of the group between 800 and 1100 pc, which are perhaps forming a cylinder with a compact core and the rest of the stars around away, as Li (2005) concluded.
5 CONCLUSIONS
The radial velocities of 412 stars in the Monoceros region have been compiled from eight different and primary catalogues. Similarly, 212 stars with distances determined by Astraatmadja & Bailer-Jones (2017) have been used to analyse the spatial structure of the region along the line of sight. The application of the SKG method to the RV and distance variables suggests the presence of four groupings in radial velocity and three in distance, statistically significant, as shown in Figs. 3 and 4, and summarized in Table 2.
The groupings corresponding to the three highest central RVs can be associated with NGC 2264, NGC 2244 and, according to the Galactic rotation curve (González & Alfaro 2017), with the Perseus arm, respectively. The SKG spectrum around RV = 20 km s−1 (NGC 2264) shows a high degree of kinematic substructure, as has already been evidenced in previous works (Furész et al. 2006; Tobin et al. 2015; González & Alfaro 2017), which could correspond to different bursts, of different ages, in a process of star formation propagation in the region along the declination axis (Venuti et al. 2018). The estimated distance, from our analysis, for this region of star formation is centred on 700 pc (Fig. 4) in good agreement with previous results (Flaccomio et al. 1999; Kaltcheva et al. 2010; Turner 2012).
The velocity bin centred at 37 km s−1 is spatially associated with NGC 2244 as the core of Rosette Nebula. The analysis of the 212 stars with A&B distances shows that around 900 pc there is an elongated region along the line of sight that would correspond to the stellar distribution within the Mon OB2 association, delineating several internal concentrations. The outermost part of this region could be touching the inner edge of the Perseus arm whose stellar component would move with a RV close to 47 km s−1. It should be noted here that the distances determined for NGC 2244, in this work, are already affected by the bias observed in the TGAS parallaxes and that therefore they would be located at a greater distance if we anchored them to the estimated photometric distances.
The fourth group in velocity shows a negative RV (−15.5 km s−1), which indicates that we are observing the peculiar velocity of a stellar grouping near the Sun. One of the significant groupings in distance, located at about 260 pc from the Sun, could represent the spatial counterpart of this kinematic group, either within the Local arm, or in a spur that would connect with the Perseus arm, in this direction of the Galaxy, crossing the inter-arm region.
The comparison between the TGAS trigonometric parallaxes and the photometric ones derived by Kaltcheva et al. (2010) for 49 stars in common, show systematic differences for objects with distances greater than 1000 pc, which would suggest that TGAS parallaxes could be overestimated for this Galactic disc location. Other regions of the Galactic disc, defined by the location of open clusters, show the opposite effect, a parallax underestimation (Arenou et al. 2017). For NGC 2244, what is more surprising is the high value of the relative difference in distance between both estimations.
Acknowledgements
We warmly thank to Richard Parker, paper's referee, by his kind and useful comments that helped to improve this paper. This work was funding by the Spanish Ministerio de Economía y Competitividad, through grant AYA2016-75931. This research has made use of the SIMBAD data base, the VizieR catalogue access tool and the Aladin sky atlas, developed at CDS, Strasbourg, France. Also, this research has made use of the WEBDA data base, operated at the Institute for Astronomy of the University of Vienna. This work makes use of EURO-VO software, tools, or services. The EURO-VO has been funded by the European Commission through contracts RI031675 (DCA) and 011892 (VO-TECH) under the 6th Framework Program and contracts 212104 (AIDA), 261541 (VO-ICE), 312559 (CoSADIE) under the 7th Framework Program. This publication makes use of data products from the Wide-field Infrared Survey Explorer, which is a joint project of the University of California, Los Angeles, and the Jet Propulsion Laboratory/California Institute of Technology, funded by the National Aeronautics and Space Administration.
Footnotes
REFERENCES
SUPPORTING INFORMATION
Supplementary data are available at MNRAS online.
Table 3. The compiled data of each star.
Please note: Oxford University Press is not responsible for the content or functionality of any supporting materials supplied by the authors. Any queries (other than missing material) should be directed to the corresponding author for the article.
