-
PDF
- Split View
-
Views
-
Cite
Cite
Christina Hedges, Simon Hodgkin, Grant Kennedy, Discovery of new dipper stars with K2: a window into the inner disc region of T Tauri stars, Monthly Notices of the Royal Astronomical Society, Volume 476, Issue 3, May 2018, Pages 2968–2998, https://doi.org/10.1093/mnras/sty328
Close - Share Icon Share
Abstract
In recent years, a new class of young stellar object (YSO) has been defined, referred to as dippers, where large transient drops in flux are observed. These dips are too large to be attributed to stellar variability, last from hours to days and can reduce the flux of a star by 10–50 per cent. This variability has been attributed to occultations by warps or accretion columns near the inner edge of circumstellar discs. Here, we present 95 dippers in the Upper Scorpius association and ρ Ophiuchus cloud complex found in K2 Campaign 2 data using supervised machine learning with a random forest classifier. We also present 30 YSOs that exhibit brightening events on the order of days, known as bursters. Not all dippers and bursters are known members, but all exhibit infrared excesses and are consistent with belonging to either of the two young star-forming regions. We find 21.0 ± 5.5 per cent of stars with discs are dippers for both regions combined. Our entire dipper sample consists only of late-type (KM) stars, but we show that biases limit dipper discovery for earlier spectral types. Using the dipper properties as a proxy, we find that the temperature at the inner disc edge is consistent with interferometric results for similar and earlier type stars.
1 INTRODUCTION
Young stellar objects (YSOs) are known to exhibit a wide range of variability based on many astrophysical processes such as stellar spots, accretion bursts, hot spots, and occultations by circumstellar discs [see Herbst (2012) for a discussion of variable YSOs]. Of these YSOs, a new class has emerged over the past few years, known as ‘dippers’ (e.g. Alencar et al. 2010; Morales-Caldern et al. 2011; Cody et al. 2014; Ansdell et al. 2016a). These are characterized as classical T Tauri stars (CTTS) with largely flat light curves and sharp, short duration dips. An example of a dipper is shown in Fig. 1.

An example of a star in K2 C02 exhibiting the dipper phenomenon. Notable features include the magnitude of the dips, the periodicity of the events and the changing dip depth over time. Some dippers are aperiodic where either there is no clear period or the events stop occurring.
The dipper phenomenon is characterized by the depth of the occultations (10–50 per cent), the reoccurrence of similar events on short time-scales (from hours to days), irregularity in dip depth and changes in dip shape as a function of time. The dip depth can vary greatly in the light curves of individual objects, suggesting the material blocking the stellar light is depleted and replenished regularly (see Fig. 1).
The stochastic and highly variable nature of dippers is attributed to occulting dusty material at the inner edge of the circumstellar disc (Bouvier et al. 1999; Bodman et al. 2017). Extinction differences between the optical and IR have been observed during dips, also suggesting that the dips are caused by dust (see Bouvier et al. 2003; Alencar et al. 2010; McGinnis et al. 2015).
Several works have suggested that the photometric variability of young T Tauri stars can be attributed to warps in the disc at the inner edge and/or accretion streams. Bouvier et al. (2003) suggest this warp would be caused by interactions between an inclined stellar magnetic field (with respect to the stellar rotation axis) and the circumstellar disc. Bodman et al. (2017) suggest the occulting material originates from accretion streams. McGinnis et al. (2015) show the extinction is large and consistent between the optical and IR during dips. Ansdell et al. (2016b) also suggest vortices introduced by Rossby Wave instabilities or inhomogeneities in the disc as mechanisms for creating the dipper phenomenon.
The occurrence rate of dippers (∼20 per cent) is attributed to an inclination effect by McGinnis et al. (2015) and Bodman et al. (2017), whereby the occultations are only observable at inclinations of ∼70°. However, Ansdell et al. (2016a) note that three of the young dipper sample in Upper Sco and ρ Oph with resolvable discs in archival sub-mm data are not at the same inclinations, and are not edge-on. They show on the contrary that one is close to face-on. They suggest that the observed dipper phenomenon is not due to a viewing angle observational bias alone. However, it is possible that these cases have inner discs which are inclined to the observer at a preferential angle for viewing the occultations of material at the inner edge. Several young stars have been observed with inner discs that are inclined with respect to their outer discs (for example Loomis et al. 2017; Thalmann et al. 2015; Marino, Perez & Casassus 2015) and so such behaviour may be expected in young stars.
Dippers have been found to only occur for K and M spectra type stars (Stauffer et al. 2015; Ansdell et al. 2016a). These small, cool stars have a sublimation radius that is close to the stellar surface, allowing dusty material to persist close to the host star (Bodman et al. 2017). This spatial scale is inaccessible to interferometric observations. Dippers therefore offer an alternative way to explore the inner regions of these young stars. Observing dipper stars may lead to new insights in the structure and evolution of inner disc regions.
Dippers have been observed photometrically with Spitzer, CoRoT and K2, which have provided light curves of more than 40 d of continuous monitoring with a cadence of up to 30 min. Cody et al. (2014) present a study of the NGC 2264 cluster using CoRoT and Spitzer, observing both the optical and infrared simultaneously. They measure the number of dippers as a fraction of the disc-bearing population, naming this metric the ‘dipper fraction’. For NGC 2264, the dipper fraction is 21.6 per cent ± 3.7 per cent.
Ansdell et al. (2016b) present 10 new confirmed dipper targets discovered in ρ Oph and Upper Sco with a range of periods and occultation depths. K2 light curves were initially searched by eye resulting in a sample of 100 candidates, which showed evidence of aperiodic or semiperiodic dimming. They then passed their 100 light curves through a high-pass filter with a cut-on frequency of 1 d−1 to suppress periodic variation (e.g. from stellar rotation) and highlight quasi-periodic and aperiodic dimming events. Several metrics were applied to the light curves, resulting in their final sample of 10 dippers. 15 additional dipper candidates were also presented. These were later analysed in Bodman et al. (2017). The metrics presented in Ansdell et al. (2016b) are discussed further in Section 5.2.
In this paper, we present a machine learning (ML) approach to finding dippers in the same K2 Campaign 2 data set (hereafter C02) used by Ansdell et al. (2016b). Our approach is to use the K2 light curves alone to discover and accurately classify dippers. Bloom et al. (2012) have argued that ML approaches have a number of advantages over human-based classification, including (1) speed and throughput, (2) repeatability of the exercise (after tuning or retraining), and (3) reproducibility. These advantages combine to enable possible biases in the ML approach to be tested and mitigated against. In contrast, it can be hard to persuade a human to classify 13 000 light curves by eye for a second time with slightly different selection criteria.
The goals of this paper is to define a reasonably unbiased sample of a class of objects that remains rather poorly defined. ML approaches have been shown to be powerful tools for the classification of objects that appear to be self-similar and distinct from other variable sources (e.g. Richards et al. 2012). We can test the completeness of the machine using a confusion matrix (see Section 3.4.1), and find which features are highly important for distinguishing this particular class. Additionally, one advantage of an ML approach is that the classification is probabilistic, enabling statistical analysis of derived samples.
Ansdell et al. (2016b) note their survey is not complete, presenting an additional 15 dipper candidates awaiting confirmation. By building a larger sample of dippers we are able to investigate population statistics of this unusual object. A larger sample also helps to define shared properties and provide further insights into the physical mechanisms that give rise to the observed variability.
In this paper, we revisit the K2 C02 observations of all targets, including known (and unknown) members of Upper Sco and ρ Oph. In Section 2, we discuss the input K2 data used in this paper and summarize the two regions. In Section 3, we discuss the details of the ML algorithm we have used. In Sections 4 and 5, the sample of dippers found by the ML algorithm and their characteristics are discussed. In Section 6, we discuss the bursters found by this work. We summarize our findings and inferences from this dipper sample in Section 7.
2 K2 OBSERVATIONS
The K2 mission is the follow-up to the original Kepler mission, launched by NASA in 2009, which failed in 2013 due to the loss of a second reaction wheel. Raw K2 photometry is known to be up to a factor of three to four times less precise than seen in the original Kepler mission. K2 data is split into 80 d Campaigns, distributed around the ecliptic plane. In this work, we use the data from Campaign 2, which observed Upper Scorpius and ρ Ophiuchus (see Section 2.1). The data are taken in the long cadence mode with a time sampling of 29.4 min.
The data from K2 C02 have been processed and made publicly available by several groups. Vanderburg & Johnson (2014), hereafter VJ14, employ a self-flat-fielding technique to remove the noise from the roll of the spacecraft. Aigrain, Parviainen & Pope (2016) employ Gaussian Process regression using the 2D position of each star to model the instrumental systematics and astrophysical variability in each light curve. Luger et al. (2016) use a pixel level decorrelation to remove systematics as well as Gaussian Processes to find the astrophysical variability for each source. All of these pipelines improve on the raw K2 aperture photometry and claim to reach precision of within a factor of 2 of the original mission.
Dippers are by their nature highly variable targets. Their strong astrophysical variability may well be misclassified as systematic error by many reduction pipelines. Notably some pipelines sigma clip their final data product, which could potentially remove the dipper signal. We find that the reduction from VJ14 did not heavily penalize dippers by sigma clipping. Additionally, it is robust against neighbouring contaminants that are expected in young star-forming regions such as ρ Oph. We employ the VJ14 reduction in our work, which can be accessed through the Mikulski Archive for Space Telescopes (MAST) under the acronym K2SFF.
There are still systematics in the VJ14 K2 light curves, most notably offsets between the first half and second half of the campaign. This artefact creates a step function in the data. In order to correct for the low-order trends we remove a 30-d Gaussian smoothing kernel from the data. [Similarly, Cody et al. (2014) remove a 20-d smoothing kernel from their CoRoT light curves.] This does not only affect the short duration dippers (time-scales ≤ few days) but also completely remove the step-function artefact either. A more thorough correction could be attempted.
K2 pixels are approximately 4 arcsec in scale. It is possible for sources to be close enough for light curves to be contaminated by a neighbouring source. Using the input RA, Dec., and median K2 magnitude values for K2 C02 (which can be accessed through MAST) the catalogue searched for any targets within 20 arcsec (5 pixels) of their nearest neighbour. In these cases, the brightest source is accepted and light curve from the dimmest source is removed from further reduction. 228 contaminating sources were removed from the sample.
2.1 Upper Scorpius and ρ Ophiuchus
Upper Scorpius and ρ Ophiuchus were observed in K2 C02 for 80 d, starting on the 2014 August 23. The Upper Sco association is at 145 ± 2 pc (de Zeeuw et al. 1999), with the younger ρ Oph cluster in front at 120|$\pm _{4.2}^{4.5}$| pc (Loinard et al. 2008). ρ Oph is a smaller cloud complex that is highly extinct, causing many stars to be extremely reddened. Upper Sco has been found to have an age of 11 ± 2 Myr (Pecaut, Mamajek & Bubar 2012), while ρ Oph is a younger association with an age of 0.1–1 Myr (Luhman & Rieke 1999; Andrews & Williams 2007; Wilking, Gagné & Allen 2008). However, as noted in Wilking et al. (2008), the two cloud complexes can be hard to distinguish; there are several members on the edges of ρ Oph with ages more consistent with Upper Sco.
Fig. 2 shows the K2 C02 field (centred on RA = 246.12°, Dec = −22.44°) where 13 399 stars were observed in long cadence mode. (Note that two modules, 3 and 7, are no longer functional and appear as gaps in the field.) Targets have been taken from the K2 target list, available at MAST.

K2 C02 field. ρ Ophiuchus members have been highlighted in red and are much more localized than the Upper Scorpius members, highlighted in blue. Here, only members that are also observed in K2 C02 are shown.
Members of ρ Oph and Upper Sco are highlighted in Fig. 2. Membership lists from Parks et al. (2014), Wilking et al. (2008), and Ratzka, Köhler & Leinert (2005) were compiled to create a catalogue of 2153 ρ Oph members. Membership lists from Luhman & Mamajek (2012), Rizzuto, Ireland & Kraus (2015), Lodieu (2013), de Zeeuw et al. (1999), and Slesnick, Hillenbrand & Carpenter (2008) were compiled to create a catalogue of 1349 members for Upper Sco. For each of the light curves in K2 C02 (having had any neighbouring sources removed), a membership was assigned by cross-matching with each member list using a radius of 1 arcsec. Any matches were flagged with the region name, any non-matches were flagged with an ‘Unknown’ membership. Where membership was ambiguous, Upper Scorpius was chosen as the parent region. In the K2 C02 sample, we find 708 stars to be members of Upper Sco and 199 to be members of ρ Oph.
This membership list is incomplete, as we show below. There are young stars in K2 C02 with IR excesses consistent with being a member of either Upper Sco or ρ Oph, some of which we identify to be dippers. With the anticipated release of Gaia parallaxes for these targets in 2018, the two star-forming regions will be more easily distinguished and membership lists will be more robust.
3 BUILDING AN ML ALGORITHM
ML has been used to classify the light curves of variable stars from a variety of surveys (see e.g. Dubath et al. 2011; Richards et al. 2011), up to and including K2 (Armstrong et al. 2015, 2016). These previous studies have shown how to construct and test frameworks for the reliable (and testable) classification of light curve data. Our aim was to build upon these methods and extend them to handle the new class of dipper. In particular, we felt that we could add to the sample of objects discovered by Ansdell et al. (2016b). The sample of dippers used to train the machine is shown in Fig. A1 and given in Table A1.
In this paper, we have used a random forest (RF) algorithm to classify the K2 light curves, implemented with pythonscikit-learn package (Pedregosa et al. 2011). Richards et al. (2011) tested a variety of tree-based ML classifiers on noisy time series data and demonstrated that RF classifiers were superior and fast.
3.1 The training set
RF is a classification method that relies on many decision trees (which are individually weak classifiers) grouped together to create one strong classifier. The algorithm is trained on data with known classifications. The RF classifier built from the training set is then applied to the remaining K2 C02 data set, where the classifications are unknown. The decision at each node in the decision tree for a given light curve depends on the numeric value of a single feature (e.g. median light curve level, number of dips, and median dip depth). The ML algorithm finds the thresholds at which these numeric features are cut in order to separate the training data into the known (‘true’) classifications.
RF is a supervised classification method that requires a sample of objects with known classifications, referred to as the training set. The number of each object is given in Table 1. Examples of each object are given in Fig. 3. To create the training set, we identified a set of K2 C02 targets that are already classified in the literature and are clear examples of those classes that we want the machine to find. Our training set was built from four primary references, which are detailed as follows:
The K2 Variability Catalogue II (K2VarCatII; Armstrong et al. 2016), based on K2 data from campaigns 0–4, and containing 1137 classified light curves, discounting noise and periodic stars (which are mostly spot modulated). They include seven distinct classes in their final results table: RR Lyrae, Delta Scuti, Gamma Doradus, Eclipsing Binary (Type A), Eclipsing Binary (Type B), Other Periodic, and Noise.
The Machine-learned ASAS Classification Catalog (MACC; Richards et al. 2012). The catalogue has been trained on 27 different variability classes and contains 74 targets that have a classification probability of more than 60 per cent and are in K2 C02 sample of targets.
Stars from the Simbad data base (Wenger et al. 2000) that have been classified in the literature.
A sample of 22 dippers in Ansdell et al. (2016b) and Bodman et al. (2017). There are 25 in total, but 3 were rejected as having low signal-to-noise light curves on inspection in the VJ14 reduction.

Example light curves of each training class for the machine. From top to bottom, the classifications are Beta Persei Eclipsing Binary, Dipper, Long Period Variable, RR Lyrae, Beta Lyrae Eclipsing Binary, Delta Scuti, and Gamma Doradus.
Initial number of objects in each training class, built from MACC, K2VarCatII, Simbad and Ansdell et al. (2016b).
| Classification . | Number . |
|---|---|
| Dipper | 22 (increasing to 40) |
| Beta Persei Type Binaries | 69 |
| Beta Lyrae Type Binaries | 55 |
| Long Period Variable | 45 |
| RR Lyrae | 74 |
| Delta Scuti | 121 |
| Gamma Doradus | 32 |
| Classification . | Number . |
|---|---|
| Dipper | 22 (increasing to 40) |
| Beta Persei Type Binaries | 69 |
| Beta Lyrae Type Binaries | 55 |
| Long Period Variable | 45 |
| RR Lyrae | 74 |
| Delta Scuti | 121 |
| Gamma Doradus | 32 |
In this paper, we have focused on distinguishing dippers from other classes of variable. We choose not to run a more comprehensive classification exercise across larger numbers of classes and sub-classes, as in other works (e.g. Dubath et al. 2011; Richards et al. 2012). However, we find the approach of classifying many types of variable produces better results than classifying dippers and ‘non-dippers’ only, improving our correct classification probability from 40 per cent to 86 per cent. We selected seven classes to train the RF against two classes of eclipsing binary: Beta Lyrae type (or EA in K2VarCat) and Beta Persei type (or EB in K2VarCat). We also use classifications for Long Period Variable, Gamma Doradus, RR Lyrae, Delta Scuti, and Dipper. A class for ‘Noise’ or ‘Quiet’ was also trialled in early iterations. It was found while this helped the overall accuracy of the machine for other variables, it did not improve the quality of dipper classification.
The initial numbers of training targets we assigned for K2 C02 are listed in Table 1. Classes were used where at least 30 exemplars could be identified. This was found to be large enough to find meaningful results for dippers.
3.2 Defining the features
In order to distinguish classes a set of numeric features (derived from each light curve) are needed. We designed features that would highlight key differences between dippers and the classes in our training set. These included measures of asymmetry, periodicity, and ensemble properties of variability within the light curve, as detailed in the following text.
It is important to choose a set of features that are representative and are, as far as possible, independent. An initial large set of features of more than 60 unique features was defined. We identified the highest ranking features using the scikit-learn package ‘extra-tree-classifier’ (see Section 3.3). We then removed any features that were strongly correlated and allowed the feature with the highest importance score to survive. The surviving 25 features are discussed below.
We have chosen to construct features based solely on the K2 photometry, rather than auxiliary data from other surveys. Our reasons for ignoring other sources of information beyond K2 (specifically photometric colours) are discussed in Section 3.4.2.
3.2.1 Literature features
| Feature . | Description . |
|---|---|
| mag_mid20 | The difference between the median of the lower 40th percentile and the median of the upper 40th percentile of magnitude divided by mag_95 (see the text for details). |
| perc_amp | The maximum magnitude divided by the median magnitude value. |
| M | The M-statistic defined in Cody et al. (2014), see equation (1). |
We also adapt two features that are loosely based on features from Richards et al. (2011). The first, mag_mid20, is the difference between the median of the lower 40th percentile and the median of the upper 40th percentile divided by mag_95 (which is the median magnitude in the top 5th percentile less the median flux in the bottom 5th percentile). The second, perc_amp, is the maximum magnitude in the light curve divided by the median magnitude.
3.2.2 Statistical features
Table 3 shows simple features that are commonly used to describe photometric variability. Features such as jack1 are particularly suited to identifying stars that changed behaviour during the observing campaign. This is a useful discriminant between dippers and eclipsing binaries and other regular variables.
Additional light curve features used in the RF algorithm designed to highlight dippers.
| Feature . | Description . |
|---|---|
| smooth_std | The standard deviation in magnitudes of the smoothed data with a kernel size of 20 d. |
| std | The standard deviation of the light curve in magnitudes. |
| med_abs_dev | The median absolute deviation of the photometry about the median:median(|Xi − median(Xi))|. |
| jack1 | The ratio of the standard deviation of the first half of the data to the standard deviation of the second half of the data. |
| diff | The maximum of the magnitude less the minimum of the magnitude. |
| dtav | The difference between the mean of the magnitudes and the median of the magnitudes. |
| period | The period of the light curve found by a Lomb–Scargle periodogram (Lomb 1976; Scargle 1982). |
| Feature . | Description . |
|---|---|
| diff2 | The difference between the median of the highest weighted Gaussian from the GMM to the median of the second highest weighted Gaussian from the GMM. |
| GMMstd | The standard deviation of the highest weighted Gaussian from the GMM. |
| sd_gauss | The standard deviation of the entire set of GMMs. |
3.2.3 Gaussian mixture models
We used 1D Gaussian mixture models (GMMs) in our feature set to split each light curve into different Gaussian populations. A GMM assumes all data points are drawn from an underlying, finite number of unknown Gaussian populations. Using scikit-learn's GMM package we calculated the optimal number of Gaussians to describe each light curve.
For a star showing low activity levels or noise a single Gaussian is sufficient to describe the distribution of observed fluxes, as shown in Fig. 4. A target with dips is also shown in Fig. 4, where a second Gaussian component is required to describe the flux deviations. We used the inbuilt Bayesian Inference Criteria function (BIC) to select the optimum number of Gaussians. We fixed the maximum number of Gaussians required for any light curve to be 6. In practice high numbers of Gaussians are only reached when there is large, long-term variability in a light curve that has been poorly detrended (e.g. when there is a sharp discontinuity); only 2.6 per cent of targets reached the maximum of 6 Gaussians.
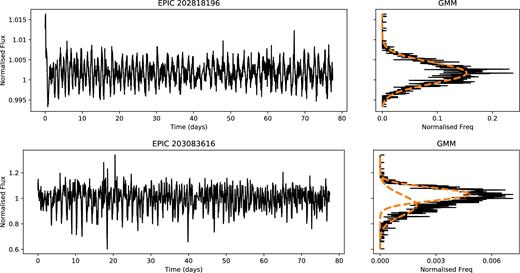
Example of Gaussian mixture models in 1D for a single light curve of a quiet star (top) and a dipper star (bottom). Both light curves have been corrected by removing a 30-d Gaussian smoothed version of the light curve. In the dipper case, we see a main population from the star and a second broad population due to the dips.
This separation of the light curve into different components enabled us to attempt to distinguish intrinsic stellar variability (e.g. photometric modulation arising from spots), from variability arising from some other process, e.g. dips or bursts. We used the median (GMMmed) and the standard deviation (GMMstd) of the highest weighted Gaussian as a measure of the baseline and amplitude of the intrinsic stellar variable flux. We then perform a search for any dips that lie more than 3×GMMstd away from GMMmed. Dips must consist of three or more consecutive points (all of which are 3×GMMstd away from GMMmed). By using at least three connected points, this reduces the sensitivity to small spikes due to cosmic ray hits and thruster firings. This also limits our sensitivity, any dippers that varied on time-scales of less than 90 min are undetectable (as K2's cadence is approximately 30 min).
By finding dips with respect to GMMmed, we created an additional set of features based on clusters of points, given in Table 5. These include the number of events (ngroups), the median depth of the events (medd) and the median duration of the events (medl).
| Feature . | Description . |
|---|---|
| ngroups | Number of dipping events, defined as a cluster of at least 3 points outside 3×GMMstd. |
| medd | Median value of the depth of the dips. |
| medd2 | Median value of the depth of the five deepest dips. |
| medl | Median duration of the dips. |
| dh | Maximum depth of events less the minimum depth. |
| dl | Maximum duration of dips less the minimum duration. |
| grad_groups | The number of groups of three points at least 3σ from the mean of the gradient of the light curve. |
3.2.4 Wavelet analysis
Wavelet analysis (Torrence & Compo 1998) is a method of describing periodicity in a time series, while preserving information about the localization of the periodicity [see Bravo et al. (2014) for a review of the method for finding rotation periods in Kepler data.] The procedure is similar to applying a windowed Fourier transform. In wavelet analysis, a wavelet function is moved along the light curve in time. The correlation between the light curve and the wavelet is measured at each point. The wavelet can be scaled as a function of time and the analysis repeated. This creates power as a function of wavelet time-scale and position in time along the light curve, which can be used to find localized periodicity. In this case, we use a sixth-order Morlet function (used in Torrence & Compo 1998) that is a sine wave modified by a Gaussian.
Wavelet analysis is often used where the variability of a source is changing. For dippers, this is particularly relevant. An object with one mode of variability (such as a pulsating star or an eclipsing binary) has a simple wavelet power spectrum that does not vary significantly with time. However, a dipper will have complex variability, changing power wherever there are changes in dip depth.
An example of a wavelet power spectrum is given in Fig. 5. The high-power features correspond to the deepest dips in the light curve. In Fig. 5, although the dips change and almost disappear, they are always on the same time-scale of 2.3 d. In Fig. 5, the dipper is aperiodic, as the wavelet is only highly correlated at 20–30 d and 40–50 d at a wavelet time-scale of 2.3 d.
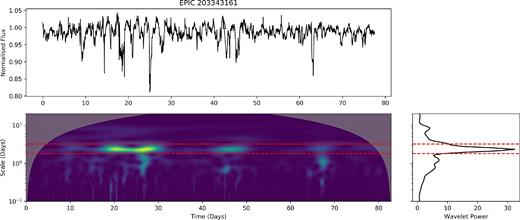
Wavelet power spectrum of dipper target. Top: Original light curve. Bottom left: The wavelet power as a function of time and wavelet scale. Scale refers to the width of the wavelet function in days. Bottom right: The summed power across time. Although the periodicity changes in power as the dips decrease in depth they reappear at the same scale in days. The red line drawn over the power spectrum indicates the region selected for determining the wa_period, s_per, and std_ flat features in Table 6.
The use of wavelet analysis here allows an important feature to be measured; the change in aperiodic features over time. This can either be by changes in amplitude or by the time-scale of the wavelet. To measure this, we take the region of the wavelet power spectrum that contains the highest power. This region is obtained by fitting a Gaussian to the total power (summed over all time points) and taking the 1σ region around the peak power. (The width of this peak is a feature in the machine, referred to as s_per.) This region is highlighted in Fig. 5. This region is then averaged in the wavelet time-scale dimension to produce power as a function of time. We use the standard deviation of this slice as a feature in our machine, referred to as std_ flat in Table 6. This feature is one of the top 10 most important features, as it helps to distinguish dippers (which behave irregularly in terms of dip depth and dip period) from Beta Lyrae type variables (which have a large M statistic but are regular).
Features based on wavelet analysis and the Lomb–Scargle periodogram used in the RF algorithm.
| Feature . | Description . |
|---|---|
| wa_ period | Period from wavelet analysis. |
| s_ per | Width of the Gaussian fit to the period peak in wavelet analysis. |
| std_ flat | Standard deviation of the flattened wavelet analysis. |
| wa_std | Standard deviation of the power spectrum from wavelet analysis. |
| pgram_std | Standard deviation of the Lomb–Scargle periodogram. |
Periodic features found using this method are given in Table 6. We additionally compute the standard deviation of the power of the Lomb–Scargle periodogram as a further feature based on the periodicity of the data. Unlike Lomb–Scargle periodograms, Wavelet Analysis requires evenly spaced data and that all time stamps have a corresponding magnitude value. For any gaps in the data, we fill in points with a linear interpolation. These gaps occur infrequently throughout the data and usually last only a few hours.
3.3 Feature importance
Using scikit-learn's ‘extra-tree-classifier’ function, it is possible to rank each feature by weighted importance to the classification, which sums to 1. The importance scores for each of the features used in this work are shown in Fig. 7. Periodic features and M-statistic rank highly, showing they are important to the classification.
Fig. 6 shows how the top 10 high importance features correlate, with the dipper sample found by this work highlighted. The dipper sample is not clear or unique in any of these features, showing the need for a large number of features and an ML algorithm to distinguish between classifications.
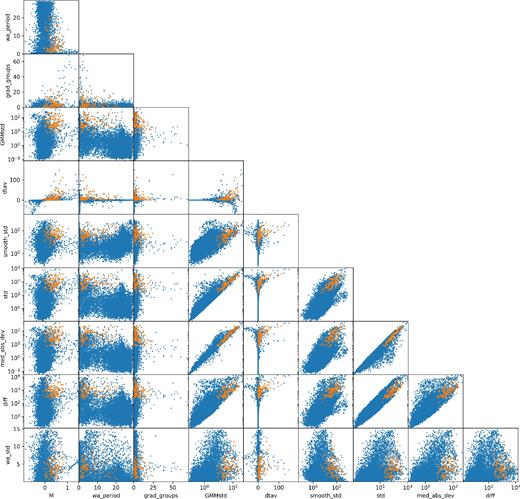
Correlation between the top 10 features of the ML algorithm as ranked by importance. Blue points show all 13 000 light curves used in this work, orange points show the 95 dipper candidates that were confirmed by eye as discussed in Section 4. Dippers are mixed with the population in most features and are not uniquely identifiable in any one feature. This shows the need for an ML approach.
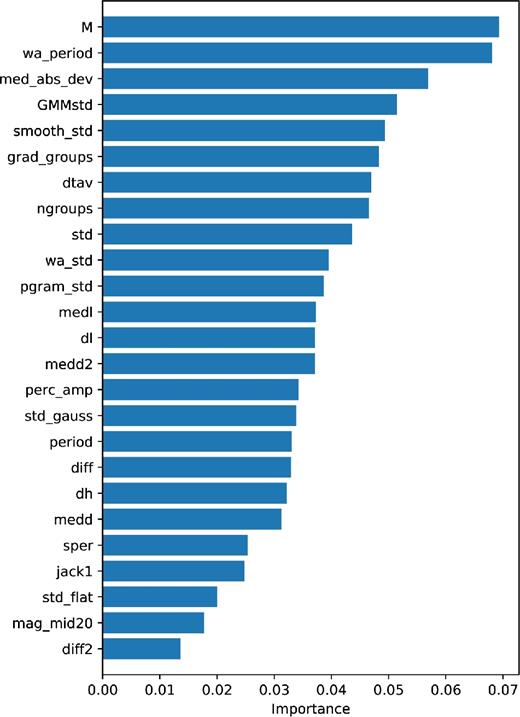
Importance score for the classifier when using only two classifications (‘Dipper’ and ‘Non-Dipper’). We see that the most important features for this class of object are period, M-statistic, the number of groups of turning points and the standard deviation. Note that this is the relative importance of each feature, with all features summing to one.
For example, Fig. 8 shows the frequency of each classification across the value of the M-statistic, the most important feature. While dippers are skewed towards a high value of the M-statistic, the behaviour is mimicked in Beta Lyrae Type Eclipsing Binaries (bL*) and Gamma Doradus stars (gD*). This is expected, as M-statistic measures the asymmetry of the light curve. Eclipsing binaries will show frequent, deep eclipses and some pulsators will also be skewed. More features are needed than a simple M-statistic to distinguish these classes. For example, features such as std_ flat are helpful in distinguishing dippers from Beta Lyrae Eclipsing Binaries.
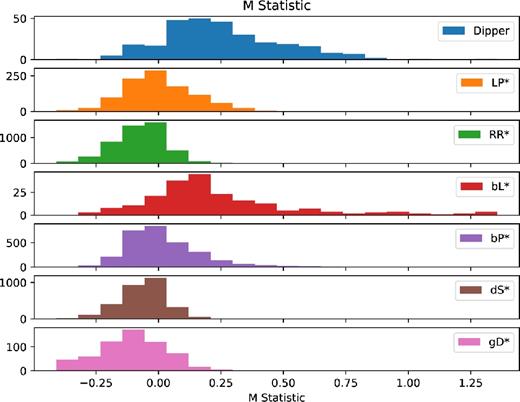
Distribution of each class of object in M-statistic, having run the ML algorithm. The classes are (from top to bottom) Dipper, Long Period Variable, RR Lyrae, Beta Lyrae Eclipsing Binary, Beta Persei Eclipsing Binary, Delta Scuti, and Gamma Doradus. Note that using just the feature M-statistic is not enough to distinguish dippers from Beta Lyrae Eclipsing Binaries. Additional features from the machine are needed.
3.4 Testing and tuning the performance of the RF classifier
In order to test the efficiency of the RF classifier, a ‘test’ portion of the training sample is kept to one side. The true classifications of this set are already known. The RF classifier is then trained on the remaining ‘training’ data set. The trained RF classifier is then run on the remaining ‘test’ set to find the efficiency of the machine. The true classifications are compared to the predicted classifications, producing a confusion matrix. We use a 20 per cent/80 per cent test-train split. There are a relatively small number of exemplars in each classification, shown in Table 1, which can produce some scatter in the results. To avoid errors from the small training sample we run the classifier 200 times and record the result for each iteration.
3.4.1 Iterative training set selection
Once the RF classifier has been built it is then possible to use metrics such as the confusion matrix (see Fig. 9) to evaluate the quality of the machine. After the first iteration of the machine, the classifier did not perform adequately with our small initial sample of dippers. Using only the literature sample of 22 dippers in K2 C02 provided a correct classification of the training set of 68 per cent for dippers. This small sample caused approximately 32 per cent of dipper candidates to be misclassified, mostly as Beta Lyrae or Beta Persei Type Eclipsing Binaries. To improve on this, we manually vetted the results of the ML algorithm in this first iteration with the 22 literature dippers as a training sample, and identified 18 targets that were clear examples of dippers. These new candidate dippers stars were added into the training set to give 40 training targets. After retraining the classifier, this increased our correct classification percentage from 68 per cent to 86 per cent. This classifier was then applied again to the K2 C02 data to find our final sample. Fig. 9 shows the confusion matrix after the machine had been trained on 40 dippers. The matrix is highly diagonalized showing that the classifier performs well and correctly classifies each variable type in the majority of cases.
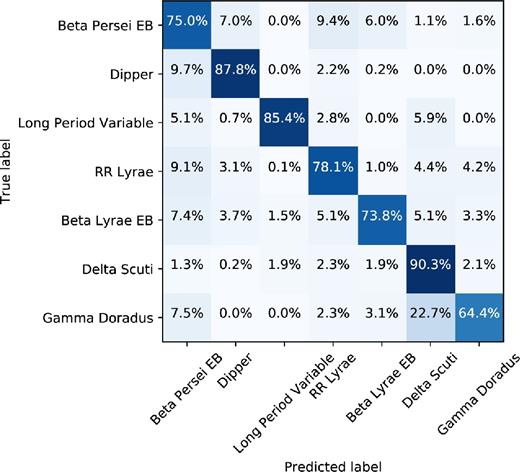
Confusion matrix for the final classifier after 200 iterations using an 20 per cent-80 per cent test-train split. ∼86 per cent of dippers were correctly classified, with most of the incorrect dipper classifications lying in Beta Persei or Beta Lyrae Type Binaries. The matrix is highly diagonalized showing that the method works well for classifying variables.
3.4.2 Exclusion of IR colours
When infrared colours from the 2MASS and WISE surveys (Skrutskie et al. 2006; Wright et al. 2010) are included as features, the classification efficiency for dippers is increased to 95 per cent, a significant improvement from 86 per cent without colours.
We elected not to use photometric colour information for two reasons. First, there are many stars in the K2 C02 field with incomplete colour information, which complicates their inclusion in the ML algorithm. Secondly, adding colour information would add weight to targets with obvious discs. To ensure this classifier works for stars of any age (and will still perform well for stars with little to no IR excess), colour has been omitted as a feature. This ensures we are not preferentially selecting young stars as dippers, and should not miss dipping candidates that are discless, thus further testing the hypothesis is related to the inner regions of the circumstellar disc.
4 DIPPER CANDIDATES
Once the classifier had been trained on the targets found in Section 3.1, the same algorithm was used on unclassified data. This algorithm was run on 13 399 unique light curves with no information on membership. This gave each light curve, a classification probability of being a dipper. The exercise was repeated 200 times (where the machine was retrained each time with a randomized training set of 80 per cent of the dippers), and the probabilities for each light curve were recorded. The machine returns 290 candidate dippers. We took targets that had a probability assigned by the ML algorithm of 40 per cent or more averaged over all 200 iterations, resulting in 198 candidates. Targets fainter than 18th magnitude were not included in this analysis; on inspection, they have signal-to-noise ratios (SNRs) that are too low to reliably classify. We remove targets that are 18th magnitude or fainter, leaving 193 candidates.
The 193 light curves were examined by eye to remove any cases where strong systematics may have contributed to a misclassification. Of this list, 69 were found to be other variable types that had been misclassified, including stellar pulsators and eclipsing binaries. Misclassifications were identified most commonly periodic variable type stars with additional systematics that mimicked dipper behaviour. (For example a discontinuity in the light curve caused an apparent change in the variability of the star.) The set was further cleaned to remove any dipper candidates with small flux variations that could reasonably be due to spots on the surface of the star; candidates with flux dips less than 10 per cent or less than three dips were removed from consideration. The number of targets with each classification after the procedures described above is given in Table 7.
Results of the ML algorithm, having been cleaned by eye. Here, a fringe case has been rejected for being close to star spot behaviour. A second stage of eyeballing was undertaken for targets that were classified with a low-dipper probability. This increased the number of dipper targets slightly and the number of burster targets significantly.
| Type . | Number of targets . |
|---|---|
| Dipper | 91 (rising to 95) |
| Burster | 10 (rising to 30) |
| Fringe/spots | 23 |
| Misclassification | 69 |
| Type . | Number of targets . |
|---|---|
| Dipper | 91 (rising to 95) |
| Burster | 10 (rising to 30) |
| Fringe/spots | 23 |
| Misclassification | 69 |
A second subset of 204 light curves were classified as a dipper with a probability of more that 20 per cent but less than 40 per cent across the 200 iterations. These were also eyeballed to find any false negatives. Out of these 204 objects, 4 candidates were manually relabelled as dippers.
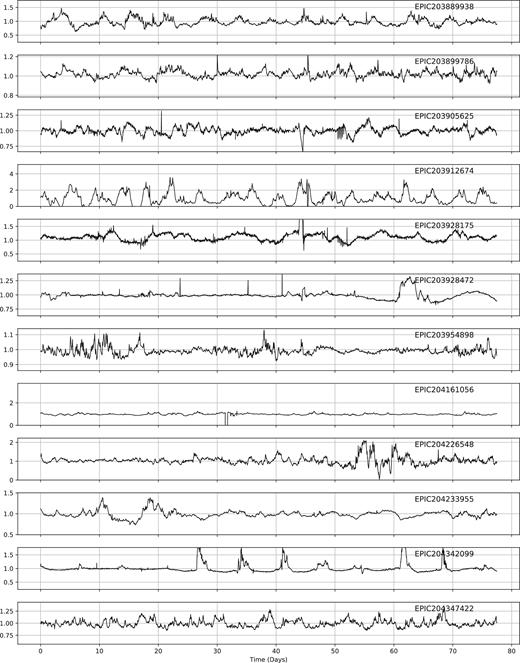
In these two phases, we also identified a set of 30 light curves by eye, which belong to a distinct class that we have labelled as bursters (see Section 6). There are cases where the classification is uncertain, for example when the target is mostly symmetric about the median flux. In such cases, the target was put in the burster class to ensure a clean dipper sample. Candidates were labelled as bursters when they were visually either mostly symmetric around the mean flux or mostly exhibiting flares with little to no dipping. Some dipper candidates have been removed by visually reclassifying these objects (e.g. see EPIC203870058 in the Appendix, which both dips and bursts).
All bursters found in this work are shown in the Appendix. As the machine was not trained on this particular class, we cannot be certain of completeness. We expect there to be other burster examples that have not been found here. As discussed in Section 6, the sample of bursters found in this work is too small to warrant a new training classification in the ML process.
After eyeballing, we were left with a final set of 95 dippers, including the 40 objects used to train the machine. Our final sample is given in the Appendix of this work. Of this 95, 22 belong to ρ Oph, 43 belong to Upper Sco, and 31 have an unknown membership.
4.1 Verifying the machine with colour
By omitting colour information, we can independently check the performance of the ML algorithm. As dippers are expected to host protoplanetary discs, we would expect most, if not all the dippers to show an IR excess and be members of either young star-forming region (distinguished in colour space from the background population). Fig. 10 shows the dipper sample as a function of IR excess and M-statistic. Despite not training on colour information, we see that the dipper and burster populations are clearly biased towards a high-infrared excess. We find all are consistent with being young, disc-bearing stars, providing yet more evidences that the dipper and burster phenomena are related to disc material.
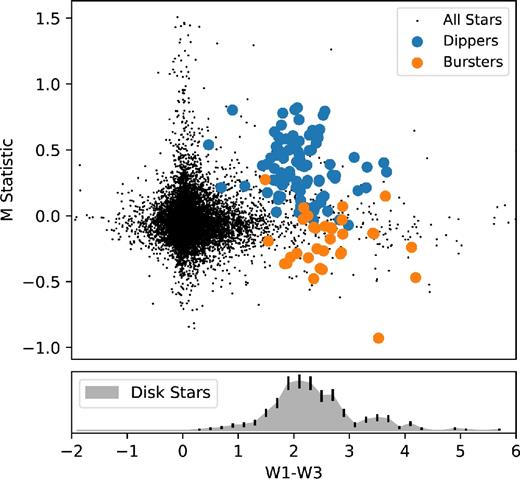
M-statistic, defined in equation (1), as a function of W1−W3 IR excess for K2 C02 found using a RF algorithm. The algorithm was trained only on light curve parameters and shows dippers in K2 C02 occur in systems with an infrared excess indicative of hosting a disc. The upper panel shows dipper and burster population as a function of colour and M-statistic. The lower panel shows the distribution of disc-bearing stars as a function of colour based on α > −1.6, where α = dlog λFλ/dlog λ. All dippers and bursters are consistent with disc-bearing stars as discussed in Section 5.3.1.
There were 32 targets with an IR excess (W1 − W3 > 1) and high M-statistic value (M-statistic > 0.2) that were not classified as dippers. These were also verified by eye to find any misclassifications. Some of these targets show aspects of dipping behaviour, but do not meet the criteria for classification (e.g. the light curves have too few dips or the dips are too shallow). In the majority of cases, the light curves either show long-term variability or contain discontinuities due to the VJ14 data reduction process, causing an M-statistic >0.2. Two eclipsing binaries are in this set with both M-statistic and W1 − W3 > 1. However, on inspection of the WISEW1 and W3 images, background/foreground cirrus contamination is causing the IR excess measurements of these targets to be overestimated.
5 DIPPER CHARACTERISTICS
With this new large sample of 95 dippers we can now revisit some of the basic properties of the class. We pay particular attention to the features derived from the K2 photometry, which were used to classify the dippers, combined with infrared photometry from 2MASS (Skrutskie et al. 2006) and WISE (Wright et al. 2010). We also investigate differences between dippers in upper Scorpius and ρ Ophiuchus.
5.1 Dip parameters
Parameters such as the dip depth and duration are useful for characterizing the behaviour of individual dippers. If the theory of the inner edge of the disc obscuring the star is correct (such as those from Bouvier et al. 1999; Alencar et al. 2010; McGinnis et al. 2015; Bodman et al. 2017), the depth of the dip should relate to the cross-sectional area of material obscuring the star. Additionally, the period and duration of the dips should relate to the orbital distance from the star. To measure these parameters, we first find all dips using the methods discussed in Section 3.2.3.
We measure the depth and duration of dips using a more detailed procedure than the one used in to build features (see Section 3.2). This more detailed approach takes too long to run on all 13 399 targets in K2 C02 to generate features, but more accurately describes the dip parameters. This procedure is performed on a lightly smoothed version of the data; a boxcar is used at a 25 per cent of the best-fitting Lomb–Scargle period to remove any short-term variability unrelated to the dipping.
First, we calculate a level that approximates the stellar baseline. We create a heavily smoothed version of the light curve using a Gaussian smoothing kernel at twice the period of the dipping events (up to a maximum of 20 d). (We use the Lomb–Scargle period found above.) This ensures sharp features and dips are removed. This smoothed light curve is offset to the median level of the stellar baseline as assessed by the GMM (see Section 3.2.3). We find all dips that have minima three GMMstd fainter than this continuum level.
We measure the depth and duration of each event by finding the minimum of the dip and ‘walking’ up either side until either the continuum is met or there is a turning point (assessed by the gradient of the data). This creates an allowed region (shown in blue in Fig. 11 ). The duration of the dip is the width of the final allowed region. The dip depth is the average continuum level in that region less the minimum flux found in the dip.

Example of the output of the dip depth and duration finding algorithm. Here, the red line shows the continuum level, which is a simple 20 d smooth of the data after outliers have been removed. This is also offset to the continuum level as assessed by the GMM. Blue areas indicate features that have been labelled as dips, with the width and height of the area indicating the duration and depth of the dip. Orange areas have been labelled as bursts.
The same procedure is used to find bursts by finding all events that are three GMMstd above the continuum. These are shown in orange in Fig. 11.
This approach is still simplistic. Bursts and dips are sometimes confused, particularly in cases where there is a strong long term trend in the data. Some dips are also clearly the convolution of two or more events, which are harder to separate. While this method is not ideal, it provides statistics on the dipper population as a whole.
5.2 Comparison with Ansdell et al. (2015)
In Ansdell et al. (2016b), dippers were defined by first smoothing with a high pass filter at 1 d and then measuring the following: the number of dips (NDip), the average dip depth of the three deepest dips as measured from the normalized light curve (DDip), the ratio of the dip depth to the standard deviation of the data (RDip), and the rotational period of the star PRot.
A dipper was then defined as a target with NDip > 5, DDip > 0.07, RDip > 5, and PRot to be less than 10 d. We find when we compare our sample of 95 dippers to this metric 35 per cent do not qualify. This is in most cases due to our dippers being aperiodic with no clear value for PRot. We also found that the RDip criteria clipped out a small number of dippers that were symmetric (i.e. bursted as well as dipped). Two examples of dippers found by this work that do not qualify based on this metric are shown in Fig. 12. We suggest that these criteria may be too strict and cut out valid dipper candidates.
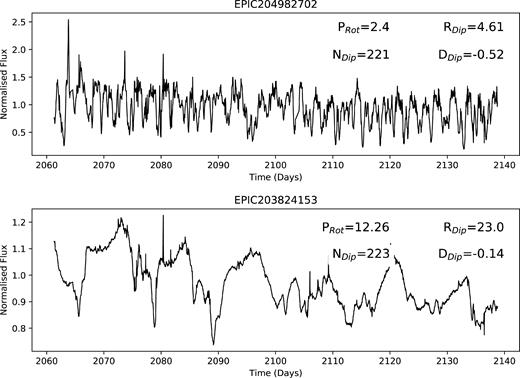
Example of two dipper targets that did not meet the criteria set out in Ansdell et al. (2016b). Top: The RDip parameter here is slightly less than 5, as the dips are narrow and frequent. Bottom: The period of the dipping is approximately 12 d that is longer than the 10 d cut.
Fig. 13 shows the distributions of median depth and median duration calculated for our sample of 95 dippers and calculated for the 24 dippers found in Ansdell et al. (2016b). They show similar distributions, suggesting the surveys have similar sensitivities.
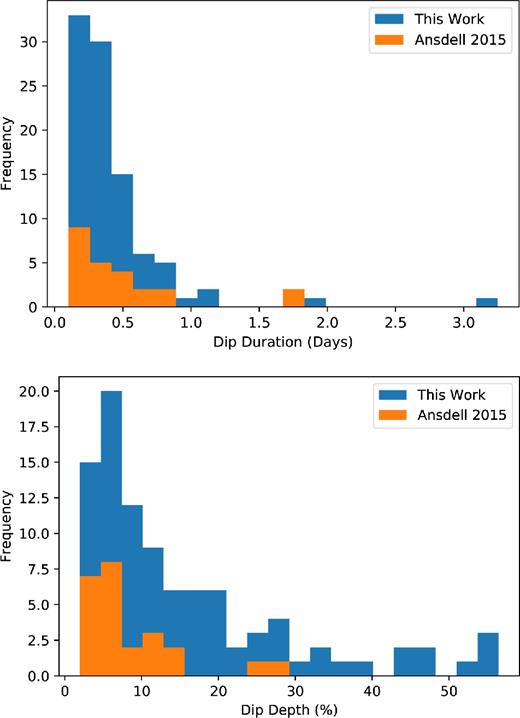
Distributions of median dip depth and median dip durations for all 95 dipper targets. Blue: Dipping events found in this work using ML. Orange: 24 dippers found in Ansdell et al. (2016a) also used in this work. We see the two distributions are similar, suggesting there are no additional biases for or against these two parameters when ML is used.
In general, it is easier to find deeper dips as they are more easily distinguished from stellar noise. As we discount any targets with dips small enough to be explained with star spots, we may therefore be under-representing the dippers at the smallest dip depths. Similarly, as the cadence of the data is 30 min, we do not have the time resolution needed to observe shorter duration dips than 1.5 h. We may be under-representing the sample of ‘short period’ dippers.
In Ansdell et al. (2016b), a positive correlation is seen between extinction corrected Ks band and W2 band magnitude, a measure of dust content in the inner disc, and dip depth DDip. In this work, we have not obtained spectra for our objects, and so we are not able to uniformly correct for reddening in all of our targets. To investigate the entire sample, we show the relation between dip depth and Ks–W2 (Fig. 14), without correcting any of the sample for extinction. This shows a clear correlation. A Spearman's rank test gives a correlation of 0.424 and a p-value of 1.8× 10⁻⁵, indicating the correlation is significant. We therefore find strong evidence for a connection between the emitting area of material close to the star and the dip depth.
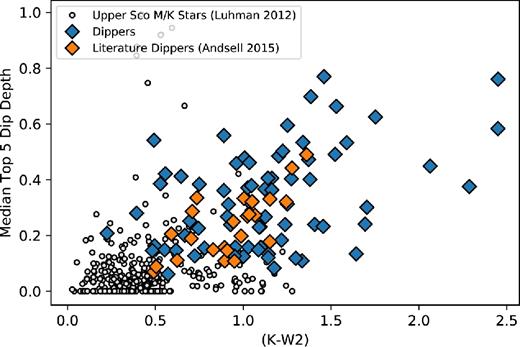
Average depth of the five deepest dips as a function of Ks–W2 excess. Here, blue diamond points indicate dippers found with the ML algorithm from this work and red diamonds indicate dippers found in Ansdell et al. (2016b). Dippers have not been corrected for extinction. We find a correlation between infrared excess and dip depth similar to the correlation found in that work.
5.3 Dipper fraction by region
Fig. 15 shows a colour–magnitude diagram of all of the targets within K2 C02 with members of Upper Scorpius and ρ Ophiuchus highlighted. All dippers are consistent with being members of either Upper Sco or ρ Oph. There is no evidence for dippers in the older, background population.
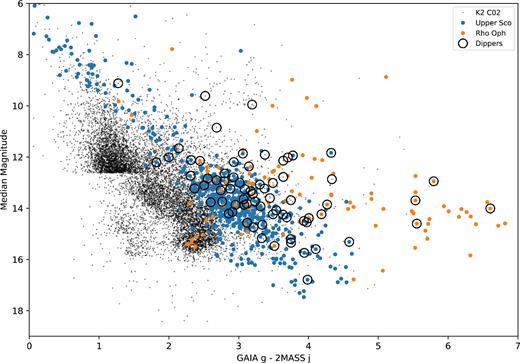
Median magnitude of K2 light curves compared with G − J colour, with magnitudes from Gaia DR1 and 2MASS. The Upper Sco and ρ Oph populations are broadly distinguishable; ρ Oph is seen to be redder, as it is embedded in a cloud. At a Kepler magnitude of 18, the SNR of each target is too low to accurately find dippers in the K2 photometry. We find all dippers have an IR excess consistent with disc-bearing stars. Membership lists have been built from Luhman & Mamajek (2012), Rizzuto et al. (2015), Lodieu (2013), de Zeeuw et al. (1999), Slesnick et al. (2008), Parks et al. (2014), Wilking et al. (2008), and Ratzka et al. (2005).
We find there is a modest difference between the percentage of dippers in each region out of all members). In Upper Sco (10 Myr), we find 5.9 per cent ± 0.9 per cent are dippers, and in ρ Oph (1Myr), we find a member occurrence rate of 11.0 per cent ± 2.3 per cent. However, ρ Oph has many more disc-bearing stars, and the percentage of disc-bearing stars that are dippers is a more useful metric for the prevalence of dippers.
Cody et al. (2014) discuss the fraction of the disc-bearing population that are dippers (the ‘dipper fraction’) in NGC 2264. Of their sample of 1266 cluster members, 162 were found to have both discs and high-quality CoRoT and Spitzer light curves. Of this sample, 35 were found to be dippers in the optical.
Using the prescription in Cody et al. (2014) and Wilking et al. (2001), we identify the disc-bearing stars as those with α > −1.6, where α = dlog λFλ/dlog λ, using K-band photometry from 2MASS and W4 photometry from WISE. We then compare the fraction of dippers amongst the disc-bearing stars for Upper Sco and ρ Oph. All dippers found with our method have discs and meet the α > −1.6 criterion. Table 9 shows the final dipper fraction for each region, including NGC 2264. We find between the three regions the dipper fraction in disc-bearing stars is approximately 20 per cent, regardless of age.
There are 31 dippers with an unknown membership thought to belong to either region, and these are excluded from the statistics in Table 9, but are listed in Table A1 for completeness. With the planned release of parallax data from the Gaia mission in the 2nd Data Release, it will be possible to obtain better membership lists and measure more precisely the dipper fraction and dipper occurrence rate.
5.3.1 Disc evolution
For some dippers, classifications of their disc-bearing nature can be found using literature. Luhman & Mamajek (2012) use infrared photometry (from 2MASS and WISE) to distinguish the evolutionary stage of disc-bearing stars in Upper Scorpius. There is some overlap between their sample and the targets in K2 C02. They define discs as full (optically thick with no evidence in the SED of clearing), evolved (optically thin in the IR with no evidence in the SED of clearing), and transitional (with an SED showing evidence for gaps and holes). They also define debris/evolved transitional discs that are composed of second-generation dust and are considered to be the final stage of disc evolution.
Fig. 16 shows a reproduction of fig. 2 from Luhman & Mamajek (2012), where the disc type of each target has been labelled. Dippers and bursters found by the ML algorithm and vetted by eye are plotted over the disc-bearing stars. For the majority of the dippers, we have no spectral types or reddening coefficients, and so the targets in this figure have not been corrected for reddening. Dippers observed in Luhman & Mamajek (2012) that are labelled as ‘evolved’ are given in Table 10 and highlighted in Fig. 16 in green. Light curves for these dippers are also shown in Fig. 17. There are also four other dippers that have IR excesses consistent with being more evolved discs but were not observed in Luhman & Mamajek (2012).
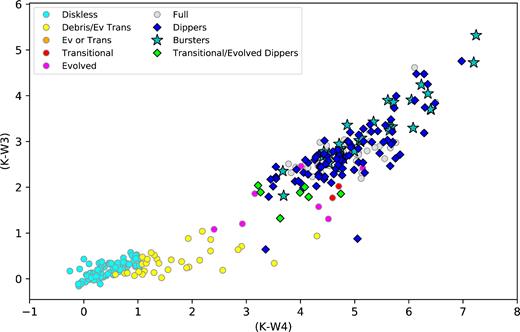
Disc types of dippers and bursters found in this work, where filled circles indicate disc types from Luhman & Mamajek (2012) in Upper Sco that were also observed in K2. Colours are not corrected for reddening. Blue diamonds are all dippers found in this work with any membership, stars indicate bursters also with any membership (which we expect to be an incomplete sample). Green diamonds indicate dippers that were also observed in Luhman & Mamajek (2012) that were found to have evolved or transitional discs given in Table 10.
Of the 11 dippers consistent in colour space with being an evolved or transitional disc, none are distinct from the full disc dipper population in any of the features used to train the machine. They are consistent in period, dip depth, and duty cycle (fraction of time in dip compared with out of dip) with the full disc-bearing dipper population. This suggests that the dipper phenomenon is not affected by the early stages of disc evolution.
5.3.2 Spectral types of dippers
Stauffer et al. (2015) and Ansdell et al. (2016a) find that the dipper behaviour is limited to late-type KM stars. We similarly find only late-type stars amongst our dipper sample. Our spectral types are based on Luhman & Mamajek (2012), who provide spectral types for their sample of 485 members of Upper Scorpius, and Wilking et al. (2008), who provide spectral types for 124 members of ρ Ophiuchus. Table 11 shows the expected number of dippers in each spectral type (assuming the dipper behaviour was not spectral type dependent) based on these works. We make the assumption that all stellar types were observed uniformly. Table 11 shows we would expect low numbers of stars larger than K and M type, and so we are not able to rule out dippers amongst more massive stars.
Additionally, young circumstellar discs are shown to disperse faster around more massive stars (Carpenter et al. 2006; Kennedy & Kenyon 2009), which limits the number of high mass stars with discs in clusters older than a few Myr. We may also be insensitive to dippers around F and G stars due to their lack of discs in these young star-forming regions.
5.3.3 Orbital distance to inner disc edge
Direct measurements of the inner disc location have been made for Herbig Ae/Be and T Tauri stars using interferometric techniques, and are used to infer the structure of the inner disc (see e.g. Akeson et al. 2005; Anthonioz et al. 2015; Kraus 2015). The heating mechanism may be inferred by comparing the observed inner edge location with the expected dust sublimation radius for different assumptions (e.g. Millan-Gabet et al. 2007). Extending such interferometric measurements to masses lower than solar is difficult. Here, we suggest that dippers provide an indirect estimate of the location of the inner disc edge. Using dippers to measure the inner disc edge could extend the range of stellar luminosities over which inner edges can be estimated by approximately three orders of magnitude.
The dipper phenomenon is attributed to occultation of the star by opaque material (dust) at, or close to, the inner edge of the disc (e.g. Bouvier et al. 1999; Bodman et al. 2017). The specific mechanism is unclear and could be due to azimuthal variations in the inner disc edge vertical scale and/or dusty accretion streams flowing from the disc down to the star. Thus, the dipping phenomenon is intrinsically tied into the inner edge of the disc and can be used to study the region.
A period can be estimated either by using a Lomb–Scargle periodogram across the entire time series or localized where dips repeat. Assuming Keplarian velocity and using the spectral types from Luhman & Mamajek (2012), Wilking et al. (2008), and Ansdell et al. (2016b), we can estimate an orbital separation from the host star.
Even in the event that the occulting material resides in accretion streams that are well interior to the disc inner edge, inner radius estimates may still be robust if we assume these streams are locked to the inner disc edge [which Bodman et al. (2017) argue is set by magnetospheric disc truncation].
Fig. 18 shows the period and the inferred orbital distance in au (which we use as a proxy for the inner edge radius) for periodic dippers as a function of stellar luminosity (aperiodic dippers are not included). Solid and dashed lines indicate a simple blackbody heating relation given in equation (3). We find the best-fitting sublimation temperature for all dippers to be 580|$\pm ^{300}_{120}\,\text{K}$|. While the dipper population lies along a line of approximately constant temperature, they are notably cooler than the blackbody sublimation temperature.
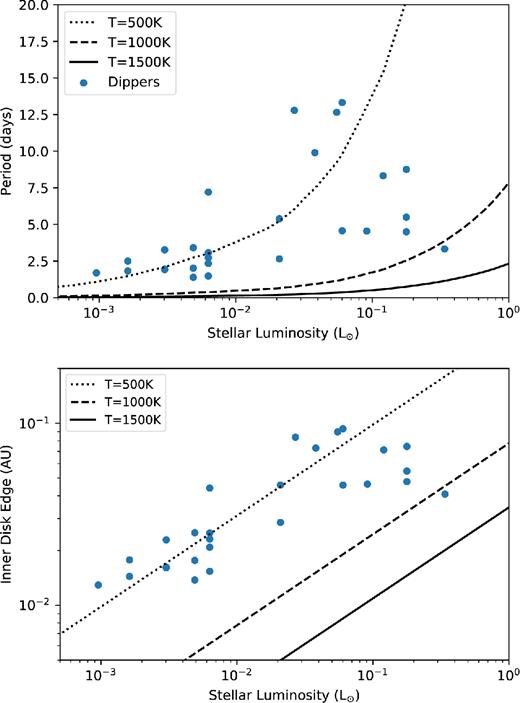
Inner disc edge in au as a function of the luminosity of the star. We see dippers have systematically larger inner disc edge radii than predicted from a simple blackbody. Invoking backwarming or increased luminosity from accretion may account for this additional heating. We find a median temperature of 580|$\pm ^{300}_{120} \, {\rm K}$| for all dippers.
Other works similarly find that the inner disc edge of T Tauri stars lies further out than predicted by a simple blackbody model and dust sublimation. Eisner et al. (2007) show using interferometry that low-luminosity (∼1–5 L⊙) T Tauri stars have more distant inner disc edges than predicted by simple models. Millan-Gabet et al. (2007) also show the same result that low-luminosity T Tauri stars have larger sublimation radii compared with that estimated by using a blackbody assumption and the sublimation temperature Tsub. They suggest backwarming in the disc could increase the sublimation radius by a factor of 2. They also note that smaller dust grains could cause the sublimation radius to increase. Muzerolle et al. (2003) suggest that the inner edge of the disc could be increased in T Tauri stars due to extra luminosity from accretion. If the dipper phenomenon can be attributed to the inner edge of the disc, some heating mechanism is also required to push the inner edge of the disc further out for K- and M-type stars.
In this work, we extend the range of luminosities for T Tauri stars down to 10−3 L⊙, and similarly find that the material causing the dips exists at a radius much cooler than blackbody sublimation temperature. In summary, we have shown how dippers provide an estimate of the location of the inner disc edge around low-mass stars. Our measurements have systematic uncertainties because the specific location of the occulting material relative to the disc inner edge is uncertain. Nevertheless, our estimates appear consistent with results for more massive T Tauri and Herbig Ae/Be stars, and extend the stellar luminosity range over that such measurements can be made by several orders of magnitude.
5.3.4 Insensitivity to long-period dippers
If we assume the occulting material is at the sublimation radius, then the period of the dips should increase as a function of spectral type as stellar luminosities (and so stellar masses) increase (see Fig. 18). Using the stellar models from Pecaut & Mamajek (2013), it is possible to calculate the expected period for early-type (BAFG) stars if the same dipper phenomena were to occur in these spectral types. In this case, we use a sublimation temperature of Tsub = 580|$\pm ^{300}_{120\,}\text{K}$| (which is found to be the median sublimation temperature for the dippers in this sample as discussed above).
For a solar-like G star, we would expect a period of 40 |$\pm _{28}^{41}$| d, and for an F-type star we would expect a period of 98 |$\pm _{70}^{98}$| d. As K2 C02 is an 80-d long campaign (and we require at least 3-5 events for a detection), we would expect F- and G-type dippers to be barely detectable, if they were physically possible and present (see Bodman et al. 2017; Kennedy et al. 2017 for discussions of physical reasons dippers may be restricted to late-type stars). Also, as shown in Table 11, there are low numbers of F- and G-type stars expected in this sample. For earlier B- and A-type stars, we expect the rotation period at the sublimation temperature to be >80 d and too long to be detectable with K2. (As discussed in Section 5.3.2, there are also few massive stars in Upper Sco and ρ Oph.)
6 BURSTERS
A subset of the candidates flagged by the RF classifier were found to become brighter in bursting events similar to those found in Cody et al. (2014) and Stauffer et al. (2014). These were distinguished by eye and flagged as bursters. This subset also contained targets that both dipped and bursted, referred to in Cody et al. (2014) as a symmetric morphology. All bursters were noted to have a significant infrared excess and M-statistic of ≲ 0 (see Fig. 10), and are otherwise indistinguishable from the dipper sample, they cluster in the same spaces of all other features. An example of a burster is given in Fig. 19.

Example of a burster from K2 C02. Here, we see the flux of the star doubles over a few days before returning to normal. The shape and duration of the burst event is inconsistent with stellar flares. 30 such object have been found in this work.
The burst events found in this sample do not resemble stellar flares, which are characterized as a sharp increase in flux with an exponential drop off. These events much more closely resemble the dipping behaviour in shape. Stauffer et al. (2014) suggest these events are accretion bursts, where short-duration mass in-falls on to the stellar photosphere cause brightening events, potentially also causing a hotspot. They show other candidates that are not bursting but may display a rotating hotspot from such accretion mechanics.
It would have been possible to iterate further and build a new burster class to find this type of object. We chose to have one broad classification rather than split into two classes, dipper and burster, for two reasons: first the number of bursters is small that limits our ability to produce a reliable training set. Secondly, there are some targets that are difficult to classify that both dip and flare. To ensure the dipper population is as clean as possible any cases where there was an equal amount of bursting events compared with dipping events were added to the bursting class.
The occurrence rate of bursters is 1.1 per cent ± 0.4 per cent for Upper Sco (10 Myr) and 7.5 per cent ± 1.9 per cent for ρ Oph (1 Myr) as shown in Table 8, though this may be an underestimate. If our incompleteness is the same for each region (which we expect) we find more bursters in the younger ρ Oph cluster. The fraction of disc-bearing stars that are bursters is 4.3 per cent ± 1.5 per cent for Upper Sco and 14.3 per cent ± 4.0 per cent for ρ Oph. Thus, there is weak (2σ) evidence that, unlike the dipper fraction, there is a decrease in burster fraction (and hence the rate or magnitude of accretion bursts) with age.
Members and dippers in each cluster observed by K2. The memberships are likely incomplete and several dippers were not found in any membership. However, they are consistent in colour space with being members of one or both of the young star-forming regions.
| . | Upper Scorpius . | ρ Ophiuchus . |
|---|---|---|
| Number of members | 701 | 199 |
| Number of dippers | 42 | 22 |
| Percentage of dippers | 5.9 per cent ± 0.9 per cent | 11.0 per cent ±2.3 per cent |
| Number of bursters | 8 | 15 |
| Percentage of bursters | 1.1 per cent ± 0.4 per cent | 7.5 per cent ± 1.9 per cent |
Dipper fractions for the three regions with well-studied dipper populations. The Upper Scorpius association and ρ Ophiuchus cluster have been added in this work. The dipper fraction quoted here is as a function of disc-bearing stars only.
| Region . | Age . | Disc fraction . | Dipper fraction . | Dipper Number . |
|---|---|---|---|---|
| ρ Ophiuchus | 0.1–1 Myr (Luhman & Rieke 1999) | 40.2 per cent ± 4.3 per cent | 20.1|$\,{\rm per \, cent} \pm 4.3\,{\rm per \, cent}$| | 22 |
| NGC 2264 | 1–5 Myr (Rebull et al. 2002)Dahm (2008) | 12.8 per cent ± 1.0 per cent | 21.6|$\,{\rm per \, cent} \pm 3.7\,{\rm per \, cent}$| Cody et al. (2014) | 35 |
| Upper Scorpius | 10 Myr (Pecaut et al. 2012) | 26.7 per cent ± 2.0 per cent | 21.8|$\,{\rm per \, cent} \pm 3.4\,{\rm per \, cent}$| | 42 |
Evolved or transitional discs as highlighted by Luhman & Mamajek (2012) that also exhibit dipper behaviour.
| EPIC ID . | RA . | Dec . | Disc type . |
|---|---|---|---|
| 204187094 | 242.82956 | −23.322251 | evolved |
| 204274743 | 239.37443 | −22.978846 | evolved |
| 204344180 | 243.63696 | −22.703707 | ev or trans |
| 204472612 | 242.14397 | −22.198866 | evolved |
| 204638512 | 241.09023 | −21.507916 | transitional |
| 204757338 | 241.86443 | −20.995618 | evolved |
| 205068630 | 242.79566 | −19.558912 | evolved |
| Spectral type . | Expected dippers . | Observed dippers . |
|---|---|---|
| B | 2.2 ± 0.9 | 0 |
| A | 1.7 ± 0.7 | 0 |
| F | 0.9 ± 0.4 | 0 |
| G | 1.7 ± 0.7 | 0 |
| K | 5.2 ± 1.9 | 14 |
| M | 41.2 ± 14.0 | 39 |
| L | 0.1 ± 0.1 | 0 |
| Spectral type . | Expected dippers . | Observed dippers . |
|---|---|---|
| B | 2.2 ± 0.9 | 0 |
| A | 1.7 ± 0.7 | 0 |
| F | 0.9 ± 0.4 | 0 |
| G | 1.7 ± 0.7 | 0 |
| K | 5.2 ± 1.9 | 14 |
| M | 41.2 ± 14.0 | 39 |
| L | 0.1 ± 0.1 | 0 |
| Spectral type . | Expected dippers . | Observed dippers . |
|---|---|---|
| B | 2.2 ± 0.9 | 0 |
| A | 1.7 ± 0.7 | 0 |
| F | 0.9 ± 0.4 | 0 |
| G | 1.7 ± 0.7 | 0 |
| K | 5.2 ± 1.9 | 14 |
| M | 41.2 ± 14.0 | 39 |
| L | 0.1 ± 0.1 | 0 |
| Spectral type . | Expected dippers . | Observed dippers . |
|---|---|---|
| B | 2.2 ± 0.9 | 0 |
| A | 1.7 ± 0.7 | 0 |
| F | 0.9 ± 0.4 | 0 |
| G | 1.7 ± 0.7 | 0 |
| K | 5.2 ± 1.9 | 14 |
| M | 41.2 ± 14.0 | 39 |
| L | 0.1 ± 0.1 | 0 |
A full description of all targets, including whether they were classified by eye as bursting or dipping, is given in Table A1 in the Appendix. The light curves of all bursters found in this work are shown in Fig. A2 in the Appendix.
7 SUMMARY
Dippers are a subclass of CTTS, so-called because of their frequent drops in flux of 10–50 per cent. In this work, we have used a RF ML classification algorithm to find new dipper candidates within K2 Campaign 2 (K2 C02). We have employed 25 known dippers as a training set and find 70 new dippers in this data set. Our final sample of 95 dippers represents almost a factor of 4 increase in the known population in the two clusters. ML is an efficient approach for the identification of this class of variable star.
The ML algorithm used 25 different, uncorrelated features based solely on light curve metrics. We included standard light curve metrics, GMMs, and wavelet analysis to characterize the light curves. As our training sample was small the algorithm was iterated 200 times to improve robustness. We found from cross-validation that 86 per cent of the dippers from the training sample were retrieved successfully.
Based on IR excesses from WISE, all dippers are consistent with being disc-bearing members of Upper Scorpius and ρ Ophiuchus. We measure the dipper occurrence rate, and find that 5.9 per cent ± 0.9 per cent of members are dippers for Upper Scorpius and 11.0 per cent ± 2.3 per cent of members are dippers for ρ Ophiuchus.
We determine a dipper fraction (defined as the fraction of disc-bearing stars that are also dippers) of 20.1 per cent ± 4.3 per cent for ρ Ophiuchus (age ∼1 Myr) and 21.8 per cent ± 3.4 per cent for Upper Scorpius (age ∼10 Myr). This is similar to the findings of Cody et al. (2014), where a dipper fraction of 21.6 ± 3.7 per cent was found in the young cluster NGC 2264 (age ∼1–5 Myr).
Of our sample, 31 dippers are not catalogued members of either cluster, but are consistent in colour–magnitude space with being a member of either Upper Sco or ρ Oph. We note that with the release of parallax information from Gaia in 2018 the two regions should become much easier to distinguish. This will not only allow us to establish the membership of these unknown dippers but calculate more accurate dipper fractions based on more complete membership lists.
We find that 35 per cent of our dipper sample do not meet the criteria set out in Ansdell et al. (2016b) but are still clustered in the same feature space. Most of these cases were close to the cuts suggested by Ansdell et al. (2016b), but have slightly longer periods or slightly smaller measurements of RDip; we suggest their metric may be too strict. We find further evidence to support a correlation between Ks–W2 and dip depth, suggesting that stars with more material close to the star show deeper dips.
Dippers present an opportunity to study the inner edge of discs around small stars without the use of interferometry. Using our sample of periodic dippers, we are able to estimate the orbital separation of the occulting material as a function of stellar luminosity. If the material is at the inner edge of the disc, we would expect it to have a temperature similar to the sublimation temperature of dust (T ∼ 1300 K). We find the material to be much cooler, with a blackbody temperature of 580|$\pm ^{300}_{120}\, {\rm K}$|. This is consistent with interferometric measurements of T Tauri stars that show the inner edge to be further out than the equilibrium blackbody sublimation radius.
Similarly to Ansdell et al. (2016b) and Stauffer et al. (2015), we find the dipper phenomenon only in late-type (K–M) stars. Based on spectral types from Luhman & Mamajek (2012) and Wilking et al. (2008), we would expect to observe mostly late-type stars in our sample (see Table 11) and few, if any, OBAFG types. This limits our sensitivity to dippers amongst these more massive stars. Additionally, if we assume a rotation period consistent with the average temperature of the dippers as a function of stellar luminosity, the 80 d K2 campaign is too short to observe the dipper phenomenon around early-type stars. F- and G-type dippers may be barely detectable, and B- and A-type dippers will have orbital periods of months or more. Based on this, we cannot rule out the possibility of early-type dippers.
According to Luhman & Mamajek (2012), several of our dippers have evolved disc types (see Table 10 and Fig. 17), with smaller IR excesses than the rest of the sample. These dippers are otherwise identical to the rest of the sample and are not distinguishable in any of the features used in this work. We find no dippers with debris discs or discless dippers, consistent with the theory that the dipper phenomenon is caused by dust in primordial gas-rich discs occulting the star. Similarly, Alencar et al. (2010) find some dippers to be evolved in NGC 2264. As the dipper fraction (of stars with discs) is consistent across three clusters spanning 1–10 Myr in age, and as evolved disc types show no difference in the dipper phenomenon, we suggest that the dipper phenomenon is unaffected by the early stages of disc evaporation.
We find 30 bursters that exhibit brightening events on time-scales of more than a day that are inconsistent with stellar flares due to shape, frequency, and duration. This is similar to findings in the NGC 2264 cluster discussed in Cody et al. (2014) and Stauffer et al. (2014), who suggest that bursters are young disc-bearing objects undergoing accretion events. The census of bursters is likely incomplete in our survey, as there is no specific training set for them. Their identification arose because they cluster similarly in feature space to dippers. The burster fraction (of stars with discs) is 4.3 per cent ± 1.5 per cent for Upper Sco (10 Myr) and 14.3 per cent ± 4.0 per cent for ρ Oph (1 Myr). This suggests that the younger ρ Oph cluster has a higher rate of accretion bursts at the ∼2σ level and that the rate of accretion does reduce as a function of cluster age.
With K2 observations of the Pleiades and Hyades in Campaign 4 and new observations of the Taurus region recently taken in Campaign 13, we will have an opportunity to study more young stars. This will allow us to investigate the dipper fraction over a wider range of ages. Upper Scorpius will also be reobserved in Campaign 15, though coverage will be partial, allowing us to follow up the several dippers found in this work. By expanding the sample of dippers, we aim to understand more about the inner disc region around young stars.
Acknowledgements
We thank Andrea Navas for getting the ball rolling. We thank Sergey Koposov and Benjamin Pope for helpful discussions on ML techniques and data reduction for K2. We thank the reviewer for their thorough and constructive comments. C.H. and S.T.H. acknowledge support from the Science and Technology Facilities Council (STFC) (CH for PhD funding). G.M.K. is supported by the Royal Society as a Royal Society University Research Fellow. This work has made used of data from the 2MASS, Gaia, and WISE surveys. This paper includes data collected by the Kepler/K2 mission. Funding for the Kepler/K2 mission is provided by the NASA Science Mission directorate.
REFERENCES
APPENDIX A: ALL DIPPER AND BURSTER TARGETS
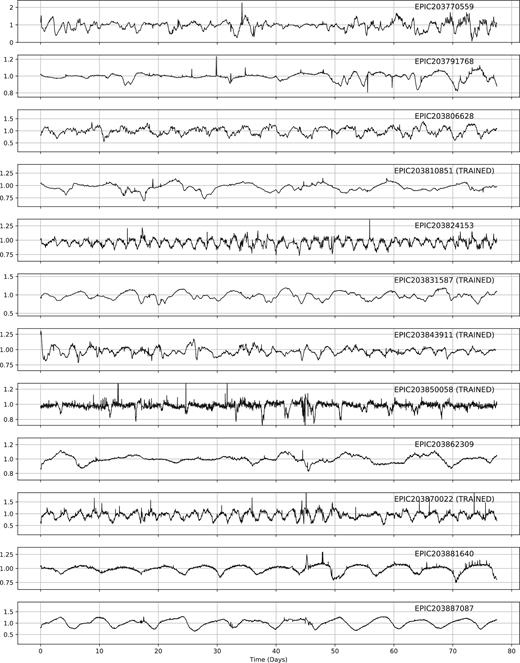
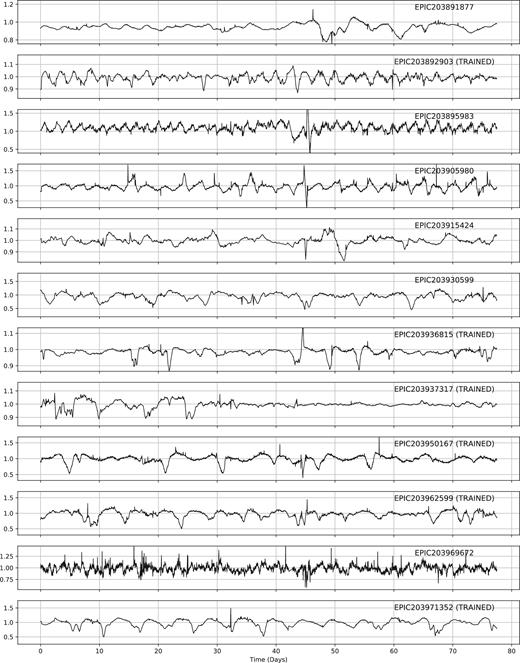
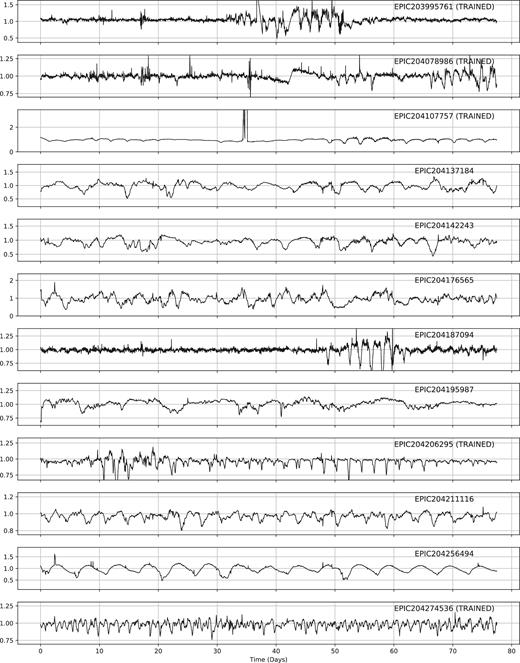
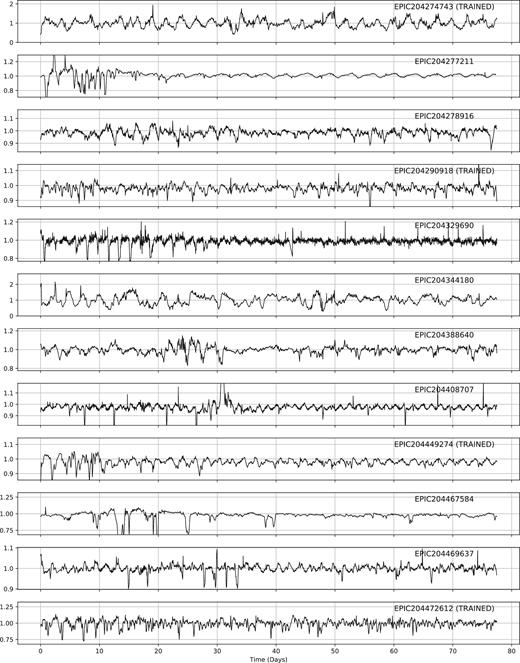
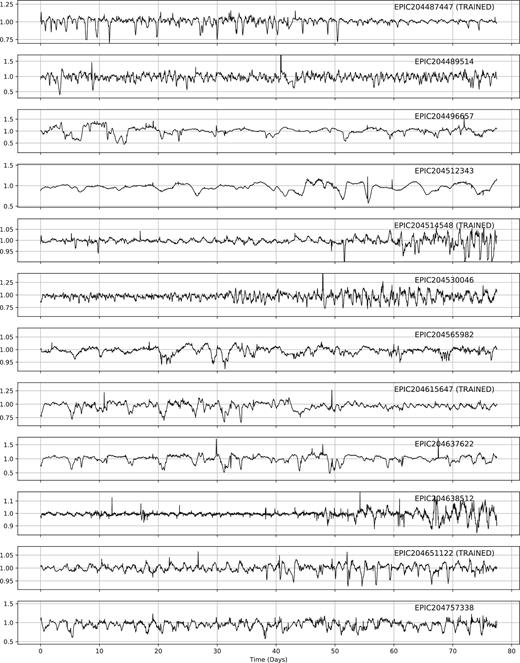
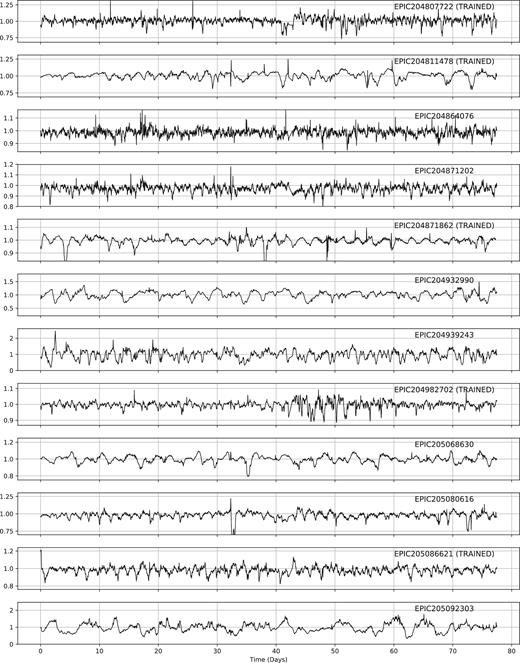
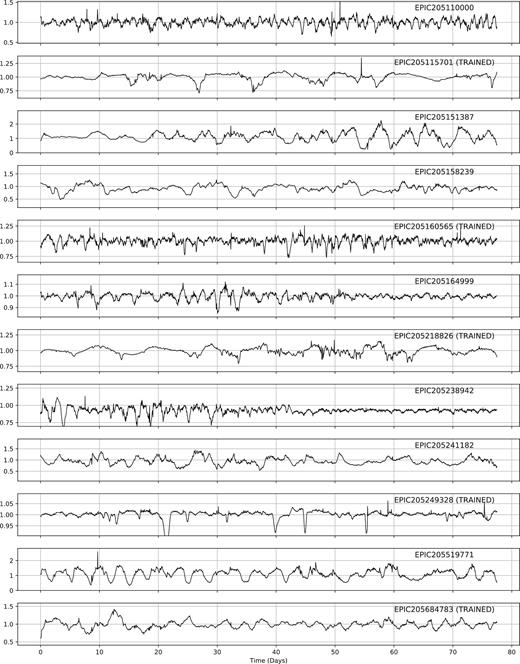
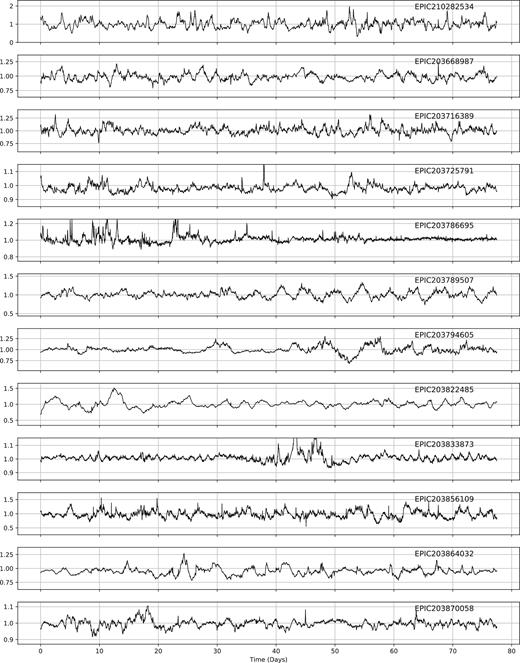
Bursters identified in this work. These are targets that were identified by the machine but have been separated by eye as bursting targets rather than dipping. See Section 6 for details.
| EPIC ID . | RA . | Dec. . | Membership . |
|---|---|---|---|
| 203083616 | 243.71889 | −27.315475 | – |
| 203343161 | 246.23282 | −26.455029 | – |
| 203410665 | 246.41035 | −26.231661 | – |
| 203417549 | 245.39461 | −26.207482 | – |
| 203429083 | 239.26462 | −26.168919 | – |
| 203465909 | 246.95435 | −26.045494 | – |
| 203637940 | 246.61564 | −25.456825 | RO |
| 203712588 | 246.31341 | −25.198359 | RO |
| 203749770 | 246.80307 | −25.067169 | US |
| 203750883 | 243.40213 | −25.063164 | US |
| 203770366 | 243.77187 | −24.99309 | US |
| 203770559 | 246.25882 | −24.992335 | RO |
| 203791768 | 246.82646 | −24.914865 | RO |
| 203806628 | 246.81297 | −24.860783 | RO |
| 203810851 | 239.47685 | −24.845107 | – |
| 203824153 | 247.22528 | −24.795612 | RO |
| 203831587 | 246.29556 | −24.767736 | RO |
| 203843911 | 246.59875 | −24.720513 | RO |
| 203850058 | 246.77748 | −24.696901 | RO |
| 203862309 | 246.92793 | −24.647396 | RO |
| 203870022 | 246.90968 | −24.616274 | RO |
| 203881640 | 246.78794 | −24.568928 | RO |
| 203887087 | 247.05747 | −24.547056 | RO |
| 203891877 | 247.05712 | −24.527538 | RO |
| 203892903 | 245.68921 | −24.52336 | RO |
| 203895983 | 241.0789 | −24.510927 | US |
| 203915424 | 246.86076 | −24.431774 | RO |
| 203930599 | 246.9178 | −24.367814 | RO |
| 203936815 | 246.67857 | −24.341642 | RO |
| 203937317 | 246.57117 | −24.339449 | RO |
| 203950167 | 245.78846 | −24.284773 | RO |
| 203962599 | 246.73655 | −24.230991 | RO |
| 203969672 | 246.78781 | −24.200216 | RO |
| 203971352 | 247.05298 | −24.193214 | RO |
| 203995761 | 247.06973 | −24.087296 | RO |
| 204078986 | 242.03105 | −23.751549 | US |
| 204107757 | 239.00434 | −23.635588 | US |
| 204137184 | 240.52158 | −23.518595 | – |
| 204142243 | 245.60399 | −23.49863 | RO |
| 204176565 | 245.57722 | −23.36339 | RO |
| 204187094 | 242.82956 | −23.322251 | US |
| 204195987 | 245.68725 | −23.287067 | RO |
| 204206295 | 246.69764 | −23.247469 | – |
| 204211116 | 245.42498 | −23.228676 | RO |
| 204256494 | 246.15225 | −23.050051 | – |
| 204274536 | 245.88681 | −22.979681 | RO |
| 204274743 | 239.37443 | −22.978846 | US |
| 204277211 | 240.42029 | −22.969607 | US |
| 204278916 | 240.53157 | −22.963025 | US |
| 204290918 | 245.32701 | −22.916067 | RO |
| 204329690 | 245.50811 | −22.761395 | – |
| 204344180 | 243.63696 | −22.703707 | US |
| 204388640 | 240.51791 | −22.529692 | US |
| 204408707 | 245.09545 | −22.45115 | – |
| 204449274 | 245.59001 | −22.291862 | US |
| 204467584 | 242.82111 | −22.219075 | US |
| 204469637 | 245.02565 | −22.210701 | US |
| 204472612 | 242.14397 | −22.198866 | US |
| 204487447 | 242.62791 | −22.139708 | – |
| 204489514 | 240.75673 | −22.131222 | US |
| 204496657 | 239.27675 | −22.101694 | US |
| 204512343 | 239.3379 | −22.036949 | – |
| 204514548 | 239.16676 | −22.027779 | – |
| 204530046 | 242.70879 | −21.963379 | – |
| 204565982 | 246.78925 | −21.812695 | US |
| 204615647 | 243.3413 | −21.603808 | US |
| 204637622 | 241.08741 | −21.511577 | US |
| 204638512 | 241.09023 | −21.507916 | US |
| 204651122 | 243.09541 | −21.454407 | – |
| 204757338 | 241.86443 | −20.995618 | US |
| 204807722 | 239.25609 | −20.771812 | – |
| 204811478 | 238.98336 | −20.755199 | US |
| 204864076 | 240.9903 | −20.518229 | US |
| 204871202 | 242.25299 | −20.485743 | US |
| 204871862 | 241.75707 | −20.482767 | US |
| 204932990 | 242.9622 | −20.202746 | US |
| 204939243 | 243.88417 | −20.173256 | US |
| 204982702 | 242.46694 | −19.968491 | – |
| 205068630 | 242.79566 | −19.558912 | US |
| 205080616 | 242.09685 | −19.500266 | US |
| 205086621 | 242.93893 | −19.470343 | US |
| 205092303 | 242.33561 | −19.442186 | US |
| 205110000 | 243.93404 | −19.354803 | US |
| 205115701 | 242.52257 | −19.32674 | US |
| 205151387 | 242.25317 | −19.147971 | US |
| 205158239 | 243.5846 | −19.113386 | US |
| 205160565 | 243.58712 | −19.101454 | – |
| 205164999 | 243.25979 | −19.079185 | US |
| 205218826 | 242.40225 | −18.800259 | US |
| 205238942 | 241.69976 | −18.695508 | US |
| 205241182 | 242.69317 | −18.683298 | US |
| 205249328 | 242.88061 | −18.640545 | US |
| 205519771 | 241.80841 | −17.045187 | US |
| 205684783 | 248.53822 | −15.804683 | – |
| 210282534 | 246.74378 | −24.76024 | RO |
Bursters identified in this work. Note bursters were not a trained class and this sample is likely incomplete.
| EPIC ID . | RA . | Dec. . | Membership . |
|---|---|---|---|
| 203668987 | 246.57672 | −25.348854 | RO |
| 203716389 | 246.32199 | −25.184946 | RO |
| 203725791 | 240.37096 | −25.151953 | US |
| 203786695 | 246.24892 | −24.933565 | RO |
| 203789507 | 239.27043 | −24.922976 | – |
| 203794605 | 247.59752 | −24.90448 | RO |
| 203822485 | 246.84569 | −24.801971 | RO |
| 203833873 | 246.74345 | −24.758829 | RO |
| 203856109 | 242.46659 | −24.67214 | – |
| 203864032 | 246.70408 | −24.640345 | RO |
| 203870058 | 247.06878 | −24.616106 | RO |
| 203889938 | 241.85937 | −24.535546 | US |
| 203899786 | 246.35149 | −24.49577 | RO |
| 203905576 | 246.57862 | −24.472137 | RO |
| 203905625 | 247.18861 | −24.471941 | RO |
| 203912674 | 246.41492 | −24.443031 | RO |
| 203928175 | 247.09718 | −24.378053 | RO |
| 203954898 | 246.65344 | −24.264414 | RO |
| 204161056 | 246.42873 | −23.424052 | RO |
| 204233955 | 241.87311 | −23.139515 | US |
| 204342099 | 243.89405 | −22.711803 | US |
| 204347422 | 244.96421 | −22.690742 | – |
| 204360807 | 245.48918 | −22.638388 | – |
| 204395393 | 240.07679 | −22.50318 | US |
| 204440603 | 243.59637 | −22.326067 | US |
| 204607034 | 240.67302 | −21.640156 | US |
| 204830786 | 241.99149 | −20.669079 | US |
| 204906020 | 241.75883 | −20.327436 | US |
| 205008727 | 244.89878 | −19.845192 | – |
| 205061092 | 243.71577 | −19.594519 | – |


