


Abstract
We report the detection of CO(1–0) line emission from seven Planck and Herschel selected hyper luminous (|${L_{\rm IR (8{\rm -}1000{\mu m})} > 10^{13}\,\, {\rm L}_{{\odot }} }$|) infrared galaxies with the Green Bank Telescope (GBT). CO(1–0) measurements are a vital tool to trace the bulk molecular gas mass across all redshifts. Our results place tight constraints on the total gas content of these most apparently luminous high-z star-forming galaxies (apparent IR luminosities of LIR > 1013 − 14 L⊙), while we confirm their predetermined redshifts measured using the Large Millimeter Telescope, LMT (zCO = 1.33–3.26). The CO(1–0) lines show similar profiles as compared to Jup = 2–4 transitions previously observed with the LMT. We report enhanced infrared to CO line luminosity ratios of |$\langle L_{\rm IR} / L^{\prime }_{\rm CO(1{\rm -}0)} \rangle \ = 110 \pm 22 {\, }\,\, {\rm L_{{\odot }} (K {\, } km {\, } s^{-1} {\, } pc^{-2})^{-1} }$| compared to normal star-forming galaxies, yet similar to those of well-studied IR-luminous galaxies at high-z. We find average brightness temperature ratios of 〈 r21〉 = 0.93 (2 sources), 〈 r31〉 = 0.34 (5 sources), and 〈 r41〉 = 0.18 (1 source). The r31 and r41 values are roughly half the average values for SMGs. We estimate the total gas mass content as |${\rm \mu M_{H2} = (0.9{\rm -}27.2) \times 10^{11} (\alpha _{\rm CO}/0.8){\, }{\rm M}_{{\odot }}}$|, where μ is the magnification factor and αCO is the CO line luminosity to molecular hydrogen gas mass conversion factor. The rapid gas depletion times, |${\rm \langle \tau _{\rm depl} \rangle = 80}$| Myr, reveal vigorous starburst activity, and contrast the Gyr depletion time-scales observed in local, normal star-forming galaxies.
1 INTRODUCTION
Most of the stars in the local universe formed out of tremendous cool gas reservoirs (Mgas ∼ 1010 − 11 M⊙, T ∼ 10–100 K) in the interstellar medium (ISM) of high redshift (1 < z < 3.5) galaxies with intense star formation (SF) (Carilli & Walter 2013; Madau and Dickinson, 2014).
Massive, dusty star forming galaxies at high-z (DSFGs; Mdust ∼ 108 − 9 M⊙) are typically gas-rich galaxies selected via their bright observed (sub)-mm fluxes (also known as SMGs). The rest-frame far-IR (FIR)-mm luminosity associated with the thermal dust emission (Efstathiou, Rowan-Robinson & Siebenmorgen 2000; Johnson et al. 2013) (re-radiated far-UV radiation) traces the total SF activity, while the extreme star-formation rates (SFRs) in these IR luminous galaxies are likely due to a sustained supply of cool gas from the intergalactic medium (IGM). The dense molecular ingredients of the ISM thereby limits the time-scale for extended starburst (SB) activity, with short-lived SB episodes of 10’s–100’s of Myr. These are believed to often include gas-rich mergers that induce SF via tidal torques, which drive gas infall and subsequent collapse (Hernquist 1992). The most active SB galaxies at z ∼ 2 contribute key insights into galaxy evolution and structure formation, as their massive gas reservoirs play a key role in the bulk stellar mass growth in their ISM environments, and as a result are believed to be the progenitors to massive elliptical/spheroidal galaxies and clusters at low-z (Casey, Narayanan & Cooray 2014).
The SMG population can be accounted for by major- or minor-merger dominated SBs (Baugh et al. 2005; Swinbank et al. 2008) in some semi-analytic models. Others suggest that the observed population is a heterogeneous mix of early and late stage major mergers and blending of passive star-forming disc galaxies. The brightest SMGs are likely early-stage mergers, exchanging a significant amount of molecular material for continued SF (Hayward et al. 2012; Narayanan et al. 2015). SMGs typically have high gas mass fractions, Mgas/M⋆, up to 80 per cent (Carilli & Walter 2013).
CO line measurements are vital for directly probing the fuel for these star-forming galaxies, i.e. the total molecular gas mass, at the peak of the comoving SFR density (z ∼ 2–3). The gas accretion history of growing dark matter (DM) haloes in cosmological simulations (Kereš et al. 2005) agrees well with the observed evolution of the CO luminosity function, as Decarli et al. (2016a) find a peak redshift for CO luminous galaxies at z ∼ 2, comparable to the peak of the comoving SFR density.
The CO (J = 1 → 0) transition accounts for both the dense and most diffuse molecular gas, and has traditionally been calibrated to trace the bulk H2 gas mass (via collisional excitation with the H2 gas). The observed CO line luminosity, L’CO, to H2 mass conversion factor, αCO, (Carilli & Walter 2013; Bolatto, Wolfire & Leroy 2013), is calibrated to this transition, making observations of CO(1–0) important for determining the total H2 mass content at high-z.
The number of high-z sources with galaxy integrated CO(1–0) detections is sparse (see Carilli & Walter 2013; Scoville et al. 2017), although it is accumulating (e.g. Carilli et al. 2002; Hainline et al. 2006; Riechers et al. 2011; Harris et al. 2012; Thomson et al. 2012; Aravena et al. 2013; Fu et al. 2013; Riechers et al. 2013; Decarli et al. 2016a,b; Sharon et al. 2016; Huynh et al. 2017), with approximately 60 to date. Resolved imaging of this lowest rotational transition of CO (e.g. Lestrade et al. 2011; Riechers et al. 2011) in high-z SMGs indicates that the total molecular gas can extend up to 30 kpc for merging systems.
Only the most active star forming sources with apparent LIR ≥ 1012–14 L⊙ at z > 1 can be observed at this fundamental CO rotational transition. These apparent luminosities are often due to strong lensing. The strong lensing effect (usually with magnification factor, μ = 10 − 30X) (e.g. Bussmann et al. 2013, 2015; Geach et al. 2015; Spilker et al. 2016), yields shorter integration times to provide secure detections of the molecular gas in both strongly lensed, intrinsically bright and faint, but highly magnified, normal star-forming systems.
The far-IR/sub-mm Herschel Astrophysical Terahertz Large Area Survey (H-ATLAS) (Eales et al. 2010) and the Herschel Multi-tiered Extragalactic Survey (HerMES) (Oliver et al. 2012), together covering about 650 |${\rm \deg }^{2}$|, and the 2500 |${\rm \deg }^{2}$| mm South Pole Telescope (SPT; Carlstrom et al. 2011) have paved the way forward in discovering a rare population of gravitationally lensed DSFGs (e.g. Negrello et al. 2010, 2017; Planck Collaboration VII 2011; Vieira et al. 2013; Wardlow et al. 2013; Weiß et al. 2013), as well as an intrinsically bright, unlensed population. Cañameras et al. (2015) and Harrington et al. (2016) have exploited the all-sky sensitivity of Planck to find the most luminous high-redshift galaxies currently known in the Planck era – all of which are gravitationally lensed (also Combes et al. 2012; Fu et al. 2012; Herranz et al. 2013).
Here, we present galaxy integrated, CO(1–0) measurements of seven z >1 galaxies using the Green Bank Telescope (GBT). This is a pilot study for a larger program to identify a large sample of extremely luminous high-z SMGs identified by the all-sky Planck survey. In our original pilot study leading to the sample in this work, our goal was to identify sources that have the probability to be gravitationally lensed given their high flux densities in the three SPIRE bands of 250, 350, and 500μm (e.g. the |${\rm S_{500} {\, } {\rm or} {\, } S_{350} \ge 100 {\, } mJy}$| Negrello et al. 2010; Ivison et al. 2011). We have previously obtained one Jup = 2–4 transition for all seven of the sources presented in this study using the Redshift Search Receiver (RSR) on the LMT. The majority of these sources have apparent μLIR > 1014.0 − 14.5 L⊙ making them some of the most luminous sources currently known (Cañameras et al. 2015; Harrington et al. 2016). Our goals in this study are to confirm the LMT CO redshift, measure the CO(1–0) line emission to constrain our estimate of the H2 masses and begin analysing the CO spectral line energy distributions (CO SLEDs). In Section 2, we review our sample selection and previous observations described in detail in Harrington et al. (2016), and in Section 3 we outline our CO(1–0) observations using the VErsatile GBT Astronomical Spectrometer (VEGAS) instrument on the GBT. Measured and derived gas properties using the CO(1–0) line emission and supplementary LMT CO data is found in Section 4, followed by a discussion in Section 5. Finally, we conclude our study in Section 6. We adopt a Λ CDM cosmology with H0 = 70 km s−1 Mpc−1 with Ωm = 0.3, and ΩΛ = 0.7 throughout this paper.
2 SAMPLE
In a search for the most extreme, and thus rare, star-forming galaxies at z > 1, we exploit the full-sky sub-mm coverage offered by the the Planck Catalog of Compact Sources (PCCS). The highest frequency observed by Planck (857 GHz / 350 μm) contains a data set of ∼24 000 point source objects (Planck Collaboration XXVIII 2014). From this data set, we limit our searches to point sources at Galactic latitude |b| > 30° to minimize the Galactic source contamination. This filtered sample is then cross-correlated with the combined catalogues of three Herschel large area surveys: Herschel Multi-tiered Extragalactic Survey (HerMES; Oliver et al. 2012), Herschel Stripe 82 Survey (HerS-82, Viero et al. 2014), and the dedicated Planck follow-up Herschel DDT ‘Must-Do’ Programme: ‘The Herschel and Planck All-Sky Source Snapshot Legacy Survey’.
The details of our selection method can be found in Harrington et al. (2016) for the Planck–Herschel counterparts with S350 ≥ 100 mJy in our initial follow-up during the Early Science Campaign 2 for the LMT. In brief, we cross-matched Planck–Herschel counterparts within 150 arcsec. In total, there were 350 Herschel counterparts to 56 Planck sources within 150 arcsec. The higher spatial resolution of Herschel allowed us to pinpoint the position of the Planck point sources, enabling follow up studies.
For 8/11 galaxies observed with the LMT we detected a single, compact source using the AzTEC 1.1 mm camera. Subsequently, we detected a strong CO line with the RSR spectrometre. We make use of the three SPIRE bands of Herschel (250, 350, 500 μm) and the additional LMT observations to derive apparent μLIR > 1013.0–14.5 L⊙ at zCO = 1.33–3.26 (see Table 2). The current sample in this GBT study consists of observations of only seven of the original eight targets.
3 GBT OBSERVATIONS
Based on our RSR spectroscopy, two of our sources have redshifted CO(1–0) (i.e. rest-frame 115.27 GHz) line emission in the range of the Q-band receiver (38.2–49.8 GHz) on the GBT. The other five sources fall within the Ka band receiver (26.0–40 GHz). We used the low-resolution 1500 MHz bandwidth mode of the backend spectrometer, VEGAS. The raw channel resolution corresponds to 1.465 MHz, or ∼16 km s−1 in Ka band, using 1024 channels. Observations between 2016 February and March, took place in typical weather conditions. For both Q- and Ka-band observations, we used a SubBeamNod procedure, nodding the 8 m GBT sub-reflector every 6 s between each receiver feed for an integration time of 4 min. In most cases, this 4 min procedure was repeated continuously for up to an hour to achieve the ON source integration times presented in Table 1. The atmosphere becomes highly variable at the frequencies within Q and Ka band, therefore we observed pointing sources roughly every hour. The routine pointing and focus procedures allowed us to assess the best azimuth and elevation corrections, as well as the best focus values for the peak line strength measurements.
Sources and GBT observations summary.
| Source ID | RA | DEC | μLIRa | GBT RX | Dates | Int. time (on-source) | 〈 Tsys〉 |
|---|---|---|---|---|---|---|---|
| J2000 | J2000 | (1014L⊙) | 2016 | mins | K | ||
| PJ142823.9 | 14h28m23.9s | +35d26m20s | 0.19 ± 0.04 | Q | 2/12;2/19 | 336 | 100 |
| PJ160722.6 | 16h07m22.6s | +73d47m03s | 0.14 ± 0.03 | Q | 2/12;2/19 | 216 | 75 |
| PJ105353.0 | 10h53m53.0s | +05d56m21s | 2.9 ± 0.4 | Ka | 3/30 | 100 | 40 |
| PJ112714.5 | 11h27m14.5s | +42d28m25s | 1.1 ± 0.2 | Ka | 3/30 | 84 | 40 |
| PJ120207.6 | 12h02m07.6s | +53d34m39s | 1.4 ± 0.3 | Ka | 3/30 | 80 | 40 |
| PJ132302.9 | 13h23m02.9s | +55d36m01s | 1.2 ± 0.2 | Ka | 3/30 | 96 | 40 |
| PJ160917.8 | 16h09m17.8s | +60d45m20s | 2.0 ± 0.4 | Ka | 3/26 | 92 | 35 |
Notes. Q-band receiver frequency coverage: 38.2–49.8 GHz. Ka band receiver frequency coverage: 26.0–40 GHz.
aLIR is the far- luminosity integrated between 8 and 1000 μm.
After total-power switching for the standard |${\rm (ON{\rm -}OFF)/OFF}$| GBTIDL calculations, we include the observatory’s atmospheric model, which tracks zenith opacity as a function of frequency and time. Each scan is corrected for the atmospheric time and frequency variations on the sky, given zenith opacity τsky and elevation, EL: |${T_{{\rm antenna}} = T_{{\rm sys}} \times e^{\frac{\tau _{{\rm sky}}}{{\rm sin}({\rm EL})}} \times \frac{({\rm ON-OFF})}{{\rm OFF}} }$|. The elevation ranges for Q and Ka band spanned |$33{\rm -}84 \deg$| and |$28{\rm -}73 \deg$|, respectively. The typical Tsys values ranged from 67 to 134 K in Q band, and 30–45 K in Ka band. To convert the measured antenna temperature in |$T_{\rm A}^{*}$| to flux density, we use the calibration factor derived for GBT: Q-band scales as 1 K/1.7 Jy, Ka band as 1 K/1.6Jy.
We used a high-pass filter to remove very low frequency ripples in the overall baseline without removing the line emission. The width of the high-pass filter was at least twice the expected full-width at half-maximum (FWHM) of the CO line based on our LMT RSR spectra. We utilized Gaussian smoothing to decrease the resolution by a factor of 4, resulting in a 5.86 MHz (∼50 km s−1 for Ka) channel resolution. In this smoothing step, each channel was treated as independent to avoid correlations in the noise of neighbouring channels. As the high-pass filter removes the low-frequency ripples, and not the mid-frequency baseline ripples, we then fit and remove a baseline (npoly = 2–3) to the emission free regions of the spectra. The resulting spectra can be seen in Fig. 1. We adopt a 30 per cent total uncertainty given a 15–20 per cent flux calibration error, typical 5–10 per cent pointing/focus drifts and atmospheric losses and a conservative 10–15 per cent for the baseline removal due to the variations across the bandpass at the observed frequencies.

The RSR CO spectra (yellow) for all seven galaxies (Harrington et al. 2016) are scaled by |${\rm J_{\rm up}^{2}}$| and overlaid (red) on to the GBT CO spectra (yellow) in this study. The comparable line widths and spectral features are coincident. PJ160918 has both its CO(4–3) and (3–2) lines compared to the (1–0) line emission.
4 RESULTS: CO (1–0) LINE PROPERTIES
We detect CO(1–0) at |${\rm S_{\rm peak}/N_{\rm channel} > 7}$| from each of our seven targets at the expected redshifts. We first derive the observed central frequency by fitting a single Gaussian to the CO(1–0) line emission, confirming the exact redshifts of these Planck–Herschel identified galaxies, which had previously been derived using only one CO line from the LMT (Table 2). The spectroscopic redshifts span from 1.33 < z < 3.26. Our new GBT measurements further support our previous redshift determinations from the combination of panchromatic photometry (WISE-11 and 22 μm, Herschel SPIRE 250, 350, and 500 μm, AzTEC 1100 μm and NVSS/FIRST radio) and single CO line observations (see Appendix A of Harrington et al. 2016).
Summary of CO(1–0) VEGAS measurements.
| ID | νobs | zCO(1–0) | ΔV | SΔVa | Sν | |$\mu L^{\prime }_{{\rm CO}}$| |
|---|---|---|---|---|---|---|
| (GHz) | (km s−1) | (Jy km s−1) | Peak (mJy) | (1010 K km s−1 pc2) | ||
| PJ105353.0 | 28.7712 | 3.0053 ± 0.00016 | 738 ± 38 | 4.3 ± 1.3 | 6.2 ± 1.9 | 170 ± 60 |
| PJ112714.5 | 35.6248 | 2.2352 ± 0.00006 | 736 ± 20 | 7.4 ± 2.2 | 9.3 ± 2.8 | 178 ± 63 |
| PJ120207.6 | 33.4970 | 2.442 ± 0.00007 | 602 ± 21 | 5.5 ± 1.7 | 8.9 ± 2.7 | 154 ± 55 |
| PJ132302.9 | 33.7350 | 2.4165 ± 0.00006 | 540 ± 17 | 4.7 ± 1.4 | 8.4 ± 2.5 | 129 ± 46 |
| PJ142823.9 | 49.5766 | 1.3254 ± 0.00005 | 436 ± 25 | 1.2 ± 0.4 | 2.9 ± 0.9 | 11 ± 4 |
| PJ160722.6 | 46.4115 | 1.4838 ± 0.00006 | 374 ± 27 | 1.0 ± 0.3 | 2.4 ± 0.7 | 12 ± 4 |
| PJ160917.8 | 27.0911 | 3.2567 ± 0.00014 | 705 ± 31 | 7.6 ± 2.3 | 9.8 ± 2.9 | 343 ± 121 |
Notes. |$T_{\rm A}^{*}$| to flux density using the GBT: Q-band is 1 K/1.7 Jy, Ka band is 1 K/1.6 Jy. The reported redshifts correspond to the values obtained after velocity offset corrections. The line widths reported indicate the FWHM values after correcting for the instrumental resolution. This correction was on average less than 1 per cent due to large observed line widths.
aThe integrated value obtained within the interval of ±1500 km s−1from the centre.
We find that the CO(1–0) lines show nearly identical profiles and widths as the Jup = 2 − 4 CO lines, with FWHM = [375–740 km s−1] (see Fig. 1). It is unlikely that there is a significant amount of gas that excites the CO(1–0) but not, e.g. the CO(3 − 2). Therefore, the similar line emission FWHM and line profiles suggests that both transitions are tracing co-spatial volumes.
5 DISCUSSION
5.1 CO spectral line energy distributions
In Fig. 2, we plot the ratio of the line integrated intensity of the higher J CO SCOΔV to our CO(1–0) SCOΔV. All of our galaxies show sub-thermalized excitation conditions. Up to J ≤ 3, we find these values to be consistent with both the lower end of the SMG excitation distribution (Bothwell et al. 2013; Carilli & Walter 2013) and the upper end of the MW (Fixsen et al. 1999). The uncertainty of the MW measurements and the physical intrinsic SMG dispersion overlap for J ≤ 4. Without higher J CO lines, where SMGs and the MW differ strongly, it is a challenge to disentangle which of these two ISM conditions dominate our galaxies.
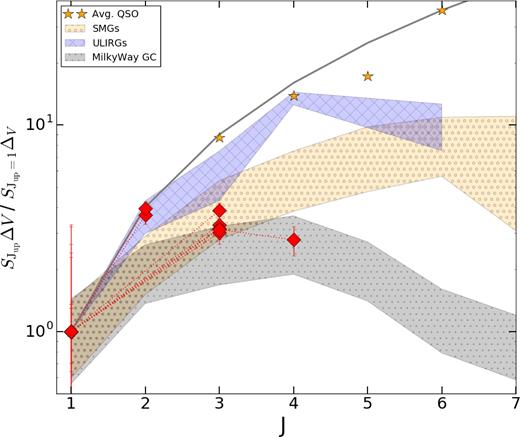
Here, we plot the velocity-integrated line intensity ratios of Jup/J = 1, normalized to the CO(1–0) derived integrated flux for the current sample. Our seven galaxies (red diamonds) are within the spread for average SMGs (Bothwell et al. 2013) (yellow), and can be compared to the low-z (U)LIRG population (Papadopoulos et al. 2012) (blue), and the Milky Way centre (Fixsen, Bennett & Mather 1999) (grey). All regions contain the dispersion between the 25th and 75th percentile of the distribution of the CO(1–0) normalized integrated flux. Yellow stars show the average QSO values out to J = 6 (Carilli & Walter 2013).
In Harrington et al. (2016), we showed that all of these sources fall within the parameter space for SF powered luminosity (rather than AGN) in a mid-IR to far-IR colour–colour diagnostic plot (Kirkpatrick et al. 2013). Using their CO SLED, we can further rule out the presence of a powerful QSO in our galaxies, as typical QSO host galaxies with powerful AGN activity often exhibit thermalized line ratios out to |${\rm CO(4{\rm -}3)}$| (e.g Riechers et al. 2006; Weiss et al. 2007). However, we caution that most QSO hosts with a good coverage in the CO SLED are strongly lensed objects selected in the optical/NIR. This may result in a bias towards the excitation conditions within the central region. Sharon et al. (2016) show there is a statistical similarity between the r31 values reported for SMGs and AGN in their sample. However, the line ratios in their sample have a global average (AGN and SMG) three times higher for r31 (in fact close to thermalized: 〈r31〉 = 0.9) as compared to our sources. This suggests that their sample might consist of hybrid SMG/AGN galaxies. Our CO SLEDs are currently limited out to J = 3 or 4, therefore we cannot rule out the presence of an AGN.
5.2 Ratio of IR luminosity to CO line luminosity
The observable |${\mu L_{{\rm IR}} / \mu L^{\prime }_{{\rm CO}(1{\rm -}0)}}$| ratio serves as a proxy for SF efficiency (SFE), and stands independent of the unknown magnification factor. 1 The integrated IR emission (8–1000 μm) reflects the bulk star-forming activity, while the CO line luminosity indicates the amount of gas supplying the ongoing SF.
Using the value of this ratio, we place our sample in the context of SB versus typical star-forming galaxies at different z, IR and CO line luminosity (Fig. 3; e.g. Genzel et al. 2010). We measure the |${\mu L_{\rm {IR}} / \mu L^{\prime }_{\rm {CO}(1{\rm -}0)}}$| ratio as |${\rm (58{\rm -}170) {\, } {\rm L}_{\odot } / (K {\, } km {\, }s^{-1} pc^{2})}$|, with |${\rm \langle \ 110 \pm 22 \rangle {\, } {\rm L_{\odot }} / K}$| km s−1pc−2 (see Fig. 3). The average value of our galaxies is closer to 140 L⊙/(K km s−1pc2) observed in SB galaxies, rather than 30 L⊙/(K km s−1pc2) observed in typical star-forming galaxies (Solomon & Vanden Bout 2005; Genzel et al. 2010; Frayer et al. 2011). From this, we conclude that the |$L_{{\rm IR}} / L^{\prime }_{{\rm CO}(1{\rm -}0)}$| values obtained for this subset of Planck–Herschel sources have enhanced ratios with respect to typical star-forming galaxies, as expected from their large apparent LIR (Cañameras et al. 2015; Harrington et al. 2016).
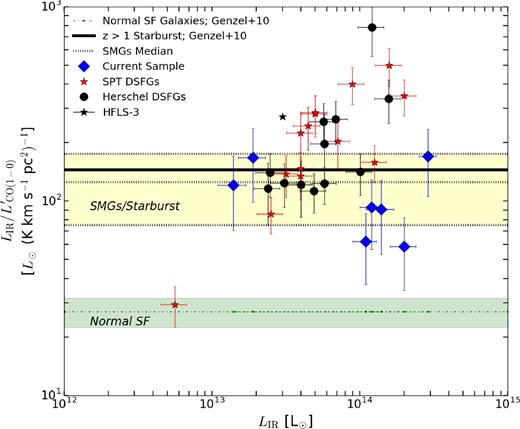
Here, we present the |${L_{\rm {IR}} / L^{\prime }_{\rm {CO}(1{\rm -}0)}}$| ratios of our sample compared with known, lensed Herschel and SPT DSFGs (Harris et al. 2012; Aravena et al. 2016), the highly excited HFLS-3 (Riechers et al. 2013) and the median for all SMGs (|${\rm 125 \pm 50 {\, }{\rm L}_{\odot } / K {\, }km {\, }s^{-1}\, pc^{-2} }$|) compiled in the literature by Frayer et al. (2011) (shaded yellow). We plot 2σ boundaries taken from Genzel et al. (2010) for SB (140 L⊙/K km s−1 pc−2) and typical star-forming galaxies (30 L⊙/K km s−1 pc−2). The average for our seven targets in this study is |${\rm 110 \pm 22 {\, } {\rm L}_{{\odot }} / (K{\, } km {\, }s^{-1}\, pc^{2})}$|.
We note that our sample exhibits slightly lower ratios on average compared to both the highly excited system, HFLS-3 (z ∼ 6; Riechers et al. 2013), as well as the lensed SPT DSFGs (Aravena et al. 2016) (Fig. 3). Roughly half of the strongly lensed, dusty Herschel galaxies (Harris et al. 2012) are consistent with our sample and lie within the yellow shaded region for SB systems. In contrast, more than half of the SPT sources have excess LIR-to-|$L^{\prime }_{{\rm CO}(1{\rm -}0)}$| Aravena et al. (2016), although the dispersion is similar for both H-ATLAS and SPT samples. Our seven Planck–Herschel sample are unusual as they lack a similar dispersion. This may reflect the ability of the all-sky sub-mm sensitivity and coverage of the Planck survey in detecting the rare galaxies that are, on average, more strongly lensed than the similarly selected H-ATLAS sample.
While the SPT lensed galaxies are a similar population at high-z with comparable LIR, due to different selection methods (350 μm versus mm), the average redshift of their sample is significantly shifted towards a higher value compared to our sample: 〈 z〉 = 3.9 and 〈 z〉 = 2.3, respectively. At such a high redshift, z ∼ 4, a MW type galaxy would be subject to non-negligible dust heating due to the CMB (da Cunha et al. 2013), and may contribute to the higher LIR-to-|$L^{\prime }_{{\rm CO}(1-0)}$| values observed in the SPT sample. At z ∼ 4, the CMB temperature is also a sufficient background to radiatively excite the cool reservoirs of CO, particularly the J =1 → 0 ground state rotational transition, resulting in a dimming of the observed CO line emission. Because (sub)-mm flux measurements are made against the CMB, the contrast in the CO (1–0) line integrated intensity via collisional excitation (typically with H2 molecules), compared with the radiatively excitated CO gas from the CMB background becomes more severe beyond z = 4. About 80 per cent of the CO (1 − 0) emission can be recovered against the CMB at z = 2–3, but only 50–60 per cent just beyond z = 4 if there would be a gas kinetic temperature of 40 K (da Cunha et al. 2013).
We caution that the effects of the CMB alone cannot account for the differences observed in these luminosity–luminosity ratios, as the H-ATLAS and SPT sample have a similar spread in their LIR-to-|$L^{\prime }_{{\rm CO}(1{\rm -}0)}$| values. The similar redshift range of the 12 H-ATLAS sample compared to the sample of seven Planck–Herschel galaxies in this study reveals that the CMB effects cannot explain this offset. The excitation conditions of a multiphase, multiple gas component ISM are also expected to change for each galaxy. One would expect that the density and kinetic temperature of the CO (1–0) emitting gas (and the gradients across the galaxy) to factor into the total attenuation of the CO (1–0) line emission (Tunnard & Greve 2016, 2017) and any self-shielding. As the intense star-forming conditions during the redshifts indicated in these three samples (SPT, H-ATLAS, Planck–Herschel) will give rise to a dynamic set of ISM conditions, these varying gas excitation conditions will therefore have non-negligible effects in the observed LIR-to-|$L^{\prime }_{{\rm CO}(1{\rm -}0)}$| values.
5.3 Total gas mass from |$L^{\prime }_{{\rm CO}(1{\rm -}0)}$|
CO is the second most abundant molecule in the ISM after the highly abundant molecular hydrogen, H2, and the CO(1–0) line emission is the most direct proxy for H2 as it traces even the most diffuse gas. Our galaxy integrated CO(1–0) line luminosity is converted to a total molecular gas mass assuming an αCO conversion factor (see review by Bolatto et al. 2013). It is common to use a standard ULIRG conversion, i.e. αCO = 0.8, for star bursting SMG/DSFGs at high-z, although we reference a standard Galactic value in Table 3. The similarity of the |${L_{{\rm IR}} / L^{\prime }_{{\rm CO}(1{\rm -}0)}}$| ratios observed in our sample and those of local ULIRGs seems to further support the use of a SB-like αCO conversion factor, even if the centrally compact, concentrated nuclei in local ULIRGs may not be representative of the entire ISM environments in our galaxies. We found |$\mu M_{\rm H_2} = (0.9-27.4) \times 10^{11}\, {\rm M_{\odot } (\alpha _{\rm CO}/0.8)}$|, which are amongst the largest apparent gas contents measured at high-z, even if a lensed magnification of an order of magnitude is taken into account (see Carilli & Walter 2013).
Gas properties.
| ID | |$L({\rm IR}) / L^{\prime }_{\rm CO(1{\rm -}0)}$| | rup, 1 | μMISM | μMH2 | τdepl–CO | τdepl–ISM |
|---|---|---|---|---|---|---|
| L⊙/(K km s−1 pc2) | (1010 M⊙) | (αCO4.3, 0.8)(1010 M⊙) | (αCO4.3, 0.8) (Myr) | (Myr) | ||
| PJ105353.0 | 170 ± 65 | 0.36 ± 0.13[r31] | 624 ± 156 | [732, 136] ± [259, 54] | [239, 44] | 203 |
| PJ112714.5 | 62 ± 25 | 0.29 ± 0.10[r31] | 160 ± 40 | [764, 142] ± [270, 27] | [636, 118] | 133 |
| PJ120207.6 | 91 ± 38 | 0.4 ± 0.14[r31] | 452 ± 113 | [663, 123] ± [234, 30] | [442, 82] | 302 |
| PJ132302.9 | 93 ± 36 | 0.31 ± 0.11[r31] | 215 ± 54 | [557, 103] ± [196, 23] | [425, 79] | 164 |
| PJ142823.9 | 168 ± 69 | 0.88 ± 0.36[r21] | 97 ± 24 | [49, 9] ± [17, 4] | [228, 42] | 452 |
| PJ160722.6 | 121 ± 50 | 0.95 ± 0.38[r21] | 52 ± 13 | [50, 9] ± [18, 5] | [331, 62] | 344 |
| PJ160917.8 | 58 ± 24 | 0.35 ± 0.13[r31] | 465 ± 116 | [1473, 274] ± [521, 85] | [694, 129] | 219 |
| PJ160917.8 | − | 0.18 ± 0.06[r41] | − | − | − | − |
Notes. Unknown lensing amplification μ is reflected in the derived CO luminosity and H2 mass. ISM masses were calculated following Scoville et al. (2016), scaled to our AzTEC 1.1 mm photometry with a fixed dust temperature of 25 K.
We also compare our CO-based gas mass to the ISM gas mass estimates using the empirical calibration from measured rest-frame dust continuum (e.g. Scoville et al. 2016, 2017). Using our AzTEC 1.1 mm photometry (νobs = 272 GHz → rest-frame 250–470 μm), we compute the ISM mass using equation (14) of Scoville et al. (2017). The ISM masses we report scatter predictably around the values obtained from a ULIRG or Galactic conversion factor, suggesting that the value for αCO varies intrinsically from galaxy to galaxy. Later in Section 5.5, we will revisit this empirical calibration to compare the CO line luminosity to the specific luminosity at rest-frame 850 μm.
5.4 Gas depletion time-scales
The amount of time for a galaxy to consume its total molecular gas, given its current galaxy integrated SFR, is its so-called depletion time, or gas consumption time-scale, |$\tau _{\rm depl} = \mu M_{{\rm H}_2} / \mu {\rm SFR}$|. This inverse SFE reflects the nature of the SF activity of a galaxy, and is a measure that stands independent of the magnification factor in the same way for the LIR-to-CO(1–0) line luminosity ratios above.
To derive our SFR estimates we used the integrated 8–1000 μm SED and the empirical calibration (Kennicutt 1998) to convert LIR to SFR – adopting a Kroupa IMF. The values we obtain are, uncorrected for magnification amplification, ∼ 1 500–30 700 M⊙ yr − 1 (Harrington et al. 2016). Combined with the CO-based gas masses reported in Section 5.3, this suggests a depletion time-scale of τdepl ∼ 80 Myr These actively evolving galaxies represent a special mode of rapid SB activity. This is consistent with short gas depletion times observed on the order of τdepl = 10–100 Myr (e.g. Genzel et al. 2015; Aravena et al. 2016; Béthermin et al. 2016; Scoville et al. 2016), and also with typical galaxy–galaxy crossing time (∼100 Myr; Scoville et al. 2016). The rapid τdepl in these galaxies at high-z rival the τdepl = 2.2 Gyr time-scales for normal star-forming galaxies at z = 0 (Leroy et al. 2013).
5.5 Global gas to dust comparison
The ratio of measured |$L^{\prime }_{{\rm CO}(1{\rm -}0)}$| to rest-frame specific luminosity at 850 μm serves as a foundation for converting the optically thin Rayleigh–Jeans dust continuum, observed in the (sub)-mm, into total ISM mass (Scoville et al. 2014, 2016, 2017). To infer the rest-frame 850 μm of our galaxies, and thus to compare them to the empirical relation, we use the far-IR SED model fit procedure described by Harrington et al. (2016), fitting the Herschel SPIRE 250–500 μm and AzTEC 1.1 mm photometry with a modified blackbody (equation 14; Yun & Carilli 2002) (Fig. 4). Several of z ∼ 2–3 galaxies lie above the empirical calibration obtained by Scoville et al. (2017). In Scoville et al. (2017), the SED analyses was redone using the published sub-mm photometry and CO(1–0) line emission for the 30 normal low-z star-forming galaxies (Young et al. 1995; Dale et al. 2012), 12 low-z ULIRGs (Sanders et al. 1989, 1991; Solomon et al. 1997; Mentuch Cooper et al. 2012; Chu et al. 2017), and 30 SMGs (Greve et al. 2003; Harris et al. 2010; Carilli et al. 2011; Ivison et al. 2011; Lestrade et al. 2011; Riechers et al. 2011; Harris et al. 2012; Thomson et al. 2012; Aravena et al. 2013; Fu et al. 2013; Ivison et al. 2013; Thomson et al. 2015) at comparable redshifts to our sample. This empirical relation, based primarily on galaxies with solar metallicities, was recently validated using ∼70 main-sequence, low-z star-forming galaxies (Hughes et al. 2017). Without optical or FIR fine-structure emission lines, we cannot directly constrain the metallicities of our sample. However, we do not expect these galaxies to have sub-solar metallicities given their large apparent dust masses (μMd = [0.1–2] × 1010 M⊙) and given the empirical mass-metallicity relationship out to high-z (Geach et al. 2011; Saintonge et al. 2016).
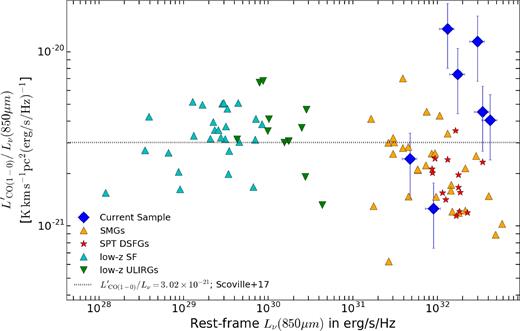
We compare our measured |$L^{\prime }_{{\rm CO}(1{\rm -}0)}$| to rest-frame Lν(353 GHz/850 μm ) in our sample to the low-z star-forming galaxies (Young et al. 1995; Dale et al. 2012), local ULIRGs (Sanders et al. 1989; Sanders, Scoville & Soifer 1991; Solomon et al. 1997; Mentuch Cooper et al. 2012; Chu et al. 2017), z ∼ 2 SMGs (Greve, Ivison & Papadopoulos 2003; Harris et al. 2010; Carilli et al. 2011; Ivison et al. 2011; Lestrade et al. 2011; Riechers et al. 2011; Harris et al. 2012; Thomson et al. 2012; Aravena et al. 2013; Fu et al. 2013; Ivison et al. 2013; Thomson et al. 2015), and lensed SPT galaxies (Aravena et al. 2016) with global measurements of CO(1–0) or CO(2–1) for some SPT sources, where we used r21 = 0.9 when applicable. We overplot the best-fitting linear relation from Scoville et al. (2017): |$L^{\prime }_{\rm CO(1{\rm -}0)} = 3.02\times 10^{-21} L_{\rm \nu 850}$|.
The SMG/DSFG population predominantly falls below the 1:1 relation, making our small sample the first to populate the upper envelope, which corresponds to a higher amount of observed CO gas per unit 850μm dust emission. The highest value of |$L^{\prime }_{\rm CO} / L_{\rm 850}$| observed in the SMG population compiled by Scoville et al. (2017) is the 350μm selected source in Ivison et al. (2011). Two of our galaxies are above the observed scatter, while three of our galaxies exhibit extreme CO luminosities compared to their rest-frame dust luminosity. A larger sample is undoubtedly required to further unveil if, as suggested by our sample, there is a larger intrinsic scatter at high-z, particularly at |$\log (L^{\prime }_{{\rm CO}(1{\rm -}0)}) > 10.5 {\rm {\, } K {\, } km {\, }s^{-1} {\, } pc^{2}}$| and log (Lν850) > 31.5 ergs−1 Hz−1. To compare to the SPT-DSFGs with J ≤ 2 CO line detections (Aravena et al. 2016), we take their 18 galaxies with consistent sampling of 0.25–1.4 mm photometry, similar to our 0.25–1.1 mm data, and fit their FIR-mm SEDs as described above. Those SPT galaxies with only CO(2–1) were converted to |$L^{\prime }_{\rm CO(1{\rm -}0)}$| using an r21 = 0.9.
The relatively high |$L^{\prime }_{\rm CO} / L_{\rm 850}$| ratios observed in our galaxies indicate larger gas-to-dust mass ratios (GDMRs) than observed in previous samples (Fig. 4). Converting the AzTEC 1.1 mm continuum measurement into dust mass, assuming Td = 25 K, we found GDMRs in the range [40–200] using the CO-based gas mass (αCO = 0.8), compared with the average GDMR of ∼230 from the 1.1 mm derived ISM mass (Scoville et al. 2017). This range is both consistent, though slightly larger, than observed in local galaxies with solar metallicities (Leroy et al. 2011; Draine et al. 2007). Assuming instead a Galactic αCO = 4.3, we would infer extremely high GDMRs (up to 1100), only observed in local, greatly metal-poor dwarf galaxies, e.g. the blue compact dwarf, I Zwicky 18, with 1/50 solar metallicity (Annibali et al. 2015). The assumption of αCO, as well as the choice of dust temperature in the ISM mass calculations ultimately determines the derived GDMRs.
6 CONCLUSIONS
Using VEGAS on the GBT, we have successfully measured the CO(1–0) line emission for seven of the most gas-rich SMGs/DSFGs studied to date. The key results of this study can be summarized as:
We have confirmed the previously determined spectroscopic redshifts reported by Harrington et al. (2016)
The linewidths/profiles for the low-J RSR and CO(1–0) VEGAS measurements are nearly identical; therefore the emitting regions are likely co-spatial, with 〈 FWHM〉 = 590 km s−1,
The CO SLEDs of the galaxies in our sample are indicative of a gas component with sub-thermal excitation conditions: CO line luminosity ratios of 〈 r21〉 = 0.92 (2 sources), 〈 r31〉 = 0.34 (5 sources), and r41 = 0.18 (1 source)
We find enhanced |$L_{\rm IR} / L^{\prime }_{\rm CO(1{\rm -}0)}$| ratios with respect to normal star-forming systems, as we report an average value of 110 ± 22 L⊙/(K km s−1pc2), comparable to the median of other well-studied SMGs.
With the CO(1–0) line emission we place tight constraints on the total molecular gas mass, and allow future CO SLED analyses to benefit from having the fundamental rotational transition observed. The large gas masses obtained are |$\mu M_{{\rm H}_2} = (0.9{\rm -}27) \times 10^{11} (\alpha _{\rm CO}/0.8) {\rm M_{\odot } }$|. The average gas depletion time we find is τdepl ∼ 80 Myr. These extremely luminous IR galaxies (with LIR ≥ 1013–14 L⊙) exhibit rapid depletion time-scales, and we are likely capturing this light from a relatively short-lived SB episode.
Acknowledgements
The quality of this manuscript, and the scientific considerations, have been improved significantly after discussions with N. Scoville, L. Liang and M. Sargent. All authors would like to thank the referee for their kind considerations of how this paper can be developed so as to make its most useful contribution to the field. KCH and DB would like to also thank Karen O’Neil and Toney Minter for organizing, and supporting our travel to, the first GBT remote observing school at the Green Bank Telescope. KCH would like to express great thanks to D. Frayer and all of the control room operators (specifically Amber and Donna) for making the observations run as smooth as possible. The Green Bank Observatory is a facility of the National Science Foundation operated under cooperative agreement with Associated Universities, Inc. KCH and DB heartily acknowledge our financial support granted to us by UMass Amherst’s Astronomy Department, while KCH much appreciated the ongoing support from the UMass Amherst Commonwealth Honors College Research Grant which led to the travel to the GBT remote observing school in 2016 January. KCH, AK and EFJA acknowledge the support by the Collaborative Research Center (CRC) 956, subproject A1, funded by the Deutsche Forschungsgemeinschaft (DFG). KCH acknowledges the financial support from the CRC-956 student exchange program. This opportunity has enabled KCH to engage in useful discussions and supervision with D. Riechers, who provided strong guidance in the final stages of this manuscript. Support for BM was provided by the DFG priority program 1573 ‘The physics of the interstellar medium. KCH is a member of, and receives financial support for his research by, the International Max Planck Research School for Astronomy and Astrophysics at the Universities of Bonn and Cologne and through the Max-Planck-Institut für Radioastronomie.
Footenotes
We assume, without high angular resolution imaging of the two luminosity sources, that the CO(1–0) emitting region and the pervasive dust content are on average co-spatial.
