


Abstract
We report a new compact galaxy, SDSS J122958.84+138.0 (SDSS J1229+0001), which has unique morphological and stellar population properties that are rare in observations of the nearby Universe. SDSS J1229+0001 has an r-band absolute magnitude (Mr) and half-light radius (Rh) of −17.75 mag and 520 pc, respectively. Located in a fairly low-density environment, morphologically it is akin to a typical early-type galaxy as it has a smooth appearance and red colour. However, interestingly, it possesses centrally concentrated star-forming activity with a significant amount of dust. We present an analysis of its structural and stellar population properties using archival images and VLT/FORS2 spectroscopy. An analysis of the UKIDSS H-band image shows that the observed light distribution is better fitted with a two-component Sérsic function with inner and outer component effective radii of 190 and 330 pc, respectively. The overall half-light radius measured in the H band is much smaller compared to optical, i.e. 290 pc. We prepared a spectral energy distribution from optical to far-infrared and interpret it to derive the star-formation rate, dust mass and stellar mass. We find that SDSS J1229+0001 has dust mass Mdust = 5.1 × 10⁵ M⊙ with a dust-to-stellar mass ratio log (Mdust/M*) = −3.5. While the observed stellar population properties are – to some extent – like those of a typical S0 galaxy, a unified view from stellar population and structural properties may suggest that SDSS J1229+0001 is a smoking gun example of a compact early-type galaxy in formation.
1 INTRODUCTION
Correlations and anti-correlations between galaxy parameters, known as scaling relations, have been used to understand the underlying physical principles of galaxy formation. Of particular interest is the size–luminosity relation, which has received considerable attention in recent studies of galaxy formation and evolution (e.g. Kormendy 1985; Janz & Lisker 2008). However, observational data exhibit both a large scatter and a significant number of outliers (Graham & Guzmán 2003; Kormendy et al. 2009; Chen et al. 2010; Misgeld & Hilker 2011). There exists a compact class of galaxies, compact ellipticals (cEs), which do not follow the log(size)–magnitude relation and they become outliers (Chilingarian et al. 2009; Trujillo et al. 2009; Paudel et al. 2014). They are compact, high surface brightness and metal-rich, and they possess a large velocity dispersion compared to the majority of similar mass galaxies, i.e. early-type dwarfs (dEs). So, their origin and evolution are expected to be different from that of dEs, the majority population. A number of studies discussing the origins of these compact galaxies have reached conclusions that are contradictory to each other (Trujillo et al. 2007; Paudel et al. 2014; Graham, Dullo & Savorgnan 2015; Stringer et al. 2015).
With the advent of large-scale surveys and high-resolution imaging instruments, an increasing number of cEs have been reported (Chilingarian et al. 2009; Chilingarian & Zolotukhin 2015). They are found in a range of environments, from the densest galaxy cluster centres to the field (Mieske et al. 2005; Price et al. 2009; Huxor et al. 2011; Huxor, Phillipps & Price 2013; Paudel et al. 2014). However, an overwhelming majority of known cEs are located in dense environments, particularly around massive galaxies. Therefore, several studies propose an origin via tidal stripping, in which strong tidal forces from a nearby massive host galaxy strip off the entire outer-disc component during the interaction and the remnant inner bulge becomes a naked compact galaxy (Bekki et al. 2001; Choi, Guhathakurta & Johnston 2002). Huxor et al. (2011) discovered two cEs, each near a massive host and with clear tidal debris, confirming this picture. On the other hand, cEs are also found in isolation or less-dense environments (Huxor et al. 2013; Paudel et al. 2014; Chilingarian & Zolotukhin 2015) and in the absence of such strong tidal force, it is, therefore, naively expected that not all cEs formed via tidal stripping. Chilingarian & Zolotukhin (2015), however, suggested that all such isolated cEs can be explained as runaway systems, ejected from a galaxy group or cluster by three-body encounters.
Here, we present a new compact galaxy, SDSS J122958.84+000138.0 (hereafter SDSS J1229+0001), which, from its morphology, seems to be an early-type galaxy. It was taken from an early-type galaxy sample visually selected from Sloan Digital Sky Survey (SDSS) colour images. The presence of strong emission in Hα in the optical spectrum, however, indicates a burst of ongoing star formation like a typical blue compact dwarf (BCD) (Hopkins, Schulte-Ladbeck & Drozdovsky 2002).
2 DATA ANALYSIS
We perform a detailed analysis of imaging and spectroscopic data to characterize the stellar population and structural properties of this galaxy. The multi-wavelength study covering the range from optical to far-infrared (FIR) data, and based on various archival images, allows us to make an accurate estimation of stellar mass, dust mass and internal extinction. We obtained a long-slit spectroscopic observation using ESO-VLT that supplements these data. Comparing the derived stellar population and structural properties with those of a well-studied sample of galaxies, we try to explore its possible evolution and origin, which may provide some important clues in understanding the formation and evolution of compact galaxies in the nearby Universe.
2.1 Environment and identification
We first conducted a systematic search of low-mass early-type galaxies in the field environment of the local volume (z < 0.01) to catalogue and study the physical and stellar population parameters of those galaxies located in isolation. For this purpose, we derived the distance to the nearest massive galaxies in terms of sky-projected separation and relative velocities (see Paudel et al. 2014) and selected the early-type morphology by visual inspection of the SDSS DR7 colour images (Abazajian et al. 2009).
SDSS J1229+0001 is located in a relatively isolated environment south of the Virgo cluster, at an angular separation of ∼8° from M49. The nearest bright galaxy, NGC 4517, is at ∼45 arcmin (440 kpc) east although the relative radial velocity between the two is 1285 km s−1. However, the closest galaxy in terms of sky-projected distance and relative radial velocity is SDSS J123002.09−002438.0. It is located at ∼190 kpc south with a relative radial velocity of 98 km s−1 and a luminosity of Mr = −14.71 mag.1
In Fig. 1, we show the distribution of galaxies around SDSS J1229+0001 within a radius of 100 arcmin and red-shift range of z = 0.001 to 0.01. The galaxy sample is obtained from a NASA/IPAC Extragalactic Database (NED) query. The sample is divided into two red-shift bins, i.e. z < 0.005 and z > 0.005, represented by blue and red points respectively. SDSS J1229+0001 is represented by a large solid dot and a big circle represents NGC 4517, having line-of-sight radial velocities of 2413 and 1128 km s−1, respectively. According to a catalogue of nearby groups (Makarov & Karachentsev 2011), SDSS J1229+0001 is not assigned to be a member of any nearby group. Interestingly, NGC 4517 is also considered an isolated disc galaxy in Doyle et al. (2005) and the galaxy population in this region of sky seems to be relatively sparse. Within the sky coverage shown in Fig. 1, no rich galaxy group has been found.
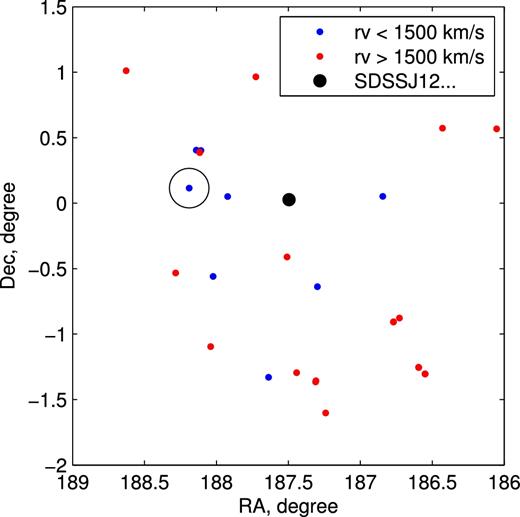
Distribution of the line-of-sight radial velocities over a range of 3000 km s−1 of galaxies around SDSS J1229+0001. The red and blue dots represent galaxies with a radial velocity larger or smaller than 1500 km s−1, respectively. The large solid black dot represents SDSS J1229+0001 and the black circle is the position of NGC 4517. The two have line-of-sight radial velocities of 2413 km s−1 and 1128 km s−1, respectively.
2.2 Imaging
At first, we used the SDSS image to perform image analysis. We particularly made use of the r-band image, which has a higher signal-to-noise ratio than the other bands. The archival images of SDSS-III have better sky-background subtraction than the previous data releases. We further subtracted the sky background using the procedure in Paudel et al. (2014) where we selected the sky-background counts from randomly selected sky regions around the galaxy to derive the median background.
The iraf task ellipse was used to extract the galaxy's major-axis light profile. We used a similar procedure as in Paudel et al. (2014) to prepare the input image and to run the ellipse task. In Fig. 2, we show the g − r − i combined colour image cutout in the top panel, which we obtained from the SDSS sky server. It gives a visual impression of the S0 galaxy with a prominent dust lane at the centre, perpendicular to the major axis of the galaxy. We show the major-axis light profile and g − i colour profile in the bottom panel of Fig. 2. The colour gradient was derived from the azimuthally averaged light profiles in the g and i bands. Since a difference in point spread function (PSF) can produce an artificial colour gradient at the centre of a galaxy, we matched the PSFs of these images by degrading the better image. We find that PSFs in the g and i bands are 1.04 and 0.92 arcsec, respectively.
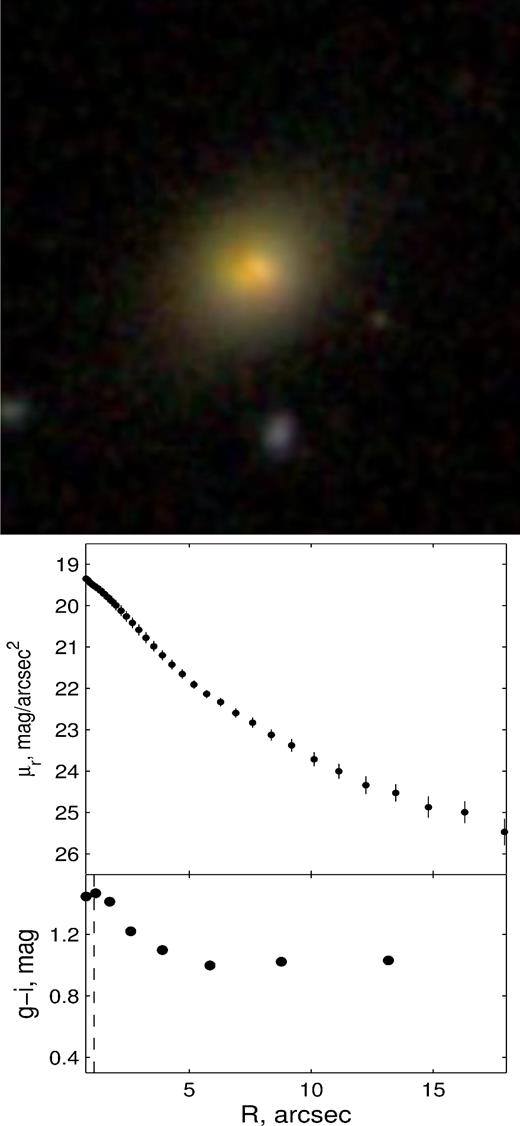
Optical view of SDSS J1229+0001 with a field of view of 1 × 1 arcmin. Top: Colour image cutout from SDSS. Bottom: Major-axis profile measured from iraf/ellipse. In the second panel, we show the g − i colour gradient (without corrections for either internal and external extinction). The vertical dash line represents the r-band PSF.
Since the central part of the galaxy is heavily obscured by dust, to model the galaxy light distribution and derive the structural parameter, we used the UKIDSS2H-band image expecting that the H-band image is less affected by dust extinction. We retrieved the stacked H-band image from the WFCAM Science Archive,3 which has a spatial sampling of 0.4 arcsec. The spatial resolution is comparable to SDSS with a seeing of 0.84 arcsec. We used galfit to perform two-dimensional modelling. The required PSF image is also provided during the galfit run. We find that the two-dimensional light distribution is better modelled with a two-component Sérsic function. We show the result of the galfit run in the top panel of Fig. 3. We show, from left to right, the H-band image, the model and the model subtracted residual. We also run the iraf ellipse task on the H-band image to derive the variation of the ellipse parameter along the major axis, which we show in the lower panel of Fig. 3. The average ellipticity of the galaxy is 0.21.
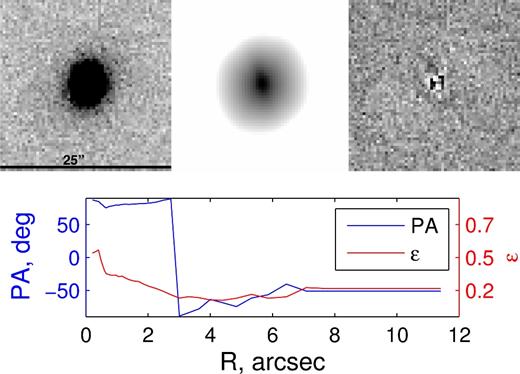
Modelling of galaxy light distribution with galfit. We show the H-band image, the model and the residual in the left-hand, middle and right-hand panels, respectively. We show the variation of ellipticity (red) and PA (blue) along the major axis in the bottom panel.
A non-parametric approach has been used to calculate the photometric parameters, i.e. half-light radius and total luminosity. A two Petrosian radius aperture was used to sum the total flux. We follow a similar procedure as described in Janz & Lisker (2008) and Paudel et al. (2014). We used a major-axis Petrosian radius. The major-axis half-light radius is circularized by multiplying by a factor of (1 − ε)0.5 where ε is the average ellipticity of the galaxy. The mean surface brightness within the half-light radius is calculated using |$\langle \mu \rangle = m+2.5\log [2\pi R_{\rm h}^{2}]$|, where Rh is the half-light radius in arcseconds. The results are presented in Tables 1 and 2, where the magnitudes are corrected for both Galactic and internal extinction. The value of Galactic extinction is obtained from NED and the internal extinction due to dust is derived from the spectral energy distribution (SED) fitting (see below).
Multi-wavelength data.
| Filters | λeff | Flux |
|---|---|---|
| μ | (jy) | |
| SDSS u΄ | 0.35 | 2.4 × 10⁴ ± 0.5 × 10⁵ |
| SDSS g΄ | 0.46 | 9.42 × 10⁴ ± 0.5 × 10⁵ |
| SDSS r΄ | 0.61 | 2.07 × 10³ ± 0.5 × 10⁵ |
| SDSS i΄ | 0.74 | 3.36 × 10³ ± 0.5 × 10⁵ |
| SDSS z΄ | 0.89 | 3.90 × 10³ ± 1 × 10⁵ |
| UKIDSS J | 1.25 | 8.44 × 10³ ± 1 × 10⁵ |
| UKIDSS H | 1.65 | 11.35 × 10³ ± 1 × 10⁵ |
| UKIDSS K | 2.20 | 9.68 × 10³ ± 1 × 10⁵ |
| IRAC1 | 3.56 | 4.83 × 10³ ± 4 × 10⁵ |
| IRAC2 | 4.51 | 3.54 × 10³ ± 3 × 10⁵ |
| IRAC3 | 5.76 | 13.36 × 10³ ± 1 × 10⁴ |
| IRAC4 | 8.00 | 39.18 × 10³ ± 1 × 10⁴ |
| WISE3 | 12.0 | 24.20 × 10³ ± 1 × 10³ |
| WISE4 | 22.0 | 62.11 × 10³ ± 1 × 10³ |
| MIPS24 | 24.0 | 0.06 ± 1 × 10³ |
| IRS60 | 60 | 0.81 ± 2 × 10³ |
| IRS100 | 100 | 1.08 ± 5 × 10² |
| AKARI140 | 140 | 0.38 ± 1 × 101 |
| AKARI160 | 160 | 0.20 ± 1 × 101 |
Global properties: Physical parameters of SDSS J1229+0001 grouped according to the results of different analyses. Columns 2–4 are the results of the SDSS r-band image analysis. The magnitudes are corrected for galactic and internal extinction. Rh is the half-light radius derived from the Petrosian method. The emission-line metallicity, 12 + log (O/H), is listed in column 6. The output of the best-fitting SED using magphys is presented in columns 7–11.
| Mr | g − i | Rh | z | 12 + log (O/H) | E(B − V) | M* | Mdust | Ar | log [Z/Z⊙] | |
|---|---|---|---|---|---|---|---|---|---|---|
| (mag) | (mag) | (kpc) | (dex) | (mag) | (M⊙) | (M⊙) | (mag) | (dex) | ||
| SDSS J122958.84+000138.0 | −17.75 | 1.02 (1.35a) | 0.52 | 0.008 | 8.5 | 0.85 | 1.8 × 10⁹ | 5.1 × 10⁵ | 0.71 | 0.008 |
aBefore extinction correction.
In this work, we adopted a cosmology with H0 = 71 and Ωm = 0.3. Using the Hubble flow, we obtained the distance to the galaxy as 34.0 Mpc and a spatial scale 0.163 kpc arcsec−1.
Fortunately, we find that substantial multi-wavelength data are available in various archives, allowing us to create a SED from the optical to the FIR. The SDSS provides optical u-, g-, r-, i- and z-band images. We obtained corrected UKIDSS J, H and K band magnitudes from RCSED.4 We use the IRSA5 archive to obtain neaar-infrared images (Spitzer observations) and measure the total flux using aperture photometry. The CDS6 catalogue server is queried to acquire the mid-infrared and FIR fluxes. 24μ, 12μ and 22μ fluxes were measured in the Spitzer MIPS24, WISE37 and WISE4 imaging bands, respectively. The FIR data points are taken from the Infrared Astronomical Satellite (IRAS) and AKARI8 all-sky surveys. The measured fluxes in the wavebands in janskys are given in Table 1.
The publicly available code magphys (da Cunha, Charlot & Elbaz 2008) was used to analyse the observed SED. The main principle behind it, in brief, is to check the energy balances that are emitted from several different components, i.e. young and old stellar emission, absorption due to dust and re-emission in the FIR. First, a model SED is created using a library of templates (Bruzual & Charlot 2003) by computing integrated stellar light and superposing an attenuation curve due to dust for a varying set of model parameters such as star-formation rate (SFR), age and metallicity. The dust attenuation curve is derived from a simple analytic model of Charlot & Fall (2000). Finally, applying a χ2-minimization scheme, magphys tries to find the best-fitting model template for a particular set of physical parameters. This code does not consider a potential active galactic nuclei contribution and only star-formation processes are involved in building the SEDs. However, we investigate any possibility of an active galactic nuclei presence by looking at its position in a BPT diagram (Baldwin, Phillips & Terlevich 1981). We use the emission-line flux measured from the central spectrum to construct the BPT diagram, and find that SDSS J1229+0001 is unambiguously located in the region of star-forming galaxies.
A comparison between the observed SED and the best-fitting template is shown in Fig. 4, where the red dots represent the observe photometric data points and the black and blue lines are the best fitting SEDs for the non-attenuated and dust-attenuated models, respectively. In general, the model SED seems to be able to characterize well the observed data points. A slight deviation, however, is seen in the FIR region. This may indicate the necessity of longer wavelength data points, which unfortunately are not available, to constrain better the physical parameters of the model. In particular, longer wavelength data are crucial in making an accurate estimate of dust temperature.

Fitted SED, output from magphys. The red dots are observed data points of SDSS J1229+0001. The black and blue lines are the best-fitting SEDs for the non-attenuated and dust-attenuated models, respectively.
The resulting physical parameters – total stellar mass, dust mass, extinction and metallicity – are reported in the last columns of Table 2. We derive the SDSS r-band extinction, Ar, from the flux ratio between the dust-attenuated and non-attenuated models, i.e. the black and blue lines in Fig. 4, respectively.
2.3 Spectroscopy
We obtained long-slit low-resolution spectroscopic data using the VLT FORS2 instrument as part of an ongoing campaign to study low-mass early-type galaxies in different environments. The details of the long-slit observation and data reduction are presented in Paudel et al. (2014). The total exposure time for this galaxy was 1000 s. Following a similar procedure for VLT FORS2 data reduction as described in Paudel et al. (2010), we achieve 0.1 mag accuracy around 5000 Å in calibrating the observed flux that we measured from the standard deviation of the sensitivity function. The orientation and position of the slit over the galaxy are shown in Fig. 5. The top panel shows where the slit is aligned along the major axis of the galaxy.
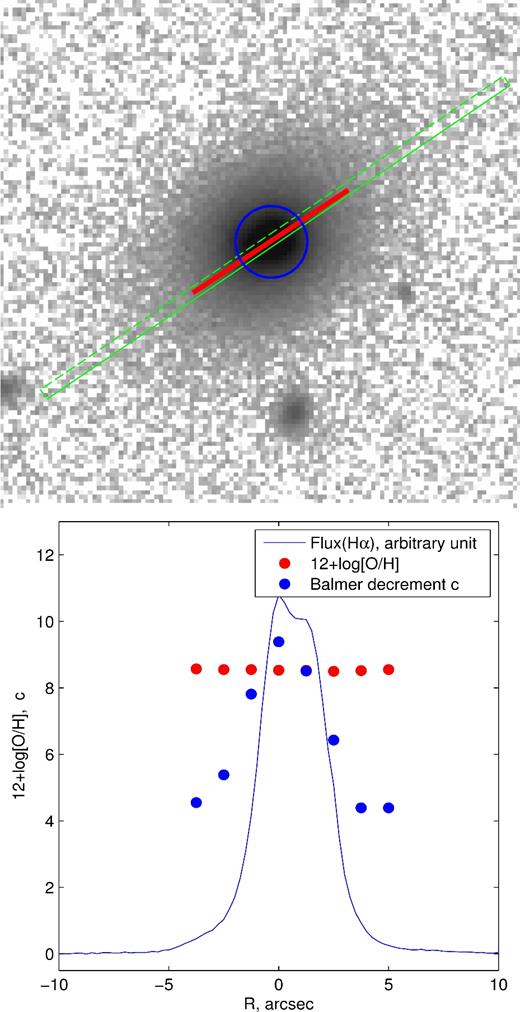
Top: SDSS r-band image where we overlay a 1-arcsec slit in green. The red solid line represents the extension of Hα emission and the radius of the blue circle is a half-radius of the galaxy. The field of view is like that in Fig. 2. Bottom: Hα, gas-phase metallicity and Balmer decrement (c) profile along the major axis.
The one-dimensional spectrum is extracted by summing the flux in a two-dimensional frame along the spatial direction. To extract a galaxy-wide spectrum, we use an aperture of ±7 arcsec (solid red line in Fig. 5 top panel). In Fig. 6, we show the flux-calibrated one-dimensional spectrum, in which the Balmer emission lines are prominent.
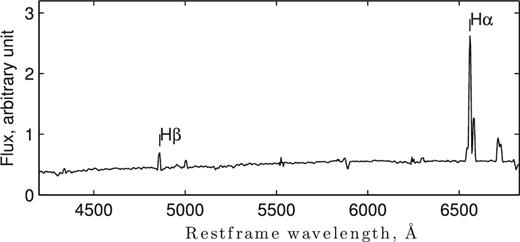
Flux-calibrated VLT2 FORS2 spectrum of SDSS J1229+0001.
We measure the emission-line fluxes using the iraf task splot, fitting a Gaussian profile. The ratio between Hα and Hβ flux, the so-called Balmer decrement c, is 7.8. Using a theoretical value of c0 = 2.86 for an electron temperature of 104 K and an electron density ne = 102 cm−3 (Osterbrock 1989) and the Calzetti et al. (2000) extinction law, we derived the extinction coefficient E(B − V) and corresponding r-band extinction Ar.
Oxygen abundances, 12 + log (O/H), were estimated with the two methods described by Marino et al. (2013), i.e. the so-called N2 and O3N2 methods. The N2 method only considers the line ratio between Hα and [N ii] while the O3N2 method uses a combination of the line ratios Hα/[N ii] and [O iii]/Hβ. A typical systematic error in these calibrations is 0.2 dex (Denicoló, Terlevich & Terlevich 2002; Marino et al. 2013).
3 RESULTS
Although it is a typical early-type galaxy, as seen in the SDSS colour image, the optical spectroscopy reveals strong Balmer emission (Fig. 6). The SFR derived from Hα emission is ∼0.25 M⊙ yr−1 and, not surprisingly, it is a sign of starburst activity. The dust lane at the centre is clearly visible. Below we present the results from an analysis of the structural properties and multi-wavelength photometry.
3.1 Image analysis
We find a significant difference in the half-light radii measured in optical and H-band imaging. The measured geometric half-light light radius of the galaxy from the SDSS r band is 0.52 kpc whereas that measured from the H-band imaging is significantly less, 0.29 kpc. For the SDSS z-band, the half-light radius is 0.49 kpc. This trend can be explained well by the increasing extinction of dust at the centre of the galaxy towards shorter wavelengths, which significantly reduces the central light concentration.
It was clear from the variation of the position angle (PA) in the inner and outer parts that the morphology of the galaxy is not simple. This was further supported by our two-dimensional modelling of the light distribution in the H-band image using galfit. We find that the two-component Sérsic function provides better fits than a simple Sérsic function. The results are listed in Table 3. The best-fitting inner- and outer-component Sérsic indices (n) are 1.4 and 1.2 and the effective radii (Re) are 0.19 and 0.33 kpc, respectively. The inner and outer components have PA 77° and −61°, respectively. We plot ellipticity and PA profiles along the major axis in the last panel. We find a strong change in PA around 2 to 3 arcsec, which flips from ∼80° to ∼− 80° (Fig. 3 bottom panel).
Derived structural parameters from the H-band image. All parameters, other than the top three, are the results of the galfit run. mH is the corrected H-band magnitude listed in RCSED and Rh is the half-light radius measured with the Petrosian method; see text. 〈μH〉 is the average surface brightness within Rh.
| Parameter | Value | Unit |
|---|---|---|
| mH | 14.39 | mag |
| Rh | 0.29 | kpc |
| 〈μH〉 | 17.53 | mag arcsec−2 |
| Re, in | 0.19 | kpc |
| Re, out | 0.33 | kpc |
| nin | 1.4 | – |
| nout | 1.2 | – |
| εin | 0.62 | – |
| εout | 0.08 | – |
| PAin | 77 | degree |
| PAout | −61 | degree |
| Parameter | Value | Unit |
|---|---|---|
| mH | 14.39 | mag |
| Rh | 0.29 | kpc |
| 〈μH〉 | 17.53 | mag arcsec−2 |
| Re, in | 0.19 | kpc |
| Re, out | 0.33 | kpc |
| nin | 1.4 | – |
| nout | 1.2 | – |
| εin | 0.62 | – |
| εout | 0.08 | – |
| PAin | 77 | degree |
| PAout | −61 | degree |
The overall g − i colour index of the galaxy is 1.02 and 1.35 mag, after and before applying the correction for extinction due to dust reddening, respectively. The relation between colour and magnitude for various types of low-mass galaxies is shown in Fig. 7. For this, we use tabulated values of the r-band absolute magnitude and g − i colour index from Meyer et al. (2014) for BCDs and dEs. For the cEs, we use the photometric parameters from Chilingarian & Mamon (2008) and Chilingarian & Bergond (2010). Two green symbols, a solid circle and square, represent the extinction-corrected and uncorrected g − i colour index of SDSS J1229+0001, respectively. The difference between star-forming galaxies, BCDs and others (cEs and dEs) is distinctively clear as previously noted by Meyer et al. (2014), but interestingly SDSS J1229+0001 is consistent with dEs, its colour being slightly bluer than the mean cE colour. Nevertheless, the uncorrected g − i colour of SDSS J1229+0001 is the reddest point in this diagram.
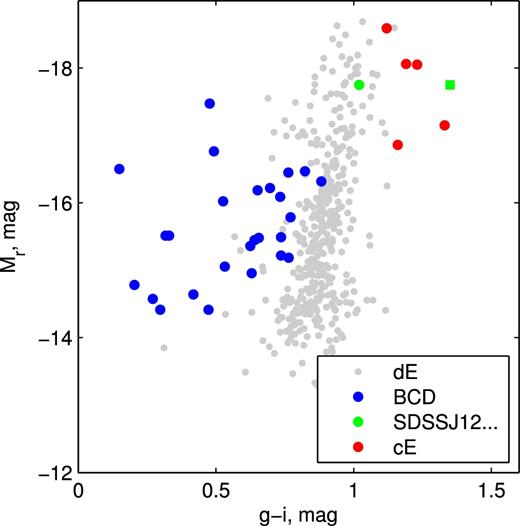
Colour–magnitude relation of dwarf galaxies. BCDs, dEs and cEs are in blue, grey and red, respectively. The green symbols represent SDSS J1229+0001, where the square and circle are for before and after extinction correction, respectively.
We show the observed g − i colour gradient (uncorrected for extinction) along the major axis in Fig. 2, where we can see a steep rise of the g − i colour index at the centre with a maximum value of 1.4 mag. It becomes nearly constant beyond 3 arcsec and it has a value like that we obtained from the overall colour index after the extinction correction that is obtained from SED fitting.
In Fig. 8, we show the relation between sizes and luminosities for the low-mass early-type galaxies, using the measurements from Janz & Lisker (2008) for dEs, Es and S0s, and Chilingarian et al. for cEs. As previously identified in many studies (Janz & Lisker 2008; Chilingarian et al. 2009; Huxor et al. 2013; Paudel et al. 2014), the distinction between cEs and dEs in this diagram is clearly visible. SDSS J1229+0001 lies in the cE region, being relatively compact compared to similar luminosity dEs or dS0s. Note, however, there is also a statistical difference in the sizes of BCDs and dEs, as the latter are more extended systems than the former, though the scatter in both cases is fairly large.
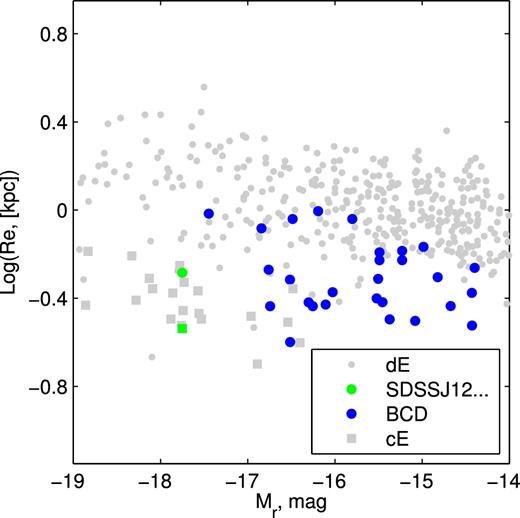
Magnitude–size relation. The green circle and square represent the half-light radius of SDSS J1229+0001 derived from optical and H-band images, respectively. The other symbols are like those of Fig. 7.
3.2 Multi-wavelength analysis
We derived the total SFR from several different diagnostics and empirical calibrations. These diagnostics are listed in Table 4 where the fluxes are presented in janskys. The Hα emission-line flux is corrected for the internal extinction, but no aperture correction has been made. We use empirical calibrations from Kennicutt (1998), Murphy et al. (2011) and Rieke et al. (2009) for the Hα, radio and MIPS star-formation diagnostics, respectively. We find that the SFRs derived from these three diagnostics are fairly consistent with each other but SED fitting gives a lower value, i.e. nearly four times smaller than that from Hα or 1.4-GHz fluxes. Due to uncertainties in the model, particularly the star-formation history, it is likely that the SFR derived from SED fitting without UV photometry is highly uncertain.
Star-formation rates calculated by different methods.
| Band | Flux | SFR |
|---|---|---|
| (Jy) | (M⊙ yr−1) | |
| Hα | 0.34 ± 0.005 * | 0.26 |
| MIPS24μ | 0.06 ± 0.001 | 0.19 |
| 1.4 GHz | (2.9 ± 0.13) × 10−3 | 0.25 |
| SED fitting | – | 0.06 |
| Band | Flux | SFR |
|---|---|---|
| (Jy) | (M⊙ yr−1) | |
| Hα | 0.34 ± 0.005 * | 0.26 |
| MIPS24μ | 0.06 ± 0.001 | 0.19 |
| 1.4 GHz | (2.9 ± 0.13) × 10−3 | 0.25 |
| SED fitting | – | 0.06 |
*The Hα flux is obtained by summing the long-slit spectrum and correcting for extinction Aα = 2.3 mag.
3.3 Spectroscopy
We show the Hα flux profile along the slit in Fig. 5 as the blue line in the lower panel. We see nearly two peaks in the Gaussian profile, which may hint at some misalignment of the elongation of the star-forming region at the centre with the PA of the galaxy. This is much clearer in the colour image, where the dust lane is almost orthogonal to this PA and probably why the PA profile shows an abrupt change at the centre; see Fig. 2. The extension of Hα emission along the major axis is greater than ±6 arcsec from the centre.
The total Hα flux measured from the integrated spectrum is 2.66 × 10⁻¹⁴ erg cm−2 s−1.9 The ratio between the Hα and Hβ flux, the Balmer decrement, c = 7.8, which gives E(B − V) = 1.97 × log (c/c0) = 0.85 and corresponding r-band extinction Ar = 3.44 mag. However, note that we do not use this value of Ar to correct any photometric measurement other than the Hα flux to derive the SFR; see below.
We obtained 12 + log (O/H) = 8.4 (8.5) dex from N2 (O3N2). We show the metallicity profile along the slit in Fig. 5, lower panel, as red solid dots. We find a nearly constant gas-phase metallicity along the major axis up to ∼2Re.
4 DISCUSSION AND CONCLUSION
We present a new compact and red-looking star-forming galaxy, SDSS J1229+000, which has a half-light radius of 520 pc and relatively steep light profile with Sérsic index n = 3. Although, SDSS J1229+0001 has a g − i colour index of 1.02, like a typical old red and dead early-type galaxy of a similar mass, strong ongoing star formation is also observed at the centre, with SFR = ∼0.25 M⊙ yr−1. Nevertheless, an analysis of the SED from optical to FIR reveals that a substantial amount of dust is present, i.e. Mdust = 4.9 × 10⁵ M⊙ with dust-to-stellar mass ratio of log (Mdust/M*) = −3.5.
4.1 Mixed and intermediate morphology
Although low-mass galaxies are the most common in the Universe, their classification scheme is somewhat arbitrary. Particular morphological traits, mainly in the optical bands, are used to define a particular class of galaxies. For example, strongly concentrated star formation is mostly considered for BCDs. Irregular morphology with a low level of star formation is a characteristic of dwarf irregular galaxies (dIrrs). They are both gas rich and found in relatively low-dense environments, such as in the outskirts of a galaxy cluster and in the field. BCDs are, by definition, relatively high-surface galaxies compared to dIrrs. Meyer et al. (2014) showed that a number of BCDs (but not all) are structurally like compact early-type dwarf galaxies (dEs) and that dIrrs are like diffuse dEs.
There are several types of non-star-forming families. dEs, dwarf lenticulars (dS0s) and dwarf spheroidals (dSphs) are relatively extended galaxies with low surface brightnesses. The distinction between them is not straightforward. However, the primary motivation of introducing the dS0 class was the observation of multi-component light profiles in some low-mass early-type galaxies in the Virgo cluster (Sandage & Binggeli 1984). These are dwarf analogues of the massive S0 galaxies that possess a distinct bulge and disc components. Furthermore, the detailed analysis of the substructural properties of dEs given by Lisker et al. (2007) indeed supports the existence of a disc feature in a considerable fraction of dEs. Janz et al. (2014) concluded that the common bulge-plus-disc picture of bright S0s is not applicable to explain the observed inner and outer components of early-type dwarfs. Moreover, Ryden et al. (1999) earlier noticed no distinction in the structural parameters of the dE and dS0 morphological classes. However, the average dS0 has a brighter surface brightness than the average dE, reflecting that dS0s mostly occur at the brighter magnitudes of early-type dwarfs.
At the massive scale, S0 galaxies not only differ from Es in structural parameters but also in stellar population and dust content. More S0 galaxies host ongoing centrally concentrated star formation than Es and they also have a significantly larger dust mass fraction (Amblard et al. 2014). There are low-mass S0s that have been explicitly classified as S0s with the same mass as dS0s but which have a significantly higher surface brightness, e.g. VCC 1833 and VCC 0140. The dust-to-stellar mass ratio of log (Mdust/M*) = −3.5 is typical of early-type galaxies at a stellar mass of ∼109 M⊙ (di Serego Alighieri et al. 2013). SDSS J1229+0001 also exhibits an unusually high SFR and dust mass compared to a typical S0 galaxy. In addition, we find that the observed light distribution is better described by a two-component Sérsic function. Overall the size, i.e. the half-light radius, measured in the H band is quite small, i.e. 290 pc. Given that the H band is more sensitive to the light of old stars than the optical is, this indicates that the galaxy will likely end up in the compact regime once star formation stops.
Compact non-star forming galaxies, somewhat rare in observations, also exist under different names for different stellar masses, such as cEs and ultra compact dwarf galaxies. They possibly form a continuum of mass ranging from ≈106 M⊙ to ≈109 M⊙ (Norris et al. 2014). cEs are significantly compact and have a high surface brightness compared to low-mass S0s and dS0s.
While not denying the possibility of it being a S0 galaxy, our results suggest that SDSS J1229+0001 may be the late stage of a forming compact early-type galaxy. It is worth noting that cEs and S0 morphologies are not mutually exclusive. M32, the type example of an cE, also possesses an outer disc and inner-bulge component, which has been a defining character of S0 morphology. Recently, Paudel et al. (2016) reported a compact early-type galaxy with an active nucleus that is structurally like a typical S0 galaxy.
4.2 Relative rarity of the object
In this section, we attempt at least to qualify how rare the compact red-looking star-forming galaxies are. Both stellar population evolution and dynamical evolution of any compact young stellar system will lead to an expansion in size and dimming in brightness. The observation of compact and old non-star-forming objects means that they were much more compact and brighter when they were young – if they formed in isolation. Some of the compact star-forming galaxies, the so-called BCDs, are as compact as cEs but they are less luminous than cEs. Note that all BCDs are not, in general, compact galaxies. In most cases, they are BCDs due to a blue compact star-forming region on top of an underlying extended relatively old component. The brightest BCD in the Virgo cluster, VCC 324, has a total luminosity of Mr = −17.46 mag and overall effective radius of 0.96 kpc. Selecting compact BCDs of sizes like cEs from the Meyer et al. (2014) sample, we find a clear offset in the magnitude distribution where cEs are on average a magnitude brighter than compact BCDs.
To get a more statistically complete view of compact galaxies like SDSS J1229+0001, we visually analyse the morphology and g − i colour index of a sample selected from SDSS within the red-shift range z < 0.02,10 which have effective radii <0.6 kpc (in the SDSS catalogue, this is the Petrosian half-light radius).11
We find only one additional example, SDSS J112308.77+624845.6, a galaxy with very similar morphology; see Fig. 9. It has a Petrosian half-light radius, measured by SDSS, of 534 pc. The g − i colour index, before correcting for internal extinction, is 1.3 mag and the emission-line metallicity, 12 + log (O/H), is 8.54. We find that a g − i colour index larger than 1.3 mag is extreme for similar mass galaxies and interestingly none of the Virgo cluster galaxies, of both star-forming and non-star-forming types, have that g − i colour index.
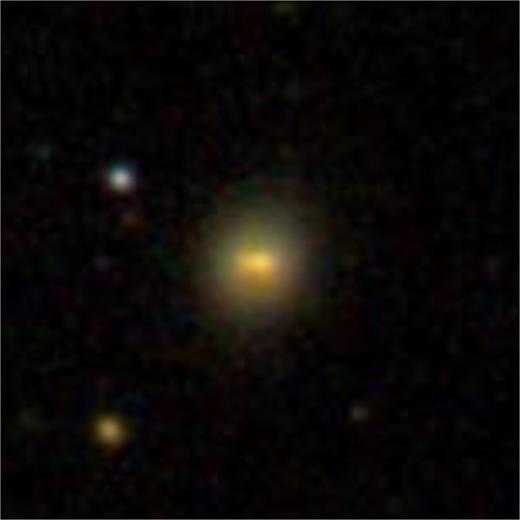
SDSS colour image of SDSS J112308.77+624845.6 with a field of view 1 × 1 arcmin.
4.3 Star formation and evolution
The detection of star-formation activity in early-type galaxies is not new, nor is the presence of a significant amount of neutral hydrogen (H i). A dedicated study of the H i distribution in Es by the ATLAS-3D team detected H i in 40 per cent of Es outside a cluster environment (Serra et al. 2012). The recent data release of the H i survey by the ALPHA-APHA team reported that SDSS J1229+0001 has a total H i mass of 4 × 10⁸ M⊙ and the corresponding value of |$\log [M({\rm H}\,\small {i})/M_{{\ast }})]$| is −0.62. The presence of cold gas in Es has been interpreted as indicating a continuing growth of these galaxies up to the recent past (Serra & Oosterloo 2010; Thom et al. 2012). They may accrete cold gas directly from the field or via a merger (major or minor). Although SDSS J1229+0001 has a gas mass of 4 × 10⁸ M⊙ and a gas-mass fraction of −0.62, the observed SFR of 0.26 M⊙ yr−1 seems to be an upper limit for similar mass (MB ≈ −16.5 mag) star-forming dwarf galaxies (Lee et al. 2009, fig. 6). Assuming an H i consumption fraction of 10 per cent, the star-formation activity only lasts 160 Myr with the current SFR, so it is very likely to be just a temporary phase.
Hallenbeck et al. (2012), in a study of a sample of gas-bearing early-type dwarf galaxies in the Virgo cluster, proposed two possibilities: either such galaxies have recently accreted their gas or they are in the last stages of star formation. In particular, for those that have detectable star-forming activity, they suggest the latter. Is SDSS J1229+0001 similar? The observed relatively high emission-line metallicity may be explained well according to the fundamental relation between gas-mass fraction, SFR and emission-line metallicity where emission-line metallicity anti-correlates with gas-mass fraction for a given SFR (Lara-López et al. 2010). We also find that two of the objects in Hallenbeck et al. (2012), for which we can derive only the emission-line metallicity from the SDSS spectroscopy, have a similar value of 12 + log (O/H) = ∼ 8.45. Geha et al. (2012) showed that field galaxies of the dwarf regime always have some residual star formation. SDSS J1229+0001 is relatively far from the massive halo, so the presence of star formation is in line with Geha et al.'s prediction.
How would it evolve after ceasing to form stars in the centre? Any dynamical and stellar population evolution of a compact star-forming object is likely to decrease the surface brightness and expand the size (Assmann et al. 2013; Pfalzner & Kaczmarek 2013; Wellons et al. 2015; El-Badry et al. 2016). It is certain that the central surface brightness in the optical band would decrease as it becomes older. Does it look like a typical low-surface brightness galaxy dE/dS0 or would it still remain a low-mass high-surface-brightness early-type galaxy like E/S0? The mean surface brightness (17.53 mag arcsec−2) in the H band is ∼2 mag higher compared to the average value of dE studied by Janz et al. (2014). Similarly, it is unusually compact, having a H-band half-light radius similar to NGC 4486A. This is a compact low-mass early-type galaxy in the Virgo cluster, which also shows an unusual burst of star formation at the centre (Prugniel et al. 2011). NGC 4486A is >4.5 mag brighter than SDSS J1229+0001. In this regard, SDSS J1229+0001 may be considered as a low-luminosity version of NGC 4486A.
In summary, we find a couple of ignored-morphology galaxies that may be more like high-z galaxies (e.g. Tadaki et al. 2015). The red colour and relatively high emission-line metallicity of these objects may suggest a deficient gas-mass fraction while there are actively forming stars at the end stage of evolution. Compact starburst and dust-dominated galaxies are expected to be common in the early Universe – are these galaxies a low red-shift counterpart? In fact, the formation of cEs in the high-red-shift Universe has been associated with merger-induced starburst activity with the dissipative collapse of star-forming gases (Kormendy & Sanders 1992; Hopkins et al. 2009). It is also important to explore why there are no such compact massive galaxies (of both star-forming and non star-forming types) in the nearby Universe. While a more detailed comparative analysis of the structural and stellar population properties of a more complete sample would be necessary to establish an unambiguous evolutionary connection, these observational findings themselves may be an important step towards this. In the next publication, we aim to explore further.
Acknowledgments
This study has made use of NASA's Astrophysics Data System Bibliographic Services and NED. SDSS data were queried from the SDSS archive. Funding for SDSS/SDSS-III has been provided by the Alfred P. Sloan Foundation, the participating institutions, the National Science Foundation, the US Department of Energy, the National Aeronautics and Space Administration, the Japanese Monbukagakusho, the Max Planck Society and the Higher Education Funding Council for England. The SDSS web site is http://www.sdss.org.
Based on observations collected at the European Organization for Astronomical Research in the Southern hemisphere, Chile [programme 087.B-0841(A)].
The red shift was measured by the 2DF survey (Colless et al. 2001), which reported the line-of-sight radial velocities of SDSS J1229+0001 and its companion as 2408.1 and 2310.0 km s−1, respectively.
Without correcting for the extinction and aperture effects.
We have chosen this red-shift range because beyond 0.02, the morphological classification may not be reliable and also beyond this with a typical SDSS PSF of 1 arcsec, it is not sufficient to measure the Re of these compact galaxies.
There are ≈500 galaxies and a significant majority of them are of BCD type.
