


Abstract
The assembly of the first super massive black holes (SMBHs) at z ≳ 6 is still a subject of intense debate. If black holes (BHs) grow at their Eddington rate, they must start from ≳104 M⊙ seeds formed by the direct collapse of gas. Here, we explore the alternative scenario where ∼100 M⊙ BH remnants of the first stars grow at super-Eddington rate via radiatively inefficient slim accretion discs. We use an improved version of the cosmological, data-constrained semi-analytic model GAMETE/QSOdust, where we follow the evolution of nuclear BHs and gas cooling, disc and bulge formation of their host galaxies. Adopting SDSS J1148+5251 (J1148) at z = 6.4 as a prototype of luminous z ≳ 6 quasars, we find that ∼80 per cent of its SMBH mass is grown by super-Eddington accretion, which can be sustained down to z ∼ 10 in dense, gas-rich environments. The average BH mass at z ∼ 20 is MBH ≳ 104 M⊙, comparable to that of direct collapse BHs. At z = 6.4 the AGN-driven mass outflow rate is consistent with the observations and the BH-to-bulge mass ratio is compatible with the local scaling relation. However, the stellar mass in the central 2.5 kpc is closer to the value inferred from CO observations. Finally, ∼20 per cent of J1148 progenitors at z = 7.1 have BH luminosities and masses comparable to ULAS J1120+0641, suggesting that this quasar may be one of the progenitors of J1148.
1 INTRODUCTION
High-redshift quasars are among the most luminous sources in the distant Universe. Their large luminosities (L ∼ 1047 erg s−1) suggest that the powering mechanism of the strong radiative emission is the accretion of gas on to a Super Massive Black Hole (SMBH), with a mass MBH ≳ 109 M⊙ settled in the centre of the host galaxy (e.g. Fan et al. 2001, 2003; Willott et al. 2007). This phenomenon, in fact, can convert up to 30 per cent of the energy in radiation, explaining the nature of this powerful emission (Shakura & Sunyaev 1973).
The most distant quasars are observed up to redshifts z ∼ 7 (Mortlock et al. 2011), corresponding to a Universe younger than 1 Gyr old. How these SMBHs form and grow in such a short time is still an open question.
In the hierarchical scenario of structure formation, SMBHs are expected to grow via mergers with other BHs and gas accretion, starting from a less massive BH, generally referred to as BH seed. Hence, the formation and accretion history of SMBHs depend on the initial mass of BH seeds and on their formation epoch. The nature of the first BH seeds is still uncertain and different formation mechanisms have been proposed in the literature (see e.g. Volonteri 2010, and references therein):
primordial black holes (BH), with masses ranging from the Planck mass up to 105 M⊙ could have formed in the early Universe, well before galaxy formation (Khlopov, Rubin & Sakharov 2005).
remnants of the first generation of metal-poor stars, the so-called Population III (Pop III) stars (see e.g. Bromm 2013, for a review), that can form to BHs of ∼100 M⊙, at z ∼ 20 (Madau & Rees 2001; Abel, Bryan & Norman 2002; Bromm, Coppi & Larson 2002; O'Shea & Norman 2007; Turk, Abel & O'Shea 2009; Tanaka & Haiman 2009; Greif et al. 2012; Valiante et al. 2016).
gas-dynamical processes in massive environment can lead to the direct collapse of gas into a massive BH of [104–106] M⊙ (Bromm & Loeb 2003; Koushiappas, Bullock & Dekel 2004; Begelman, Volonteri & Rees 2006; Lodato & Natarajan 2006; Ferrara et al. 2014; Pacucci, Volonteri & Ferrara 2015; Valiante et al. 2016).
stellar-dynamical processes allow BHs to form in nuclear clusters of second-generation stars with masses ∼[102–105] M⊙ (Devecchi & Volonteri 2009; Devecchi et al. 2010, 2012).
gas-driven core collapse of dense stellar clusters due to the rapid infall of gas with a mass comparable to that of the stellar cluster can lead to the formation of BHs of ∼103M⊙ or larger (Davies, Miller & Bellovary 2011; Lupi et al. 2014).
In order to grow up to billion solar masses at z ∼ 6, seed BHs must accrete gas at the Eddington rate almost uninterruptedly for several hundreds of Myr, even if they start as ‘heavy seeds’ of [105–106] M⊙. Alternatively, short episodes of super-Eddington accretion have been suggested as a viable way to allow the efficient growth of SMBHs, especially if these start from ‘light seeds’ of ∼100 M⊙ (Haiman 2004; Yoo & Miralda-Escudé 2004; Shapiro 2005; Volonteri & Rees 2005, 2006; Pelupessy, Di Matteo & Ciardi 2007; Tanaka & Haiman 2009; Madau, Haardt & Dotti 2014; Volonteri, Silk & Dubus 2015). In a recent numerical study, Lupi et al. (2016) show that, if a large reservoir of dense cold gas is available, a MBH ∼ 105 M⊙ can grow in an ∼ Myr time-scale starting from a seed mass of ∼20–100 M⊙, under the assumption of a slim accretion disc solution (Abramowicz et al. 1988). The slim disc solution, that we better describe in Section 2.3, represents advective, optically thick flows that generalize the standard Shakura & Sunyaev solution (Shakura & Sunyaev 1973). In this model, the radiative efficiencies, which depend on the accretion rate, are low: the radiation is trapped and advected inward by the accretion flow (see however the recent simulations by Sa̧dowski & Narayan 2016). In this scenario, the outflow has a negligible effect and the BH can accrete up to 80–100 per cent of the gas mass available (Pacucci et al. 2015).
In this paper, we investigate the role of super-Eddington accretion in the formation of the first SMBHs at redshift z ∼ 6, with the aim to understand what are the environments where it can occur and discuss the implications for the coevolution of the SMBHs and their host galaxies at high redshifts. We base our analysis on the data-constrained semi-analytical model GAMETE/QSOdust that allows us to simulate a large number of hierarchical histories of a quasar host dark matter (DM) halo, following the star formation history, chemical evolution and nuclear BH growth in all its progenitor galaxies. The model has been first successfully used to investigate the properties of the z = 6.4 quasar SDSS J1148+5251 by Valiante et al. (2011, 2012), applied to a sample of quasars at 5 < z < 6.4 by Valiante et al. (2014) and more recently used to investigate the relative importance of light and heavy seeds in the early growth of high-z SMBHs under the assumption of Eddington-limited accretion (Valiante et al. 2016). Here, we present an improved version of the model, which has been modified to follow gas cooling, disc and bulge formation, and BH gas accretion in all the progenitor systems of a z = 6.4 quasar, using SDSS J1148+5251 (hereafter J1148) as a prototype for the general class of luminous high-redshift quasars.
The paper is organized as follows. In Section 2 we introduce the model, describing assumptions and physical prescriptions. In Section 3 we present the results. Finally, a discussion and the main conclusions are given in Section 4.
2 THE MODEL
In this section we provide a brief summary of the original GAMETE/QSOdust model (referring the readers to Valiante et al. 2011, 2012, 2014 for a more detailed description) and we present the new features that have been implemented for the present study.
We reconstruct 30 independent merger histories of a DM halo at redshift 6.4 assumed to be the host of J1148. We adopt a Navarro, Frenk & White (1995, NFW) density profile with a mass of Mh = 1013 M⊙, within the range supposed to host high-z bright quasars (Fan et al. 2004; Volonteri & Rees 2006) and simulate its hierarchical history using a binary Monte Carlo merger tree algorithm based on the Extended Press–Schechter theory (Lacey & Cole 1993).
The code follows the time evolution of the mass of gas, stars, metals and dust in a two-phase ISM inside each progenitor galaxy (see also de Bennassuti et al. 2014), taking into account chemical enrichment from asymptotic giant branch (AGB) stars and supernovae (SNe), which inject dust and metals into the ISM, grain destruction by SN shocks and grain growth in dense molecular clouds.
Energy-driven outflows, powered by both AGN and SN feedback, are considered in the model: the energy released by the BH accretion process and SN explosions couples with the gas and can unbind a huge amount of interstellar gas (Silk & Rees 1998). Although the physical mechanisms that trigger these galaxy-scale winds are still controversial, the model predicts mass ejection rates comparable to the observed ones (Maiolino et al. 2012; Valiante et al. 2012; Cicone et al. 2015).
Following Valiante et al. (2011, 2016) we focus our study on one of the most distant and best studied quasar, J1148, discovered at redshift z ≃ 6.4 (Fan et al. 2003). The observationally inferred properties of this quasar are reported in Table 1. These are used to calibrate the model by fixing the adjustable free parameters shown in Table 2, as described below.
Observed and inferred properties of the quasar SDSS J1148+5251. The black hole mass, MBH, is estimated from the MgII doublet and the λ = 3000 Å continuum (De Rosa et al. 2011). The mass of molecular gas, |$M_{\rm H_2}$|, and the dynamical mass, Mdynsin 2i, have been estimated from CO observations (see Valiante et al. 2014 for more details). The star formation rate, SFR, has been computed from the FIR luminosity using the Kennicutt relation (see Section 3 for further details). The value of LFIR and Mdust has been computed by Valiante et al. (2011, 2014). The bolometric luminosity Lbol is estimated from the observed flux at 1450 Å (Fan et al. 2003) using the bolometric correction by Richards et al. (2006).
| z | MBH [109 M⊙] | MH2 [1010 M⊙ ] | Mdynsin 2i [1010 M⊙] | LFIR [1013 L⊙] | Lbol [1014 L⊙] | |$\rm SFR \, [10^3 \,\mathrm{M}_{{\odot }}\,{\rm yr}^{-1}$|] | Mdust [108 M⊙] |
|---|---|---|---|---|---|---|---|
| 6.42 | 4.9 ± 2.5 | 2.3 ± 1.9 | 3.4 ± 1.3 | 2.2 ± 0.33 | 1.36 ± 0.74 | 2.0 ± 0.5 | |$3.4^{+1.38}_{-1.54}$| |
The calibrated values of the adjustable parameters of the reference model.
| Free parameters | Values | |
|---|---|---|
| |$\epsilon _{\rm d}^{\star }$| | Quiescent star formation efficiency | 0.083 |
| β | BH accretion efficiency | 0.03 |
| ϵAGN | AGN-feedback efficiency | 1.5 × 10⁻³ |
| Free parameters | Values | |
|---|---|---|
| |$\epsilon _{\rm d}^{\star }$| | Quiescent star formation efficiency | 0.083 |
| β | BH accretion efficiency | 0.03 |
| ϵAGN | AGN-feedback efficiency | 1.5 × 10⁻³ |
In what follows, we discuss the new features of the code, namely: (a) the formation of the disc via gas cooling; (b) the formation of the bulge via major mergers; (c) bursted and quiescent star formation both in the disc and in the bulge; (d) the BH seeding prescription; (e) the BH growth via accretion and coalescences, considering also the recoil velocities that can be generated by the product of the merging pair due to asymmetric gravitational wave emission; (f) SNe and AGN feedback, responsible of galactic-scale winds.
We adopt a Lambda cold dark matter (ΛCDM) cosmology with parameters Ωm = 0.314, |$\Omega _\Lambda = 0.686$|, h = 0.674 (Planck Collaboration XVI et al. 2014), so that the Hubble time at redshift 6.4 is 851 Myr. The difference with the cosmological parameters adopted in previous works (Valiante et al. 2011, 2014) is mainly the larger value of σ8 (Planck σ8 = 0.834, 7-year Wilkinson Microwave Anisotropy Probe σ8 = 0.761), which implies an increased power at small scales, leading to a larger number of progenitor systems at high redshifts.
2.1 Gas cooling
In DM haloes with virial temperature Tvir < 104 K, referred to as mini-haloes, the primordial gas can cool only through H2 roto-vibrational transitions (Haiman, Rees & Loeb 1996). As the gas becomes progressively enriched in heavy elements, other molecular species can contribute to cooling and collisionally excited metal fine-structure lines, mostly O i, C ii can provide additional cooling pathways. Here we only consider the contribution of H2, O i and C ii cooling using metallicity-dependent tabulated cooling functions, Λ(Tvir, Z), computed as described in appendix A of Valiante et al. (2016) but we neglect the effect of H2 photo-dissociation by Lyman–Werner photons. We will return to this point in Section 3.
In DM haloes with virial temperatures Tvir ≥ 104 K, referred to as Lyman α cooling haloes, the temperature is high enough to excite atomic transitions, allowing the primordial gas to cool through hydrogen Lyman α line emission. In this regime, we use metallicity-dependent tabulated cooling functions presented by Sutherland & Dopita (1993).
2.2 Disc and bulge formation
Along the hierarchical history of the final DM halo, we define major (minor) halo–halo merger events as those with halo mass ratio μ = Mhalo,1/Mhalo,2 (with Mhalo,1 ≤ Mhalo,2) larger (lower) than μthr = 1/4 (Barausse 2012). In quiescent evolution (i.e. no encounters with other galaxies), the cold gas settles on a rotationally supported disc because of the conservation of angular momentum, and can start to form stars. The disc, composed of gas and stars, can be disrupted by a major merger and a spherical bulge is expected to form in this event. Minor mergers, instead, are not expected to destroy the disc but may help the growth of the bulge by disc instabilities (Naab & Burkert 2003; Bournaud et al. 2005).
In our model, major mergers are supposed to destroy both the gaseous and stellar disc components of the newly formed galaxy, adding the stars and gas to the central bulge. Minor mergers do not contribute to the transfer of matter between the disc and bulge, and thus lead to the formation of a new galaxy with disc and bulge masses that are the sum of the two progenitor ones.
2.2.1 Star formation rate
Hydrodynamical simulations suggest that merging events, major mergers in particular, can trigger bursts of star formation in the central regions as a consequence of the tidal forces produced by galaxy–galaxy interactions (Mihos & Hernquist 1994; Springel 2000; Cox et al. 2008).
2.3 Black hole growth and feedback
2.3.1 BH seeds
We assume BH seeds to form only as remnants of first (Pop III) stars. In fact, our main aim is to investigate if SMBHs can form by super-Eddington accretion starting from ‘light’ seeds at high redshift. Although the initial mass function of Pop III stars is still very uncertain, the most recent numerical simulations suggest a characteristic mass of a few hundreds of solar masses at z ∼ 25, which progressively shifts to a few tens of solar masses at lower redshifts (Hirano et al. 2015). For simplicity, here we do not consider the redshift modulation of the characteristic mass and we plant a BH seed with a mass of Mseed = 100 M⊙ in each newly virialized halo with a metallicity Z < Zcr = 10−4Z⊙, above which the effects of dust and metal line cooling allow the gas to fragment, reducing the characteristic mass to values comparable to those found in local stellar populations (Schneider et al. 2002, 2003, 2012; Omukai et al. 2005).
2.3.2 BH accretion
Once formed, the BH accretes gas from the surrounding medium. The correlation between the mass of central SMBH and the bulge mass or velocity dispersion (Magorrian et al. 1998; Richstone et al. 1998, see Kormendy & Ho 2013 and references therein) and the small scale on which the accretion takes place suggest that the accretion on to the central BH should be fuelled by the cold gas present in the bulge.
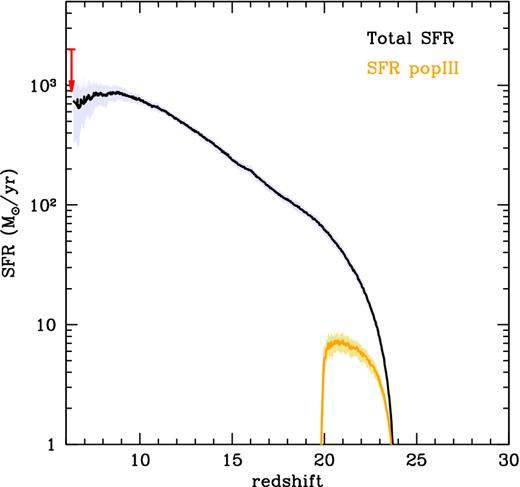
Redshift evolution of the total SFR (black line) and of Pop III stars (orange line), averaged over the 29 realizations. Shaded areas represent 1σ dispersions and the red arrow indicates the upper limit on the SFR inferred from the IR luminosity (see in the text for further details).
Here, we do not describe the time evolution of the BH spin parameter and we simply assume that the module of the spin vector a is randomly extracted from a uniform distribution (Tanaka & Haiman 2009; Barausse 2012).
2.3.3 BH mergers
In halo merging events, we assume that the two nuclear BHs coalesce with the same time-scale of their host haloes. However, in minor mergers (with μ < μthr = 1/4; see Section 2.2) only the largest of the two progenitor BHs can settle in the centre of the new halo potential well, surviving as a nuclear BH, while the smaller one ends up as a satellite.
During the BH merger, the newly formed BH receives a large centre-of-mass recoil due to the net linear momentum carried by the asymmetric gravitational waves emission (Campanelli et al. 2007; Baker et al. 2008; Schnittman et al. 2008). The recoil (or kick) velocity of the coalesced binary depends on the mass ratio of the merging pair and on the amplitude and orientation of the spin vectors of the two BHs. Here we follow the parametrization presented by Tanaka & Haiman (2009) and – for each merger event – we compute the kick velocity as a function of the BH mass ratio assuming the spin vectors to be randomly oriented. The average kick velocities increase with the mass ratio of the merging pair, q = MBH,1/MBH,2 (with MBH,1 ≤ MBH,2). For strongly unequal mass mergers, with 0.01 ≲ q ≲ 0.1, we find 〈vkick〉 = 1–100 km s−1, whereas for larger mass ratios, with 0.1 ≲ q ≲ 1, the kicks can be very strong, with velocities 〈vkick〉 = 100–1000 km s−1.
We then compare the kick velocity with the circular velocity at the radius of influence of the BH, |$R_{\rm BH} = GM_{\rm BH}/v_{\rm c}^2(R_{\rm BH})$| with vc(r) given by equation (10), and we retain the BH only when vkick < vc(RBH). For MBH/Mh = 10−3, the retention velocity is vc(RBH) ∼ 2vvir, where vvir is the escape velocity at the virial radius (Yoo & Miralda-Escudé 2004).
2.3.4 BH feedback
There is now strong observational evidence that the energy released by the quasar can drive powerful galaxy-scale outflows (for recent works see Carniani et al. 2015; Cresci et al. 2015; Feruglio et al. 2015 and references therein). Outflowing gas at velocities up to v ∼ 1400 km s−1 traced by [C ii] emission has been detected in SDSS J1148 (Maiolino et al. 2012) with an estimated total mass outflow rate of 1400 ± 300 M⊙ yr−1 that decreases with distance from the quasar, ranging from a peak value of ∼500 M⊙ yr−1 at ∼3 kpc to ≲ 100 M⊙ yr−1 at ∼20 kpc (Cicone et al. 2015).
In Valiante et al. (2012) we show that the quasar-driven mass outflow rate predicted by GAMETE/QSOdust, on the basis of a simple energy-driven wind, is in good agreement with the observations. Here, we follow a similar approach, adopting the so-called blast wave model, in which the AGN radiation field can accelerate the gas generating fast supersonic winds which propagates outwards through an expanding blast wave, pushing out the surrounding medium (see e.g. Cavaliere, Lapi & Menci 2002; King 2003, 2005, 2010; Lapi, Cavaliere & Menci 2005; Menci et al. 2005, 2008; Zubovas & King 2012, 2014; Costa, Sijacki & Haehnelt 2014, and references therein).
If the post-shock material does not cool efficiently, the bubble expands adiabatically and the outflow is energy-driven. As the blast wave propagates from the centre of the halo, it first interacts with the gas of the disc and bulge, reheating a fraction of cold gas and transferring mass to the diffuse hot phase.
When the shock has propagated beyond the bulge and disc radius, part of the gas mass is ejected from the galaxy, if the binding energy is not enough to hold the material.
3 RESULTS
In this section, we present the predicted evolution of the hierarchical assembly of the SMBH and its host galaxy. To explore the dependence of the results on the population of progenitors and their merger rate, for the same model parameters we have run 30 independent merger trees. In one merger tree we find that a merger occurs at z = 6.43 between two BHs of M1,BH = 1.7 × 10⁹ M⊙ and M2,BH = 1.6 × 10⁹ M⊙, producing a recoil velocity approximately two times higher than the retention speed, vc(RBH). The newly formed BH is displaced from the centre and it stops accreting gas. For this reason, we do not consider this to be a viable formation route for a bright quasar like J1148, and we exclude this merger tree from the sample average.
3.1 The formation of stars and BH seeds
In Fig. 1, we show the redshift evolution of the total SFR (summed over all the progenitor galaxies in each simulation) and the separate contribution of Pop III stars. We also show the upper limit on the SFR of ∼2000 M⊙ yr−1 (Table 1) inferred from the observed FIR luminosity using the relation LFIR/ L⊙ = 10.84 × 10⁹ SFR/( M⊙ yr−1) (Valiante et al. 2014). This relation4 is based on the assumption of starburst-dominated dust heating and it provides only an upper limit to the real SFR, due to the non-negligible contribution from the AGN. According to a recent detailed radiative transfer analysis, the AGN can provide up to 60 per cent of the total FIR luminosity (Schneider et al. 2015), decreasing the SFR by a factor of 1.4–2.5, in agreement with the average value of ∼800 M⊙ yr−1 predicted by the reference model.
Due to efficient metal enrichment, Pop III star formation becomes negligible below z ∼ 20 and no more BH seeds are formed, consistent with other studies (Haiman & Loeb 2001; Madau & Rees 2001; Heger et al. 2003; Volonteri, Haardt & Madau 2003; Madau et al. 2004; Valiante et al. 2016). The mass distribution of DM haloes which host BH seeds ranges between ∼3 × 10⁶ M⊙ and ∼108 M⊙ with a peak at Mh ∼ 107 M⊙, as shown in Fig. 2. Thus, we find that a major fraction (∼90 per cent, on average) of BH seeds are formed in DM mini-haloes, where gas cooling could be easily suppressed due to H2 photo-dissociation by Lyman–Werner photons. The inclusion of this additional feedback effect slows down metal enrichment and extends BH seeds formation to lower redshifts (z ≥ 15) and larger DM haloes (∼5 × 10⁷–109 M⊙). While the evolution of the total BH mass and BH accretion rate at z < 15 is only mildly affected, the birth environment of late-forming seed BHs (gas rich Ly-α cooling haloes) may be more favourable to SE accretion. Here we do not consider the effect of H2 photo-dissociation, which we defer to a future study, and we assume that the formation rate of Pop III stars is limited only by metal enrichment.
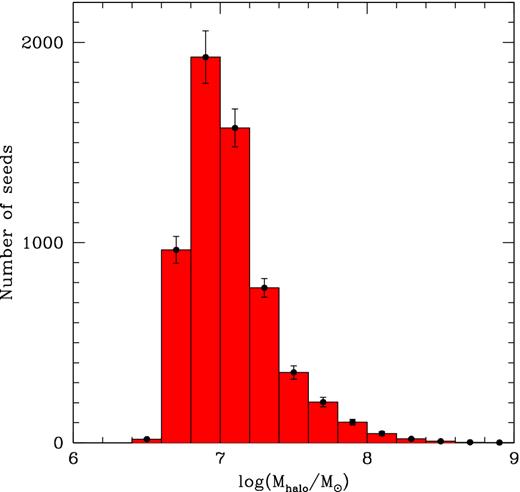
Mass distribution of haloes hosting a newly formed 100 M⊙ BH seed, averaged over the 29 realizations with 1σ error bars.
3.2 BH evolution
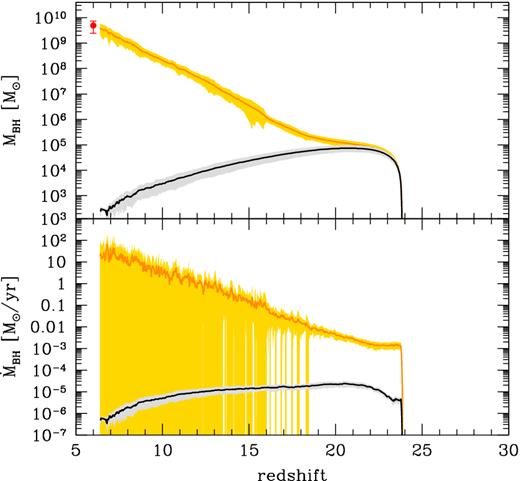
In Fig. 3 we show the redshift evolution of the BH mass and black hole accretion rate (BHAR) predicted by our reference model. In the top panels, the values are obtained summing over all BH progenitors present at each redshift in each simulation and then averaged over the 29 realizations. The different lines allow us to separate the contribution to the BH mass and accretion rate achieved by means of sub-Eddington (≤16 LEdd/c2) and super-Eddington (>16 LEdd/c2) accretion events. By construction, the final BH mass predicted by the reference model is ∼(3.6 ± 1.6) × 109M⊙, in agreement with the value inferred from observations of J1148 (see Table 1). We find that, on average, ∼75 per cent of the final SMBH mass grows by means of super-Eddington gas accretion. This provides the dominant contribution to the total BHAR at all but the smallest redshifts. Although the quantities shown in all panels have been averaged over 29 merger trees, the redshift evolution of the BHAR appears to be very intermittent, a consequence of rapid depletion/replenishment of the bulge gas reservoir out of which the BHs accrete.
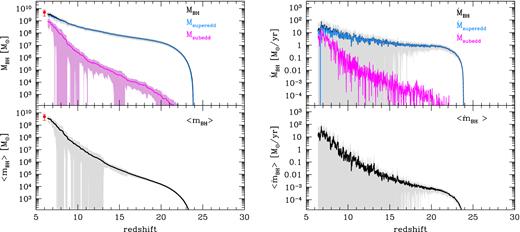
Redshift evolution of the total and mean BH masses and BHARs, averaged over 29 independent merger trees. Shaded areas are 1σ dispersions. Top, left panel: total BH mass (summed over all BH progenitors at each redshift in each simulation, black line) and the BH mass grown by means of sub-Eddington (magenta line) and super-Eddington (cyan line) accretion events. Top, right panel: total BHAR (black line) and BHAR obtained considering only sub- (magenta line) and super- (cyan line) Eddington accreting BHs. The mean BH mass and BHAR (averaged over all BH progenitors at each redshift in each simulation) are shown in the bottom panels (left and right, respectively).
To gain a better idea of the typical values of BH mass and BHAR predicted by the reference model, in the bottom panels of Fig. 3 we also show the mean quantities, averaged over all BH progenitors present at each redshift in each simulation. It is clear that at 20 ≲ z ≲ 25 the mean BH mass rapidly grows from ∼100 M⊙ to ∼104 M⊙ by means of super-Eddington gas accretion rates of 10−5 M⊙ yr−1 ≲ BHAR ≲ 10−3 M⊙ yr−1. Hence, due to early efficient super-Eddington accretion, the mean BH progenitors at z ∼ 20 have already achieved a mass comparable to the BH mass predicted by the direct collapse scenario. This is consistent with what was recently found by Lupi et al. (2016) by means of high-resolution numerical simulations, which show that stellar-mass BHs can increase their mass by 3 orders of magnitudes within a few million years while accreting gas at super-Eddington rates in the dense cores of high-z galaxies.
Fig. 4 shows the average distribution of BHs accreting at super- and sub-Eddington rates as a function of the BH mass and Eddington accretion ratio for different redshift intervals. The reference model predicts that, at 15 ≤ z ≤ 25, almost all BH progenitors accrete at super-Eddington rates. Since the BH masses are still relatively small, 102 M⊙ ≤ MBH ≤ 106 M⊙, BH accretion rates of 10−5 M⊙ yr−1 ≲ BHAR ≲ 5 × 10⁻³ M⊙ yr−1, which characterize the early mass growth (see the bottom right panel of Fig. 3), correspond to very large accretion ratios, |$\dot{M}_{\rm accr}/\dot{M}_{\rm Edd} \sim 10^2\hbox{--}10^4$|. The mass of BH progenitors increases with time and the fractional number of super-Eddington accreting BHs decreases, being fs ∼ 60 per cent at z ∼ 10−15 and dropping to fs ∼ 20 per cent at z < 10. Because of the larger BH masses, the accretion ratios are smaller and |$\dot{M}_{\rm accr}/\dot{M}_{\rm Edd} <500$| at z < 10.
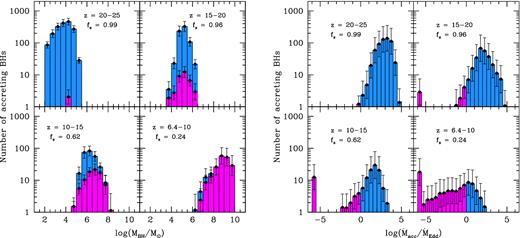
Number of accreting BHs as a function of the BH mass (left panel) and the accretion ratio (right panel), averaged over 29 realizations with 1σ error bars. The histograms show the number of super- (cyan) and sub- (magenta) Eddington accreting BHs. In each figure, we separately show four different redshift intervals and we give the corresponding number fraction of super-Eddington accreting BHs over the total, fs.
For most of the evolution, we find that BH progenitors accrete at highly super-Eddington rates, with |$\dot{M}_{\rm accr}/\dot{M}_{\rm Edd} \gg 10$|. At these large Eddington accretion ratios the applicability of the adopted slim disc solution is highly debated. In fact, recent general-relativistic magneto-hydrodynamical simulations show that BHs accreting at |$20 < \dot{M}_{\rm accr}/\dot{M}_{\rm Edd} < 200$| develop a disc structure that is still radiatively inefficient, with total luminosities that do not exceed ∼10 LEdd, but the total energy escaping the system can be very large, mostly in the form of thermal and kinetic energy of outflowing gas and Poynting flux (Sa̧dowski et al. 2013; McKinney et al. 2014). However, Inayoshi, Haiman & Ostriker (2015) have shown that there exist regimes where steady accretion rates larger than 3000 times the Eddington rate can be sustained.
To better assess the impact of these extreme hyper-Eddington accretion events on our results, we have run the same set of simulations discussed so far but artificially imposing an upper limit of |$\skew4\dot{M}_{\rm accr} \le 20 \, \dot{M}_{\rm Edd} = 320 \, L_{\rm Edd}/c^2$| to the gas accretion rate. The results are shown in Fig. 5. In the same figure, we also show, for comparison, the evolution predicted assuming Eddington-limited accretion. In order to better compare with previous results, this model has been run assuming |$\dot{M}_{\rm accr} \le L_{\rm Edd}/c^2$| (1/16 smaller than the definition adopted in the present study; see equation 25), as conventionally adopted in the literature.
Redshift evolution of the total BH mass (upper panel) and BHAR (lower panel), averaged over 29 independent merger trees. Shaded areas are 1σ dispersions. In each panel, the orange line indicates the predicted evolution assuming |$\dot{M}_{\rm accr} \le 20 \, \dot{M}_{\rm Edd} = 320 \, L_{\rm Edd}/c^2$| and the black line shows the evolution assuming the conventional Eddington limited accretion, |$\dot{M}_{\rm accr} \le L_{\rm Edd}/c^2$| (see text).
We find that, even when the Eddington accretion ratio is |$\dot{M}_{\rm accr}/\dot{M}_{\rm Edd} \le 20$|, the final SMBH mass predicted by the reference model is in good agreement with the observations. The high-redshift evolution of both the total BH mass and the total BHAR, however, is markedly different from the results shown in Fig. 3. At z > 10 the BHAR is several orders of magnitudes smaller and the BH mass is correspondingly affected, being ∼106 M⊙ at z ∼ 15 (∼1/100 of the total BH mass shown in Fig. 3 at the same z). Due to the smaller gas accretion rates at high redshifts, a larger gas fraction is retained around nuclear BHs at z < 10. As a result, the BH mass has a steeper late growth rate, with short episodes of intense gas accretion reaching ∼102 M⊙ yr−1 at z ∼ 7.
On the contrary, when Eddington-limited gas accretion is assumed, the final BH mass can no longer be reproduced using the reference model. In this case, the gas accretion rates are too small to trigger fast BH growth at high redshifts. The total BH mass is dominated by the coalescence of BH seeds and its redshift evolution is strongly affected by lack of BH seeds at z < 20 (see the behaviour of the Pop III SFR in Fig. 1) and by kicks received during BH–BH coalescences in major mergers. Fig. 6 shows the evolution of the average number of major mergers and of kicked BHs predicted by the model. While the average number of major mergers decreases with time, the number of kicked BHs increases at 20 ≲ z ≲ 25 and than decreases at lower z. This is due to the combination of the growing number of BH seeds formed at high z and of the shallow potential wells of their host mini-haloes, which allow the kick velocity of the newly formed BH to easily exceed the retention speed.
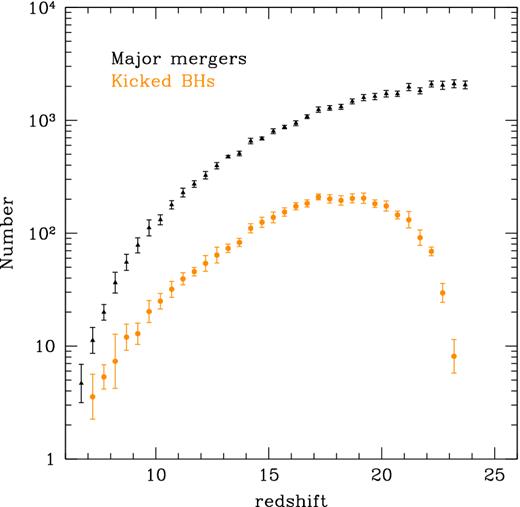
The average redshift distribution of major mergers (black triangles) and of kicked BHs during BH–BH coalescences in the model where |$\dot{M}_{\rm accr} \le L_{\rm Edd}/c^2$| (orange points). Each point has been obtained averaging over 29 different merger tree realizations and the error bars correspond to the 1σ dispersion.
Hence, we can conclude that super-Eddington accretion is fundamental for the formation of the first SMBHs at z > 6, even when extreme hyper-Eddington accretion events are not considered.
3.3 Environmental conditions for Super-Eddington accretion
Our model enables us to perform a statistical study of the physical properties of the environments where BH progenitors accrete at super-Eddington rates. The left panel of Fig. 4 shows that when both sub- and super-Eddington accreting BHs are present, their BH masses are comparable, with a tendency of sub-Eddington accreting BHs to have larger masses at lower z. Similarly, the occurrence of super-Eddington accretion is not correlated with the mass of the host DM halo, nor with its gas content or metallicity. At each given value of any of these quantities, in fact, both sub- and super-Eddington accreting BHs are found in the simulations.
The different accretion regimes are more cleanly separated when we plot the Eddington gas accretion ratio as a function of the ratio between the gaseous bulge and the BH masses (see the left panel of Fig. 7). Most of the BHs that accrete at sub-Eddington rates are characterized by Mb/MBH < 20, whereas the number of super-Eddington accreting BHs is negligible when Mb/MBH < 0.1. However, when 0.1 ≤ Mb/MBH ≤ 20 (the region between the two vertical lines in the plot), the BHs can be characterized by vastly different accretion ratios: a good fraction of the hyper-Eddington accreting BHs are found in this region of the plot. The larger accretion rate in these systems is due to the much shorter dynamical time of the bulge. This is shown in the right panel of Fig. 7. A sequence of increasing bulge dynamical times is evident, with most of the BHs found in bulges with 0.01 Myr ≲ τb < 1 Myr in hyper-Eddington, 0.1 Myr ≲ τb < 20 Myr in mildly super-Eddington, and 5 Myr ≲ τb < 20 Myr in sub-Eddington accretion regimes. Indeed, hyper-Eddington accreting BHs are predominantly found in high-z systems, with less massive and more compact bulges. The figure also shows that super-Eddington accretion requires gas-rich bulges and that, when Mb/MBH < 0.1, only sub-Eddington accreting BHs in massive, gas-poor bulges are found.
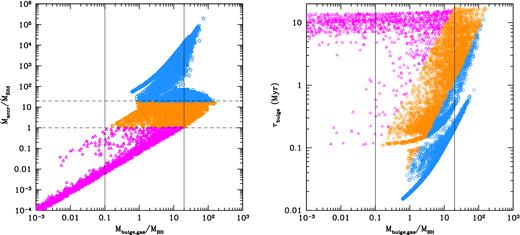
Eddington accretion ratio, |$\dot{M}_{\rm accr}/\dot{M}_{\rm Edd}$| (left panel) and dynamical time-scale of the bulge, τb (right panel), as a function of the bulge gas–BH mass ratio, Mb/MBH. Each point represents an accreting BH in any of the 29 merger histories. Sub-Eddington accreting BHs are shown by magenta triangles, and we separate mildly super-Eddington accreting BHs with |$1 \le \dot{M}_{\rm accr}/\dot{M}_{\rm Edd} \le 20$| (orange squares) and hyper-Eddington accreting BHs with |$\dot{M}_{\rm accr}/\dot{M}_{\rm Edd} > 20$| (cyan circles). The two horizontal dashed lines in the left panel allow us to visually separate these regimes. The vertical lines in both panels give two reference values of Mb/MBH = 0.1 and 20 (see text).
The environmental conditions for super-Eddington accretion that emerge from our statistical study are in good agreement with the results recently found by Lupi et al. (2016). By means of detailed hydro-dynamical simulations, these authors show that, in order to accrete at super-Eddington rates, BHs must be embedded in dense gas structures, with masses comparable or larger than the masses of the accreting BHs.
3.4 BH-driven outflow
Outflowing cold gas in J1148, traced by [C II] emission, was first detected by Maiolino et al. (2012) with the IRAM Plateau de Bure Interferometer, and then confirmed with high-resolution follow-up observations by Cicone et al. (2015). The outflow has a complex morphology and spatial extent, reaching a maximum projected radius of 30 kpc. The estimated mass outflow rate and velocity are shown in Fig. 8 as a function of the projected distance from the nucleus. In the same figure, we also show the predictions of the reference model. Following equation (30), the outflow velocity is computed as the circular velocity at the corresponding radius, vw, AGN(r) = vc(r), and we estimate the mass outflow rate accounting for the delay τdyn = r/vw, AGN between the BH energy release and the observation. Due to the large variability of the BH luminosity, the 1σ dispersion among the different merger trees of the predicted average mass outflow rate (grey shaded region in the upper panel) is consistent with the data. However, the average values (black solid line) are larger than observed and show a different radial dependence, especially at r > 20 kpc. The bottom panel shows that the observed outflow travels at a velocity consistent with the circular velocity of the host system. There are a few radii where the observed values are larger, probably reflecting a stronger coupling between the energy and momentum injected by the AGN and the surrounding gas. Yet, even if we take the observed values of outflow velocities at each radius to estimate τdyn and |$\dot{M}_{\rm w, AGN}$| (see the blue dashed line in the upper panel with the cyan shaded region), the resulting mean mass outflow rate is still larger than observed. Our description of an energy-driven wind with constant coupling efficiency may not be adequate to capture the complex dynamics of this massive outflow. However, Cicone et al. (2015) stress that the data should be considered as a lower limit on the total mass outflow rate, because it accounts only for the atomic gas phase of the outflow, while a significant amount of the outflowing mass may be in the molecular phase.
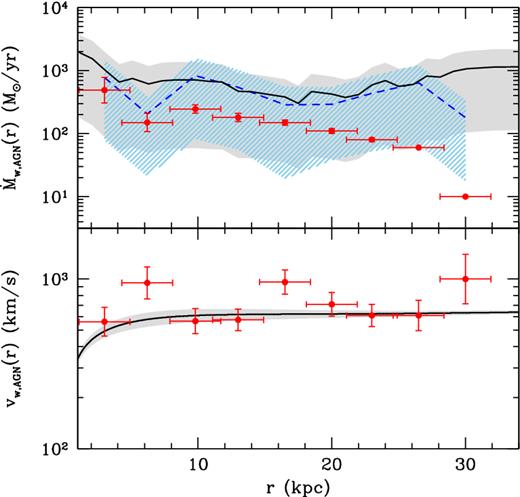
The mass outflow rate (upper panel) and velocity (lower panel) as a function of the projected distance from the nucleus. Cicone et al. (2015) observations are shown with red data points and the predictions of the reference model are shown by black solid lines with shaded grey regions. The blue dashed line in the upper panel (with the cyan dashed region) shows the predicted outflow rate that we would infer using the BH luminosity predicted by the reference model and the observed outflow velocities (see text). The lines show the average among the 29 merger trees and the shaded regions are the 1σ dispersion.
3.5 The coevolution of BHs and their host galaxies
It is interesting to explore the implications of our results for the co-evolution of nuclear BHs and their host galaxies. In Fig. 9 we show the evolutionary path (from the bottom left to the top right) in the mean BH mass–stellar bulge mass (〈mBH〉 - |$\langle m_{\rm b}^{\star }\rangle$|) plane predicted by the reference model (black solid line) and by the model with |$\dot{M}_{\rm accr} \le 20 \, \dot{M}_{\rm Edd}$| (orange solid line). In each simulation, we consider the mean values among all the SMBH progenitors and their hosts present at each redshift, and then we average over the 29 merger trees. For comparison, we also show in the same figure the observational data and the empirical fit (grey data points and dashed line) for local galaxies provided by Sani et al. (2011), and the more recent scaling relation inferred for local ellipticals and classical bulges by Kormendy & Ho (2013, solid green line and shaded region).
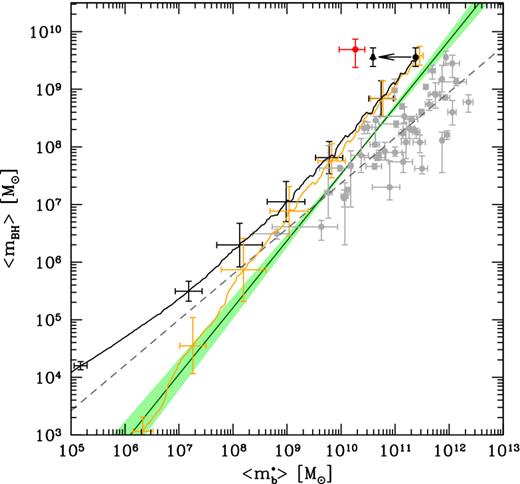
Redshift evolution of the mean BH mass as a function of the mean bulge stellar mass in SMBH progenitors for the reference model (black solid line) and the model with |$\dot{M}_{\rm accr} \le 20 \, \dot{M}_{\rm Edd}$| (orange solid line). Grey circles are data for local galaxies, with the empirical fit (grey dashed line) provided by Sani et al. (2011). The solid green line with shaded region is the scaling relation derived by Kormendy & Ho (2013). The red point represents the BH and stellar mass within a region of 2.5 kpc inferred from observations of J1148 (Table 1). The model predictions are averaged over 29 merger tree realizations and the error bars show the 1σ dispersion for both mean BH and bulge stellar mass, at few selected redshift along the averaged merger histories. The arrow illustrates the reduction in stellar mass if we restrict to the central 2.5 kpc region (black data point; see text).
In the reference model, BH progenitors of the first SMBHs at z > 6 follow a symbiotic evolution, with a small offset with respect to the observed local scaling relation. When |$\dot{M}_{\rm accr} \le 20 \, \dot{M}_{\rm Edd}$|, the different evolution at high z is reflected in a steeper relation between the mean BH mass and the stellar bulge, very close to that predicted by Kormendy & Ho (2013). The difference between the models becomes negligible when 〈mBH〉 > 107 M⊙ (|$\langle m_{\rm b}^{\star }\rangle \, > 10^9 \, \mathrm{M}_{\odot }$|), which occurs – on average – at z ∼ 10.
When the average BH mass has reached its value of (3.6 ± 1.6) × 109 M⊙ at z = 6.4, the host galaxy has already grown to a bulge (total) stellar mass of 2.7 (3.2) × 1011 M⊙. Hence, we predict a final average BH-to-bulge (total) stellar mass ratio of MBH/Mstar = 0.013 (0.011), well within the scatter of the relations inferred from various observational studies of massive local galaxies (Marconi & Hunt 2003; Sani et al. 2011; Kormendy & Ho 2013, and references therein). However, this ratio is ∼25 times smaller than what is inferred from observations of J1148 (red data point). Following the procedure commonly applied to high-z bright QSOs, the stellar mass is computed as |$M_{\rm star} = M_{\rm dyn} - M_{\rm H_2}$|, with Mdyn and |$M_{\rm H_2}$| inferred from CO observations (see Table 1; Walter et al. 2004; Wang et al. 2010). Similar results obtained for a larger sample of z > 6 QSOs have suggested the idea that the first SMBHs grow faster than their host galaxies (Wang et al. 2010, 2013; Venemans et al. 2015; see however Willott, Bergeron & Omont 2015).
As suggested by Valiante et al. (2014), observations of high-z QSOs are sensitive to the innermost 2.5−3 kpc and may be missing a significant fraction of the galaxy (Valiante et al. 2014). This is also supported by recent observations of J1148, which show extended [C II] 158 μm emission and far-infrared (FIR) continuum, likely associated with cold gas and star formation on scales of ∼10–20 kpc (Cicone et al. 2015).
Indeed, the mean bulge effective radius at z = 6.4 predicted by the model is Reff = 7.3 ± 0.8 kpc, in good agreement with observations of local galaxies hosting the largest BHs (see Fig. 10). When we restrict to the innermost 2.5 kpc, we find a mean bulge stellar mass of (3.9 ± 0.2) × 1010 M⊙, much closer to the observation (see the arrow and black data point in Fig. 9). The same is true if we consider the mean gas mass within 2.5 kpc, which we predict to be |$M_{\rm H_2} = (2.0 \pm 0.9) \times 10^{10} \, \mathrm{M}_{\odot }$|, that well reproduces the observed value (see Table 1).
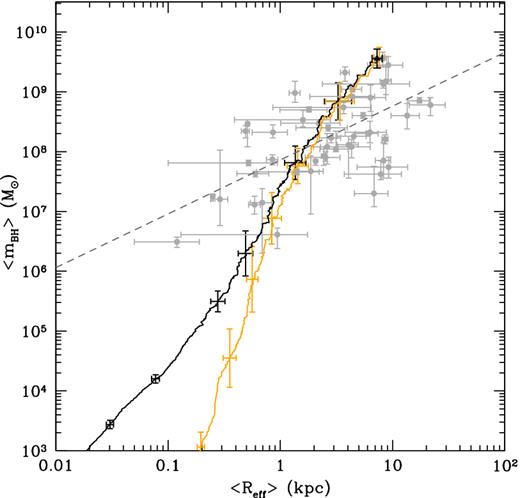
Redshift evolution of the mean BH mass as a function of the mean bulge effective radius of the host galaxy, averaged over 29 merger tree realizations with 1σ error bars at few selected redshift, for the reference model (black solid line), and the model with |$\dot{M}_{\rm accr} \le 20 \, \dot{M}_{\rm Edd}$| (orange solid line). Grey circles represent data for local galaxies, with the empirical fit (grey dashed line) given by Sani et al. (2011).
Finally, the reference model predicts a mean dust mass at z = 6.4 of Mdust = (3.6 ± 0.9) × 108 M⊙, in good agreement with the value inferred from the FIR luminosity. This result has been obtained using the chemical evolution module, which includes dust processing in a two-phase ISM, that has been developed by Valiante et al. (2011, 2014) and de Bennassuti et al. (2014). Hence, consistent with previous findings (Valiante et al. 2011, 2014), we find that the large dust mass that has enriched the ISM of the host galaxy is the result of a large stellar component, and that the apparent tension with the observed dynamical mass – the so-called stellar mass crisis – is at least partly due to the small spatial extent of the observations. We refer the interested readers to Valiante et al. (2014) for an extended discussion on this point.
4 DISCUSSION AND CONCLUSIONS
The data-constrained model GAMETE/QSOdust allows us to explore a large number of formation histories of a given quasar, in the present case J1148 at z = 6.4, reproducing the observations of the quasar and its host galaxy. With the adjustable free parameters that we have selected, described in Table 2, the model reproduces the physical quantities listed in Table 1. Hence, the properties that we predict for the host galaxy of J1148 (SFR, dust mass, gas and stellar masses) are consistent with previous results obtained by Valiante et al. (2014, 2016) for the same quasar.
With respect to Valiante et al. (2011, 2014, 2016), the current version of GAMETE/QSOdust enables us to (i) follow the formation and evolution of the disc and bulge in each progenitor galaxy, and (ii) remove the constraint of Eddington-limited BH accretion.
In particular, Valiante et al. (2016) find that the formation of a few (between 3 and 30 in the reference model) heavy BH seeds with masses MBH = 105 M⊙ enables the Eddington-limited growth of a SMBH by z = 6.4. This conclusion heavily depends on the occurrence – among the progenitors – of Lyman α cooling haloes where gas cooling is suppressed by the low-metallicity and strong Lyman–Werner background (Valiante et al. 2016). This ‘head start’ requires favourable conditions, which are easily erased by the joint interplay of chemical, radiative and mechanical feedback effects.
Here we have explored the alternative scenario where the BHs can grow through a radiatively inefficient slim disc at super-Eddington rates. This condition is easily met by light BH seeds formed in gas-rich systems at high redshifts.
In the model presented in this work, we plant light BH seeds in newly virialized haloes above redshift z ∼ 20, before the effects of chemical feedback inhibit the formation of metal-poor (Z < Zcr) stars. With this seeding prescription, we find the following.
On average, ∼80 per cent of the SMBH mass of J1148 is provided by super-Eddington gas accretion (>16 LEdd/c2). This represents the dominant contribution to BH growth down to z ∼ 10.
Due to fast and efficient super-critical accretion, the mean BH mass at redshift z ∼ 20 is ≳ 104 M⊙, comparable to that predicted for heavy BH seeds formed by direct collapse.
More than 90 per cent of BH progenitors accrete at super-Eddington rates at 15 < z < 25 in dense, gas-rich environments. At these redshifts, hyper-Eddington accretion events, with |$\dot{M}_{\rm accr}/\dot{M}_{\rm Edd} \sim 10^2-10^4$|, are common.
The observed SMBH mass of J1148 at z = 6.4 can be reproduced even adopting a maximum super-Eddington accretion rate of |$\dot{M}_{\rm accr} \le 20 \, \dot{M}_{\rm Edd}$|, showing that hyper-critical accretion is not required.
BH progenitors of the final SMBH evolve in symbiosis with their host galaxies. The predicted AGN-driven mass outflow rate at z = 6.4 shows a radial profile that is broadly consistent with the lower limits inferred from C ii observations by Cicone et al. (2015);
The predicted final BH-to-bulge (total) stellar mass ratio, MBH/Mstar = 0.013 (0.011), is within the scatter of the observed local relation and a factor of ∼25 lower than inferred from dynamical mass observations of J1148. The discrepancy is significantly reduced if we account for the mass within 2.5 kpc from the nucleus, the region targeted by CO data. At this radius, the mean bulge stellar mass is (3.9 ± 0.2) × 1010 M⊙, much closer to the observational value.
As a consequence of the lower gas accretion rates, the average BH mass predicted by Valiante et al. (2016) is much smaller than in our reference model, at all but the latest redshifts (see their fig. 3). This difference is reduced when we impose that |$\dot{M}_{\rm accr} \le 20 \, \dot{M}_{\rm Edd}$|. In this case, the average BH progenitor mass at z ∼ 15 is comparable in the two models. However, while in Valiante et al. (2016) the mass growth is triggered by the formation of heavy seeds, in our model this is achieved by mildly super-Eddington accretion on light BH seeds.
The progenitors of SMBHs at z > 6 experience the strong form of coevolution defined by Kormendy & Ho (2013), where galaxies affect BH growth by controlling BH feeding and merging, and BHs control galaxy properties via AGN feedback. In fact, while the small radiative efficiencies of super-Eddington accreting BHs are indispensable to limit the effects of AGN feedback (Lupi et al. 2016), at z > 10 the BHs shine at a few Eddington luminosities with a noticeable effect on the cold gas content of their host galaxies. At lower z, an increasing fraction of BH progenitors accrete at sub-Eddington rates, but with larger radiative efficiencies. As a result of the larger BH mass and BH accretion rates, AGN-driven winds at z < 10 power strong galaxy-scale outflows and suppress star formation, leading to the down-turn of the total SFR shown in Fig. 1.
In Fig. 11, we show the average bolometric luminosity as a function of the average BH mass of SMBH progenitors for the reference model (black solid line) and for the model with |$\dot{M}_{\rm accr} \le 20 \, \dot{M}_{\rm Edd}$| (yellow solid line). The model predictions are compared with observations of SDSS J1148 (z = 6.4) and of the most distant quasar currently known, ULAS J1120 at z = 7.1 (Mortlock et al. 2011). The error bars on the bolometric luminosities account for the observational uncertainties on the flux at 1450 Å and on the bolometric corrections (Richards et al. 2006). Some reference values of the luminosity in units of the Eddington luminosity are shown by the diagonal dashed lines. The difference among the two models reflects the different BH accretion history: in the model with |$\dot{M}_{\rm accr} \le 20 \, \dot{M}_{\rm Edd}$| the first BH progenitors accrete at a lower rate, saving cold gas for the latest evolutionary phases. As a result, for BH progenitors with MBH ≲ 108 M⊙, the mean luminosity predicted by the reference model is always super-Eddington (with Lbol > 10 LEdd when MBH ≲ 106 M⊙), whereas in the model with |$\dot{M}_{\rm accr} \le 20 \, \dot{M}_{\rm Edd}$| the mean luminosity is always 0.1 LEdd < Lbol < LEdd. However, in the latest evolutionary phases, when MBH > 108 M⊙, this trend is reversed. Given the observational uncertainties and the large variability among different merger trees, the luminosity of J1148 is consistent with the model predictions. Interestingly, the data point of ULAS J1120 is also lying within the 1σ dispersion. Indeed, we find that ∼20 per cent of BH progenitors at z = 7.1 have luminosities and masses compatible with the observed values of ULAS J1120, indicating that this quasar may be one of the progenitors of SDSS J1148 at z = 6.4.
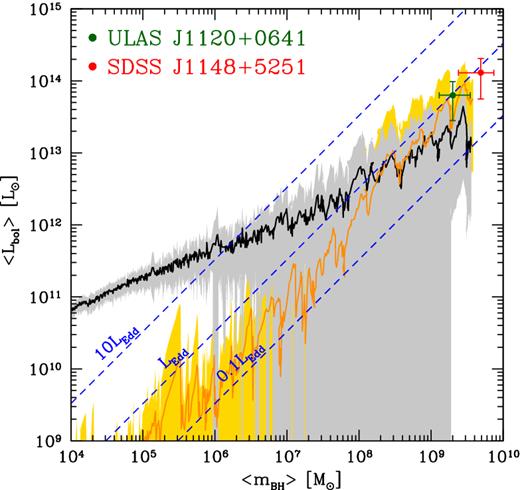
Mean bolometric luminosity of BH progenitors as a function of the mean BH mass predicted by the reference model (black solid line) and by the model with |$\dot{M}_{\rm accr} \le 20 \, \dot{M}_{\rm Edd}$| (yellow solid line). For each model, the lines show the average among the 29 merger trees and the shaded regions are the 1σ dispersion. The data points show the observational values of the two quasars SDSS J1149 (red circle) and ULAS J1120 (green square). The diagonal dashed lines show some reference values of the luminosity in units of the Eddington luminosity.
We thank Valeria Ferrari, Nicola Menci and Marta Volonteri for useful discussions and comments. The research leading to these results has received funding from the European Research Council under the European Unions Seventh Framework Programme (FP/2007-2013) / ERC Grant Agreement n. 306476.
Note that if rcool > Rvir we assume that the gas never reaches hydrostatic equilibrium and it is immediately available to star formation (De Lucia et al. 2010).
Unfortunately, numerical studies of the concentration parameter of DM haloes spanning the mass and redshift range relevant for the present study are not available. Extrapolating the results of Muñoz-Cuartas et al. (2011), we adopt a constant value of c = 1. At a fixed halo mass, BH growth would be favoured in more concentrated haloes, which are characterized by a larger mass and circular velocity in the inner regions (Mo et al. 1998).
Reff is the effective radius of the isophote enclosing half the light.
The conversion factor between the FIR luminosity and the SFR has been obtained assuming a 10–200 Myr burst of stars with solar metallicity and a Larson IMF with mch = 0.35M⊙ (Valiante et al. 2014).
REFERENCES
