


Abstract
We present multisightline absorption spectroscopy of cool gas around three lensing galaxies at z = 0.4–0.7. These lenses have half-light radii re = 2.6–8 kpc and stellar masses of log M*/M⊙ = 10.9–11.4, and therefore resemble nearby passive elliptical galaxies. The lensed QSO sightlines presented here occur at projected distances of d = 3–15 kpc (or d ≈ 1–2 re) from the lensing galaxies, providing for the first time an opportunity to probe both interstellar gas at r ∼ re and circumgalactic gas at larger radii r ≫ re of these distant quiescent galaxies. We observe distinct gas absorption properties among different lenses and among sightlines of individual lenses. Specifically, while the quadruple lens for HE 0435−1223 shows no absorption features to very sensitive limits along all four sightlines, strong Mg ii, Fe ii, Mg i, and Ca ii absorption transitions are detected along both sightlines near the double lens for HE 0047−1756, and in one of the two sightlines near the double lens for HE 1104−1805. The absorbers are resolved into 8–15 individual components with a line-of-sight velocity spread of Δ v ≈ 300–600 km s−1. The large ionic column densities, log N ≳ 14, observed in two components suggest that these may be Lyman limit or damped Ly α absorbers with a significant neutral hydrogen fraction. The majority of the absorbing components exhibit a uniform supersolar Fe/Mg ratio with a scatter of <0.1 dex across the full Δ v range. Given a predominantly old stellar population in these lensing galaxies, we argue that the observed large velocity width and Fe-rich abundance pattern can be explained by SNe Ia enriched gas at radius r ∼ re. We show that additional spatial constraints in line-of-sight velocity and relative abundance ratios afforded by a multisightline approach provide a powerful tool to resolve the origin of chemically enriched cool gas in massive haloes.
1 INTRODUCTION
For over two decades, QSO absorption spectroscopy has provided a sensitive probe of low-density intergalactic gas, circumgalactic medium (CGM), and interstellar medium (ISM) which are otherwise too diffuse to be detected in emission beyond the local Universe (e.g. Verheijen et al. 2007). Traditionally, the physical properties of the extended gas around galaxies, such as spatial extent, mean covering fraction, and total mass content, are characterized using a statistical approach over an ensemble of projected galaxy–background QSO pairs. This approach has yielded statistically significant constraints for the chemically enriched CGM around both star-forming and quiescent galaxies based on searches of strong absorption transitions, including the Mg ii λλ 2796, 2803 absorption doublet (e.g. Bowen, Blades & Pettini 1995; Chen et al. 2010; Kacprzak et al. 2011; Lovegrove & Simcoe 2011) and the hydrogen Lyman series (e.g. Lanzetta et al. 1995; Chen et al. 1998; Tripp, Lu & Savage 1998; Rudie et al. 2013; Tumlinson et al. 2013; Liang & Chen 2014; Johnson, Chen & Mulchaey 2015). In contrast, absorption-line observations of diffuse gas in interstellar space have been limited because the ISM of distant galaxies has a much smaller cross-section and closely projected QSO and galaxy pairs are rare.
Despite significant progress in characterizing the CGM, the origin of cool, metal-enriched gas around galaxies remains ambiguous. Possible mechanisms to produce cool gas in a hot halo include outflows from supergalactic winds (e.g. Murray, Ménard & Thompson 2011; Booth et al. 2013), stripped satellites due to tidal interactions or ram pressure (e.g. Wang 1993; Agertz, Teyssier & Moore 2009; Gauthier 2013), gas accreted from the intergalactic medium (IGM, e.g. Rauch, Haehnelt & Steinmetz 1997; Nelson et al. 2013), as well as in situ cloud formation from thermal instabilities (e.g. Mo & Miralda-Escude 1996; Maller & Bullock 2004; Sharma et al. 2012). A number of CGM observations targeting star-forming galaxies have suggested that one or a combination of the above scenarios are at play, such as outflows (Bordoloi et al. 2011) or a combination of outflowing and infalling gas (e.g. Bouché et al. 2012; Kacprzak, Churchill & Nielsen 2012). These findings have been based on a simple assumption that outflows occur along the rotation (minor) axis, while accretion proceeds along the disc plane (major axis). However, complications arise when considering the required energetics to drive the observed velocity field of the gas (e.g. Gauthier & Chen 2012) and possible spin-filament alignment with the cosmic web (e.g. Tempel, Stoica & Saar 2013) which, in the absence of galactic-scale outflows, would also give rise to an elevated incidence of absorbers along the minor axis of disc galaxies.
To better discriminate between different scenarios for the origin of metal-line absorbers, both spatially resolved gas kinematics and knowledge of galaxy star formation history are necessary. As shown in multiwavelength imaging observations of local starburst galaxies (e.g. Suchkov et al. 1996; Cecil et al. 2001), stronger constraints for gas flows in galactic haloes can be obtained from the observed spatial variations in the velocity field and physical conditions of the gas. In a pilot project, Chen et al. (2014) also demonstrated that multisightline observations of the CGM using a quadruply lensed QSO, coupled with high-resolution imaging of the associated galaxies, enable direct measurements of the velocity gradient and coherence length of the absorbing gas. In turn, these measurements provide critical constraints for distinguishing between different gas flow models.
An added advantage of studying lensed QSO fields is the opportunity of probing distant ISM by targeting the lensing galaxies. In this paper, we apply three multiply lensed QSOs, HE 0047−1756, HE 0435−1223, and HE 1104−1805, to study the inner halo gas content of their lensing galaxies at z = 0.4–0.7. By targeting the lensing galaxies, our study focuses on the cool gas around massive, early-type galaxies (e.g. Keeton, Kochanek & Falco 1998). These galaxies exhibit optical colours and spectral features that are characteristic of nearby elliptical galaxies. Although these evolved galaxies exhibit little/no ongoing star formation, they are not all devoid of cold gas. Systematic H i and CO searches have uncovered a non-negligible amount of neutral gas in roughly 40 per cent of nearby ellipticals (e.g. Oosterloo et al. 2010; Young et al. 2014), suggesting that some feedback processes are in effect to prevent continuing star formation in these gas-rich quiescent galaxies (e.g. McNamara & Nulsen 2007; Conroy, van Dokkum & Kravtsov 2015). In addition, morphologies of the detected neutral gas span a broad range, from regular disc- or ring-like structures to irregular distributions of clumps and/or streams (e.g. Oosterloo et al. 2007; Serra et al. 2012) with roughly 1/4 displaying centralized disc or ring-like structures (Serra et al. 2012). These different morphologies indicate possibly different origins of the gas in different galaxies, including left-over materials from previous mergers and newly accreted gas from the CGM/IGM. These gas-rich, quiescent galaxies therefore provide an important laboratory for studying the physical processes that regulate/terminate star formation in the presence of cold gas in massive galaxies.
Incidentally, QSO absorption-line spectroscopy carried out in the vicinities of red galaxies at intermediate redshift, z ∼ 0.5, continues to uncover extended cool halo gas to projected distances beyond d ≈ 100 kpc (e.g. Gauthier, Chen & Tinker 2009, 2010; Bowen & Chelouche 2011; Thom et al. 2012; Huang et al. 2016), demonstrating that there may indeed be sufficient supplies of cool gas in these massive quiescent haloes. Absorption spectroscopy along multiple sightlines in the vicinities of lensing galaxies is particularly interesting, because the small projected distances of these lensed QSO sightlines from the lensing galaxies at d = 3–15 kpc (or d = 1–2 re) provide an unprecedented opportunity to probe and spatially resolve the cool gas content both in the interstellar space and in the haloes of quiescent galaxies.
The fields are chosen because of the available high-quality optical and near-infrared imaging data in the Hubble Space Telescope (HST) archive, which enable a detailed morphological study of galaxies near the QSO sightlines. In addition, we have targeted relatively wide-separation gravitational lens systems with angular separations θ ≳ 1.5 arcsec and relatively bright lensed QSO images with g-band magnitude of g ≲ 19.5. These selection criteria are chosen to facilitate high-resolution echelle spectroscopy of the lensed QSOs on the ground. The wide separation ensures that the lensed QSO images are not blended under typical sub-arcsecond seeing conditions on the ground, allowing these lensed QSO images to serve as independent probes of the foreground CGM at multiple locations. The brightness limit ensures a relatively high observing efficiency of QSO echelle spectroscopy under limited observing resources.
As described in Section 3 below, all three lensing galaxies presented here are old and massive with stellar masses in the range of log M*/M⊙ = 10.9–11.4. The available QSO echelle spectra cover a spectral range from ≈3300 Å to beyond 6000 Å, which allow us to search for absorption features due to Fe ii, Mg ii, Mg i, and Ca ii transitions at the redshift of each lensing galaxy. These transitions are commonly seen in the diffuse interstellar and circumgalactic gas of temperature T ∼ 104 K in the Milky Way and in distant galaxies (e.g. Savage & Sembach 1996; Rao, Turnshek & Nestor 2006). The presence of such cool gas, together with the expected presence of a hot X-ray emitting halo around massive elliptical galaxies (e.g. O'Sullivan, Forbes & Ponman 2001), would indicate a multiphase nature of extended gas around these lensing galaxies. The observed velocity gradient across the lensing galaxy, together with the relative abundance pattern between different ions, also offers a unique opportunity to directly test the origin of the observed cool gas in these massive, quiescent haloes.
This paper is structured as follows. In Section 2, we describe relevant imaging and spectroscopic observations and data reduction. In Section 3, we describe the empirical properties that can be extracted from available imaging and spectroscopic data. Specifically, we summarize the general observable quantities of the lensing galaxies in Section 3.1 and absorbing gas properties in Section 3.2. Observational findings of individual fields are presented in Section 4, and analysis of absorbing gas properties, including the ionization state, chemical abundance pattern, and spatial coherence in gas kinematics, is presented in Section 5. We discuss the implications for the origin of chemically enriched cool gas near massive, quiescent galaxies in Section 6, and present a summary of our findings/conclusions in Section 7. We adopt a ΛCDM cosmology, ΩM = 0.3 and |$\Omega _\Lambda = 0.7$|, with a Hubble constant H0 = 70 km s−1 Mpc−1 throughout the paper. All magnitudes and colours reported here are in the AB system.
2 OBSERVATIONS AND DATA REDUCTION
The study presented in this paper focuses on three multiply lensed QSO fields, HE 0047−1756, HE 0435−1223, and HE 1104−1805, with the lensing galaxies identified at z = 0.4–0.7. Fig. 1 shows the lensing configurations of these fields. The relatively wide separation (θlens ≳ 1.5 arcsec) enables the application of these lensed QSO images as independent probes of the inner gaseous halo around each of the lensing galaxies based on QSO absorption spectra obtained on the ground. Here we describe relevant imaging and spectroscopic data of the lensing galaxies, as well as echelle spectroscopy of the lensed QSOs.
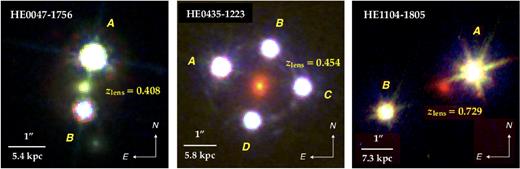
False colour composite images of three gravitational lens systems in our study. The composite images were produced using the HST/ACS WFC and the F555W and F814W filters and NICMOS and the F160W filter for HE0047−1756, HST/WFC3 UVIS channel and the F275W filter and ACS WFC and the F555W and F814W filters for HE 0435−1223, and HST/WFC3 UVIS channel and the F275W filter and WFPC2 and the F555W and F814W filters for HE 1104−1805 (see Table 1 for details). The imaging data were retrieved from the HST data archive (see Section 2.1 for descriptions). For each system, the lensing galaxy is located at the centre of each panel with the horizontal bar in the lower-left corner indicating the 1 arcsec angular scale and the corresponding physical distance at the redshift of the lens. Using absorption spectra of the lensed QSOs, we are able to probe halo gas around the lens on projected distance scales of d ∼ 3–15 kpc across the centre of each lensing galaxy. Note that the lensing galaxy of HE 0047−1756 exhibit consistently red colours as those of HE 0435−1223 and HE 1104−1805 (see Tables 3 and 4). The available F275W images for the fields around HE 0435−1223 and HE 1104−1805 provide strong contraints for a lack of young stars in these lensing galaxies. As a result, the lensing galaxies appear to be red in the composite images that include the F275W band. However, a UV image is not available for the field around HE 0047−1756. Including available optical and NIR images results in the apparent bluer colour of this lensing galaxy.
2.1 Imaging observations
Exquisite optical and near-infrared images of the lensed QSO fields were retrieved from the HST data archive. Details of the imaging observations are summarized in Table 1. All imaging data were processed using the standard HST reduction pipeline, and individual dithered exposures were drizzle-combined using the astrodrizzle package in each bandpass. Given slight differences in WCS solutions between different bandpasses, the co-added images were then registered to a common origin using point sources in each field. In Fig. 1 we show false colour composite images of the three lens systems, where it can be seen that at the redshift of each lens, absorption spectroscopy of the lensed QSOs allows us to probe the gaseous halo on projected distance scales of d ∼ 3–15 kpc from the centre of each lensing galaxy.
Journal of imaging observations with the HST.
| Field | Instrument | Filter | Exp time | PID | PI |
|---|---|---|---|---|---|
| (s) | |||||
| HE 0047−1756 | ACS-WFC | F555W | 670 | 9744 | C. Kochanek |
| ACS-WFC | F814W | 670 | 9744 | C. Kochanek | |
| NICMOS | F160W | 2620 | 9744 | C. Kochanek | |
| HE 0435−1223 | WFC3-UVIS | F275W | 11360 | 11732 | C. Kochanek |
| ACS-WFC | F555W | 760 | 9744 | C. Kochanek | |
| ACS-WFC | F814W | 1440 | 9744 | C. Kochanek | |
| WFC3-IR | F160W | 9580 | 12889 | S. Suyu | |
| HE 1104−1805 | WFC3-UVIS | F275W | 12620 | 11732 | C. Kochanek |
| WFPC2-PC | F555W | 9600 | 9138 | C. Impey | |
| WFPC2-PC | F814W | 8500 | 9138 | C. Impey | |
| WFC3-IR | F160W | 14380 | 12889 | S. Suyu |
2.2 Galaxy spectra
Optical spectra of two of the lensing galaxies, HE 0047−1756 and HE 0435−1223, were published in Eigenbrod et al. (2006), and kindly made available to us by F. Courbin. A brief description of the spectroscopic observations and spectra extraction is provided here.
The low-resolution spectra (R ≡ λ/Δ λ = 210 at 5900 Å) of the lenses were obtained using the FOcal Reducer and low dispersion Spectrograph (FORS1) mounted on the European Southern Observatory Very Large Telescope (ESO/VLT). The observations were carried out using a 1 arcsec slit under mean seeing conditions of FWHM ≈ 0.5–0.6 arcsec. Due to a significant amount of contaminating light in the galaxy spectra from the lensed QSO images, Eigenbrod et al. (2006) employed a spectral deconvolution algorithm to optimally extract the spectrum of the lensing galaxy. These authors applied the wavelength dependent spatial profiles of known stellar (PSF) sources to deconvolve the observed two-dimensional spectra of both the lensing galaxy and the lensed QSO based on their known relative positions along the slit. The extracted galaxy spectra show minimal residual presence of broad emission features expected from the QSO, demonstrating the success of the spectral deconvolution algorithm employed by Eigenbrod et al. (2006). Flux calibrations of the galaxy spectra were performed using the same PSF stars adopted in the deconvolution routine. Wavelengths were calibrated to air.
These optical spectra allow us to check the redshifts of the galaxies based on vacuum wavelengths, providing the rest frame necessary for studying halo gas kinematics using QSO absorption spectroscopy, and to characterize the stellar population and star formation history based on various line indices. We present in Fig. 2 the extracted spectra of the lensing galaxies for HE 0047−1756 in the top panel and for HE 0435−1223 in the bottom panel, along with their corresponding 1σ error spectra. Both spectra show the prominent absorption features such as Ca ii H&K doublet, G-band, and Mg b, and a strong 4000-Å spectral discontinuity that are characteristic of a quiescent galaxy with no trace of ongoing star formation. Using a cross-correlation analysis with model spectra constructed from the eigen spectra of the Sloan Digital Sky Survey (SDSS) spectroscopic galaxy sample (e.g. Chen et al. 2010), we estimate the redshift of the lensing galaxy at z = 0.408 ± 0.001 for HE 0047−1756, consistent with previous measurements of Eigenbrod et al. (2006) and Ofek et al. (2006). The lens redshift of HE 0435−1223 was estimated to be z = 0.454 ± 0.001, consistent with the measurements of Eigenbrod et al. (2006) and Morgan et al. (2005). The redshift accuracy is clearly limited by the spectral resolution and the broad absorption width of available spectral features.
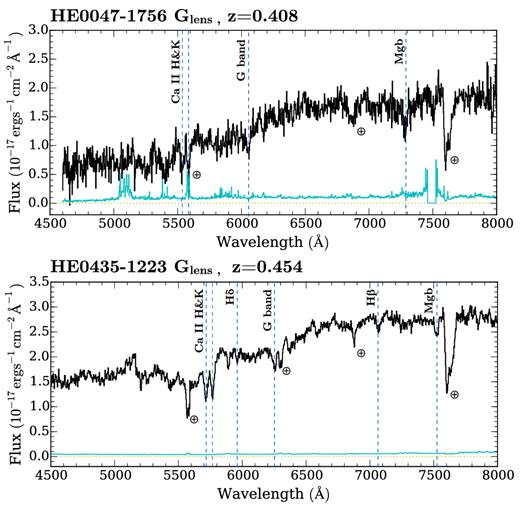
Optical spectra of the lensing galaxies of HE 0047−1756 (top panel) and HE 0435−1223 (bottom panel) at respective redshifts of z = 0.408 ± 0.001 and z = 0.454 ± 0.001 from Eigenbrod et al. (2006). The corresponding 1σ error spectrum of each galaxy is shown in cyan above the zero flux line (dotted line). The galaxy spectra are dominated by prominent absorption lines such as Ca ii H&K, G-band, and Mg b as by dashed lines. Night-sky absorption bands and emission line residuals are also marked by an earth symbol.
We do not have the optical spectrum of the HE 1104−1805 lens and therefore adopt the published redshift of z = 0.729 ± 0.001 from Lidman et al. (2000) as the rest frame of the galaxy in the subsequent analysis.
2.3 QSO echelle spectroscopy
High-resolution echelle spectra of the doubly lensed QSO HE 0047−1756 and the quadruply lensed QSO HE 0435−1223 were obtained using the MIKE echelle spectrograph (Bernstein et al. 2003) on the Magellan Clay Telescope. Following Chen et al. (2014), echelle spectroscopic observations were carried out in the fall semester of 2013 using a 1 arcsec slit and an aggressive binning of 2 × 4 (spatial × spectral) during readout to increase observing efficiency of these relatively faint QSOs. The mean seeing conditions over the observing period were ≈0.5–0.7 arcsec. The observing setup delivers a spectral resolution of FWHM ≈ 12 km s−1 over the spectral range from λ = 3200 Å to λ = 1 μm. While the heavy binning does not allow us to fully resolve individual resolution components, it is sufficient to resolve velocity structures on scales as small as ∼10 km s−1. A summary of MIKE observations is presented in Table 2.
Journal of QSO echelle spectroscopy.
| QSO image | zem | Instrument | Exp time | Date |
|---|---|---|---|---|
| (s) | ||||
| HE 0047−1756 A | 1.676 | MIKE | 7200 | 2013/11 |
| HE 0047−1756 B | 1.676 | MIKE | 5700 | 2013/11 |
| HE 0435−1223 A | 1.689 | MIKE | 5400 | 2013/11 |
| HE 0435−1223 B | 1.689 | MIKE | 5400 | 2013/11 |
| HE 0435−1223 C | 1.689 | MIKE | 10800 | 2013/11 |
| HE 0435−1223 D | 1.689 | MIKE | 10800 | 2013/10 |
| HE 1104−1805 A | 2.305 | HIRES | 19300 | 1997/02 |
| UVES | 19000 | 2001/06 | ||
| HE 1104−1805 B | 2.305 | HIRES | 51200 | 1997/02 |
| UVES | 19000 | 2001/06 |
The MIKE spectra were reduced using a custom data reduction pipeline described in Chen et al. (2014). In summary, each raw spectral image was bias-subtracted and corrected for pixel-to-pixel variations using twilight flats obtained through a diffuser. A ThAr comparison frame, obtained immediately following every science exposure, was used to create a two-dimensional wavelength map, which was corrected to vacuum and heliocentric wavelengths. For each echelle order, the QSO spectrum was optimally extracted using a Gaussian profile that matched the spatial profile of the QSO. To prevent possible contamination from neighbouring QSO images (in the case of HE 0435−1223) that were rotated into the slit during individual exposures, we made sure to mask the trace of neighbouring objects during the spectral extraction procedure. Relative flux calibrations were performed using a sensitivity function determined from observations of a spectrophotometric standard star taken during the same night as the QSO observations. Individual flux-calibrated echelle orders from different exposures were co-added and combined to form a single continuous spectrum per QSO image. Finally, the combined spectrum was continuum normalized using a low-order polynomial function that fits the spectral regions free of strong absorption features. In the spectral region around the systemic redshifts of the lensing galaxies, the mean S/N per resolution element is found to be ≈20–50 for the two QSO images of HE 0047−1756, and S/N ≈ 10–15 per resolution element for all four images of HE 0435−1223.
High-resolution echelle spectra of the doubly lensed QSO HE 1104−1805 were obtained using High Resolution Echelle Spectrometer (HIRES; Vogt et al. 1994) on the Keck I Telescope. The observations were carried out in 1997 February (Rauch, Sargent & Barlow 2001) using a 0.86 arcsec slit that delivered a spectral resolution of FWHM ≈ 6.6 km s−1 over the spectral range from λ = 3600 Å to λ = 6100 Å. Additional echelle observations of the QSOs were obtained using the VLT UV-Visual Echelle Spectrograph (UVES) in 2011 June (Lopez et al. 2007) and kindly provided to us by Dr Sebastián López. The final combined spectra cover a wavelength range from λ = 3050 Å to λ = 6850 Å with a spectral resolution of FWHM ≈ 6.7 km s−1. The mean S/N for image A is S/N ≈ 80 per pixel and S/N ≈ 50 per pixel for image B. Comparisons of absorption line profiles between the continuum normalized HIRES and UVES spectra show excellent agreement between the two data sets. The additional UVES spectra offer coverage for the Ca ii λ 3934 absorption transition at the redshift of the lensing galaxy. A summary of the HIRES and UVES observations is also included in Table 2.
3 LENSING GALAXY AND ABSORBING GAS PROPERTIES
A principal goal of our multisightline study is to examine whether/how spatially resolved halo gas kinematics from high-resolution QSO absorption spectroscopy correlate with the observed properties of the lensing galaxy. In this section, we describe the galaxy properties and halo gas absorption properties that were extracted from the data described in Section 2.
3.1 Galaxy properties
The available imaging and spectroscopic data of the lensing galaxies described in Sections 2.1 and 2.2 allow us to examine in detail their optical morphologies and stellar population, thereby constraining the stellar structure and star formation history.
To analyse the morphologies of the lensing galaxies, we have developed a custom computer program to obtain a best-fitting two-dimensional surface brightness profile of each of the lensing galaxies. The results of the surface brightness analysis include morphological parameters (such as effective radius, ellipticity, etc.), and total flux.
Of the images available in each field (Table 1), the F814W images offer the best combination of fine spatial sampling and sufficient sensitivity for tracing the dominant stellar population in the rest-frame optical window. While the two-dimensional surface brightness profile analysis is performed for all bandpasses, we adopt the best-fitting morphological parameters as the fiducial model for characterizing each lensing galaxy. Cross examinations of the best-fitting morphological parameters in different bandpasses show that the best-fitting model based on the F814W image is consistent with those obtained in other bandpasses for all three fields, except for the F555W image of the HE 1104−1805 lens. The discrepancy is understood as due to a lack of young stars contributing to the rest-frame near-ultraviolet light that is recorded in the observed F555W frame. We present the best-fitting morphological parameters from the F814W images in columns (3)–(6) of Table 3.
Summary of galaxy structural and photometric properties.
| re | PAa | MB | SFR(UV)b | ||||||
|---|---|---|---|---|---|---|---|---|---|
| Galaxy | n | (kpc) | b/a | (°) | (mag) | (g − r)rest | |$\rm {log} \,M_{\ast }/\mathrm{M}_{\odot }$| | LB/L* | (M⊙ yr−1) |
| HE 0047 Glens | 3.87 ± 0.55 | 2.6 ± 0.6 | 0.78 ± 0.02 | 114 ± 3 | −20.7 | 0.77 | 10.9 | 0.9 | – |
| HE 0435 Glens | 3.51 ± 0.04 | 4.4 ± 0.1 | 0.82 ± 0.01 | 176 ± 1 | −21.4 | 0.74 | 11.1 | 1.7 | <0.01 |
| HE 1104 Glens | 4.36 ± 0.17 | 8.2 ± 0.2 | 0.77 ± 0.01 | 56 ± 2 | −22.4 | 0.71 | 11.4 | 3.5 | <0.1 |
aPosition angle of the major axis of the lens galaxy is measured north through east.
bUnobscured SFR based on the observed F275W flux limits and the SFR calibrator from Kennicutt & Evans (2012).
The total flux of each galaxy in each filter is determined by integrating the best-fitting Sérsic profile within the half-light radius re and multiplying the result by a factor of 2 (yielding the total flux, by definition of the Sérsic profile).1 Error in the total flux is estimated by adding in quadrature the systematic error in the best-fitting Sérsic profile due to uncertainties in the best-fitting model parameters and statistical errors due to photon counting. Next, the rest-frame absolute magnitudes and rest-frame g − r colours, and total stellar mass M* of each galaxy are calculated using the IDL K-correct library version 4.2 (Blanton & Roweis 2007), which performs k-correction using a library of templates generated using Bruzual & Charlot (2003) stellar population synthesis code together with emission line models from Kewley et al. (2001). For the lensing galaxies in the HE 0435−1223 and HE 1104−1805 fields, constraints on the unobscured star formation rate (SFR) are also derived using the observed flux limit in the F275W bandpass and the SFR calibrator from Kennicutt & Evans (2012). At the redshifts of the lensing galaxies, the F275W bandpass corresponds to roughly rest-frame 1500–1800 Å. The results are also summarized in Table 3.
The available optical spectra of two of the lensing galaxies described in Section 2.2 (Fig. 2) exhibit prominent absorption features such as Ca ii H&K doublet, G-band, and Mg b, and a strong 4000-Å spectral discontinuity that are characteristic of a quiescent galaxy with no ongoing star formation. We measure the D4000 index, which is defined as the continuum flux ratio between two spectral regions, 4000–4100 Å and 3850–3950 Å, bracketing the 4000-Å discontinuity, D4000 ≡ f4000–4100/f3850–3950, as well as the Hδ absorption and [O ii] emission equivalent width following the spectral index definitions of Balogh et al. (1999). The results are summarized in Table 4. Based on the observed equivalent width upper limits for [O ii] emission, we apply the SFR conversion of Kewley et al. (2004) and place a 2σ upper limit for the unobscured SFR at ≈0.07 M⊙ yr−1. In addition, the relatively large D4000 indices indicates that the two lensing galaxies have a minimum stellar age of ≳ 1 Gyr (e.g. Kauffmann et al. 2003). We note that the presence of residual QSO flux bluewards of the 4000-Å spectral discontinuity would result in underestimated D4000 indices, implying an even older stellar population for these galaxies.
Summary of galaxy spectroscopic properties.
| EW(Hδ)a | EW([O ii])b | |${\rm SFR}{\rm [O\,\small {II}]}^{c}$| | |||
|---|---|---|---|---|---|
| Galaxy | z | D4000 | (Å) | (Å) | (M⊙ yr−1) |
| HE 0047 Glens | 0.408 | 1.4 ± 0.4 | 2.8 ± 0.8 | <1.9 | <0.07 |
| HE 0435 Glens | 0.454 | 1.4 ± 0.2 | 1.7 ± 0.2 | <0.4 | <0.06 |
| HE 1104 Glens | 0.729d | – | – | – | – |
3.2 Absorbing gas properties
The echelle spectroscopy described in Section 2.3 produces high-resolution absorption spectra of gas along multiple sightlines around three lensing galaxies. These spectra enable a detailed study of how halo gas properties around massive quiescent galaxies vary with different physical locations. At the redshifts of the three lensing galaxies, the echelle spectra provide a wavelength coverage for observing prominent absorption transitions Fe ii λ 2600, Mg ii λλ 2796, 2803, Mg i λ 2852, and Ca ii λλ 3934.
To characterize halo gas around the lensing galaxies, we perform two sets of measurements following what is described in Chen et al. (2014). First, we measure the total, integrated absorption equivalent widths along individual sightlines. Measurements of total integrated absorption equivalent widths along individual sightlines offer a baseline comparison between absorbers residing in massive galaxy haloes and the general absorber population from random sightline surveys (e.g. Rao et al. 2006; Seyffert et al. 2013; Zhu & Ménard 2013). Next, we perform a Voigt profile analysis on a component-by-component basis to constrain the gas column densities and Doppler parameters of individual components. Measurements of individual absorption components allow us to examine detailed kinematic structures and investigate possible variations in relative ionic abundances both along and across individual sightlines.
To carry out the Voigt profile analysis, we developed a custom software to analyse both heavily binned MIKE spectra and unbinned UVES and HIRES data. For each observed absorption line system, we first generate a theoretical absorption line profile based on the minimum number of discrete components, nc, that is needed to explain the observed Mg ii absorption kinematics. We focus on the Mg ii absorption doublet for setting the number of necessary components, because among all observable features (Fe ii, Mg ii, Mg i, and Ca ii absorption) the lines of the doublet are expected to be the strongest features in diffuse gas. For each absorbing component, the Voigt profile is uniquely defined by three free parameters: the velocity offset of the line centre relative to the systemic redshift of the lensing galaxy (vc), the absorption column density of ion X (log Nc[X]), and the Doppler parameter (bc). Next, the theoretical absorption profile is convolved with a Gaussian line spread function with the FWHM set by the appropriate instrumental resolution, which is FWHM ≈ 12 km s−1 for MIKE and FWHM ≈ 6.7 km s−1 for UVES and HIRES. Following this step, the convolved model Voigt profile is binned according to the adopted spectral binning of the data. Finally, the resulting binned model spectrum is compared with the observed absorption spectrum, and the best-fitting parameters are determined based on a χ2 analysis. We perform the Voigt profile fitting procedure to all available transitions of a given absorption system. The velocity offsets of individual components are fixed across all transitions, whereas log Nc and bc are allowed to vary freely for different transitions. The results of the Voigt profile analysis also allow us to determine the total velocity widths that enclose 90 per cent of total optical depth, which enable a direct comparison of the mean velocity field across different sightlines. Finally, we note that because both HIRES and UVES spectra are available for HE 1104−1805, the best-fitting model parameters were found by a simultaneous χ2 fit to the HIRES and UVES spectra. The two spectra were combined for display purposes only (Fig. 8).
A summary of the integrated absorption properties along individual sightlines is presented in Table 5. For each lensed QSO sightline, we present its angular separation θ and the corresponding projected distance d to the lensing galaxies, the relative azimuthal angle ϕ of the lensed QSO image from the major axis of the lens, the rest-frame absorption equivalent width (Wr), and velocity width enclosing 90 per cent of the total optical depth (δ v90) of each absorption transition. Uncertainties in δ v90 are of order the size of the spectral pixel, which is 10 km s−1 for HE 0047−1756 and HE 0435−1223, and 2.6 km s−1 for HE 1104−1805.
Integrated absorption properties along multiple sightlines near the three lensing galaxies.a
| Fe ii λ 2600 | Mg ii λ 2796 | Mg i λ 2852 | Ca ii λ 3934 | |||||||
|---|---|---|---|---|---|---|---|---|---|---|
| θb | dc | Wr | δ v90 | Wr | δ v90 | Wr | δ v90 | Wr | δ v90 | |
| (arcsec) | (kpc/re) | (Å) | (km s−1) | (Å) | (km s−1) | (Å) | (km s−1) | (Å) | (km s−1) | |
| HE 0047−1756 lens at z = 0.408 | ||||||||||
| A | 0.85 | 4.6/1.8 | 2.29 ± 0.04 | 590 | 4.46 ± 0.02 | 609 | 0.80 ± 0.02 | 603 | 0.32 ± 0.02 | 584 |
| B | 0.61 | 3.3/1.3 | 2.03 ± 0.10 | 462 | 3.69 ± 0.04 | 482 | 0.72 ± 0.04 | 473 | 0.12 ± 0.02 | 74 |
| HE 0435−1223 lens at z = 0.454 | ||||||||||
| A | 1.30 | 7.5/1.7 | <0.04 | – | <0.03 | – | <0.01 | – | <0.03 | – |
| B | 1.17 | 6.7/1.5 | <0.04 | – | <0.03 | – | <0.01 | – | <0.04 | – |
| C | 1.30 | 7.5/1.7 | <0.03 | – | <0.03 | – | <0.01 | – | <0.03 | – |
| D | 1.07 | 6.2/1.4 | <0.06 | – | <0.04 | – | <0.02 | – | <0.03 | – |
| HE 1104−1805 lens at z = 0.729 | ||||||||||
| A | 1.11 | 8.1/1.0 | 0.34 ± 0.01 | 332 | 0.64 ± 0.01 | 331 | 0.09 ± 0.01 | 333 | 0.06 ± 0.01 | 334 |
| B | 2.08 | 15.1/1.8 | <0.01 | – | <0.01 | – | <0.01 | – | <0.04 | – |
aFor non-detections, we present a 2σ upper limit to the absorption equivalent width. For HE 1104−1805B, the limits are estimated over the same velocity interval as in HE 1104−1805A. For HE 0435−1223 A,B,C,D, the limits are estimated over twice the resolution element (10 km s−1).
bθ: angular separation between the lens and lensed QSO image.
cd: Projected distance in units of kpc or half-light radius re.
The results of the Voigt profile analysis for individual fields are summarized in Tables 6–8, and the best-fitting model absorption profiles are presented in Figs 4, 6, and 8 below for comparison with observations. Uncertainties listed in the tables represent only formal errors from the χ2 analysis, not including systematic uncertainties due to continuum fitting errors. For non-detected Fe ii, Mg i, and Ca ii absorbing components, we first measure the 2σ equivalent width limits of the strongest transitions using the error spectrum over a spectral window that is twice the FWHM of the corresponding Mg ii component. When Mg ii absorption features are absent (namely for HE 0435−1223 and for HE 1104−1805B), the upper limits are evaluated over a spectral window that is twice the spectral resolution element. Then we calculate the corresponding 2σ upper limits to the component column densities, assuming that the gas is optically thin.
Absorption properties around the HE 0047−1756 lens.
| vc | Fe ii | Mg ii | Mg i | Ca ii | |||||||
|---|---|---|---|---|---|---|---|---|---|---|---|
| Sightline | nc | component | (km s−1) | log Nc | bc (km s−1) | log Nc | bc (km s−1) | log Nc | bc (km s−1) | log Nc | bc (km s−1) |
| A | 15 | 1 | −428.4 | 14.23 ± 0.03 | 19.1 ± 0.7 | 14.34 ± 0.16 | 19.2 ± 1.4 | 12.63 ± 0.02 | 17.1 ± 0.8 | 12.23 ± 0.03 | 14.3 ± 1.4 |
| 2 | −367.9 | 13.32 ± 0.08 | 5.5 ± 1.1 | 13.12 ± 0.03 | 11.0 ± 0.9 | 11.68 ± 0.21 | 11.7 ± 0.2 | <11.0 | – | ||
| 3 | −315.2 | 13.21 ± 0.05 | 11.0 ± 1.6 | 13.04 ± 0.03 | 10.8 ± 0.8 | 11.35 ± 0.12 | 4.4 ± 5.4 | <11.1 | – | ||
| 4 | −241.9 | 13.45 ± 0.04 | 12.8 ± 1.3 | 13.31 ± 0.03 | 14.5 ± 1.3 | 11.69 ± 0.08 | 10.4 ± 3.4 | 11.57 ± 0.12 | 12.3 ± 5.5 | ||
| 5 | −196.6 | 13.75 ± 0.03 | 15.5 ± 1.2 | 13.70 ± 0.06 | 15.5 ± 1.7 | 12.11 ± 0.04 | 14.7 ± 1.8 | 11.86 ± 0.08 | 18.9 ± 4.8 | ||
| 6 | −155.9 | 12.70 ± 0.13 | 10.7 ± 5.0 | 12.71 ± 0.08 | 13.9 ± 3.4 | <10.9 | – | <11.0 | – | ||
| 7 | −98.6 | 13.39 ± 0.04 | 16.7 ± 2.0 | 13.37 ± 0.03 | 15.2 ± 1.3 | <10.9 | – | <11.1 | – | ||
| 8 | −59.3 | 13.22 ± 0.06 | 12.9 ± 2.7 | 13.39 ± 0.03 | 14.1 ± 1.3 | <10.9 | – | <11.1 | – | ||
| 9 | −24.7 | 12.75 ± 0.16 | 13.2 ± 7.2 | 12.78 ± 0.27 | 3.2 ± 1.4 | <10.7 | – | <10.8 | – | ||
| 10 | +11.4 | 12.64 ± 0.15 | 12.0 ± 6.8 | 13.22 ± 0.03 | 25.7 ± 2.0 | <11.0 | – | <11.2 | – | ||
| 11 | +91.5 | 13.42 ± 0.04 | 18.4 ± 2.3 | 13.47 ± 0.09 | 19.0 ± 2.8 | 11.77 ± 0.10 | 16.4 ± 4.9 | 11.55 ± 0.12 | 10.6 ± 4.9 | ||
| 12 | +122.6 | 13.31 ± 0.06 | 8.2 ± 1.6 | 13.46 ± 0.09 | 13.6 ± 2.3 | 11.85 ± 0.07 | 13.7 ± 2.8 | 11.45 ± 0.12 | 4.8 ± 6.7 | ||
| 13 | +169.4 | 13.04 ± 0.06 | 8.3 ± 2.0 | 13.13 ± 0.03 | 15.4 ± 1.3 | 11.42 ± 0.16 | 9.0 ± 7.0 | <11.1 | – | ||
| 14 | +216.9 | 12.62 ± 0.10 | 5.3 ± 2.2 | 12.64 ± 0.05 | 10.2 ± 2.1 | <10.8 | – | <11.1 | – | ||
| 15 | +258.8 | <12.2 | – | 12.46 ± 0.09 | 19.5 ± 5.1 | <10.9 | – | <11.1 | – | ||
| B | 11 | 1 | −115.3 | 13.60 ± 0.16 | 10.9 ± 3.5 | |$13.74^{+0.10}_{-0.08}$| | 18.0 ± 1.6 | 11.92 ± 0.11 | 6.3 ± 3.2 | <11.5 | – |
| 2 | −75.6 | 14.49 ± 0.12 | 24.5 ± 2.6 | |$14.88^{+0.29}_{-0.23}$| | 23.2 ± 2.0 | 12.51 ± 0.06 | 13.1 ± 1.6 | 12.21 ± 0.05 | 12.6 ± 2.4 | ||
| 3 | +34.7 | 13.24 ± 0.16 | 20.1 ± 6.2 | 13.11 ± 0.04 | 19.0 ± 2.2 | 11.52 ± 0.27 | 19.7 ± 8.9 | <11.5 | – | ||
| 4 | +97.7 | 12.82 ± 0.20 | 20.0 ± 4.5 | 12.72 ± 0.09 | 18.4 ± 5.6 | <11.3 | – | <11.5 | – | ||
| 5 | +139.1 | 13.59 ± 0.14 | 8.1 ± 4.2 | 13.55 ± 0.10 | 12.0 ± 1.5 | 11.68 ± 0.20 | 11.9 ± 4.6 | <11.4 | – | ||
| 6 | +197.6 | 13.62 ± 0.07 | 23.0 ± 4.2 | 13.57 ± 0.04 | 24.8 ± 2.7 | 12.12 ± 0.12 | 34.3 ± 6.8 | <11.6 | – | ||
| 7 | +246.1 | 13.25 ± 0.17 | 7.3 ± 3.8 | 13.12 ± 0.07 | 10.2 ± 1.8 | 11.59 ± 0.21 | 6.4 ± 7.6 | <11.4 | – | ||
| 8 | +310.2 | 12.80 ± 0.18 | 8.4 ± 6.2 | 12.82 ± 0.06 | 12.1 ± 2.6 | <11.2 | – | <11.5 | – | ||
| 9 | +340.9 | <12.6 | – | 12.22 ± 0.20 | 10.0 ± 6.0 | <11.1 | – | <11.4 | – | ||
| 10 | +396.8 | 13.24 ± 0.12 | 40.0 ± 6.8 | 13.30 ± 0.03 | 36.4 ± 3.7 | 11.83 ± 0.15 | 27.4 ± 6.4 | <11.7 | – | ||
| 11 | +480.7 | 12.83 ± 0.18 | 9.5 ± 7.5 | 12.85 ± 0.05 | 13.9 ± 2.4 | <11.2 | – | <11.5 | – | ||
Constraints on the absorption properties around the HE 0435−1223 lens.
| |$\log \,N({\rm Fe\,\small {II}})$| | |$\log \,N({\rm Mg\,\small {II}})$| | |$\log \,N({\rm Mg\,\small {I}})$| | |$\log \,N({\rm Ca\,\small {II}})$| | |
|---|---|---|---|---|
| A | <12.5 | <11.8 | <11.0 | <11.5 |
| B | <12.5 | <11.9 | <11.0 | <11.6 |
| C | <12.4 | <11.8 | <10.9 | <11.5 |
| D | <12.6 | <12.0 | <11.1 | <11.5 |
Absorption properties around the HE 1104−1805 lens.
| vc | Fe ii | Mg ii | Mg i | Ca ii | |||||||
|---|---|---|---|---|---|---|---|---|---|---|---|
| Sightline | nc | Component | (km s−1) | log Nc | bc (km s−1) | log Nc | bc (km s−1) | log Nc | bc (km s−1) | log Nc | bc (km s−1) |
| A | 8 | 1 | − 277.7 | 11.78 ± 0.06 | 8.9 ± 1.8 | 11.69 ± 0.03 | 8.9 ± 0.9 | <10.2 | – | <10.8 | – |
| 2 | − 215.7 | 12.34 ± 0.02 | 6.4 ± 0.4 | 12.27 ± 0.01 | 6.2 ± 0.3 | 10.41 ± 0.12 | 5.8 ± 2.9 | <10.7 | – | ||
| 3 | − 197.3 | 12.87 ± 0.01 | 6.7 ± 0.2 | 12.82 ± 0.01 | 6.3 ± 0.1 | 11.08 ± 0.03 | 6.2 ± 0.7 | 10.96 ± 0.27 | 1.0 ± 5.6 | ||
| 4 | − 169.8 | 12.33 ± 0.02 | 8.9 ± 0.6 | 12.25 ± 0.01 | 6.7 ± 0.2 | <10.1 | – | <10.7 | – | ||
| 5 | − 134.9 | 12.92 ± 0.01 | 8.6 ± 0.2 | 12.80 ± 0.01 | 8.1 ± 0.1 | 11.08 ± 0.03 | 7.0 ± 0.7 | 11.16 ± 0.09 | 7.8 ± 2.4 | ||
| 6 | − 91.5 | 12.66 ± 0.01 | 4.3 ± 0.2 | 12.61 ± 0.01 | 4.4 ± 0.1 | 11.00 ± 0.02 | 3.5 ± 0.6 | <10.7 | – | ||
| 7 | +32.1 | 12.75 ± 0.02 | 3.4 ± 0.3 | 12.74 ± 0.01 | 3.5 ± 0.1 | 11.28 ± 0.01 | 2.7 ± 0.4 | 11.39 ± 0.04 | 2.4 ± 1.2 | ||
| 8 | +101.3 | 11.80 ± 0.10 | 4.7 ± 2.2 | 11.75 ± 0.02 | 5.1 ± 0.5 | <10.1 | – | <10.7 | – | ||
| B | – | – | 0.0 | <11.0 | – | <10.8 | – | <10.3 | – | <11.0 | – |
Because our MIKE spectra have a pixel resolution comparable to the instrument spectral resolution, it is important to understand and quantify possible systematic uncertainties in the Voigt profile analysis that may result from an undersampled line spread function. For this reason, we perform a series of Monte Carlo simulations to assess the accuracy of the best-fitting Voigt profile parameters. Specifically, we first generate a set of synthetic Mg ii and Fe ii absorption lines with varying column densities and Doppler parameters, convolve the synthetic absorbers with the instrumental line spread function, apply a pixel binning of 10 km s−1, and add noise to the synthetic spectra based on the 1σ error spectrum associated with each lensed QSO spectrum. Next, we perform the Voigt profile analysis using the resulting synthetic spectrum to determine the best-fitting column density and Doppler parameter of each component. Finally, we repeat the process 1000 times to record the distribution of best-fitting model parameters relative to the input values.
The Monte Carlo simulations demonstrate that despite an undersampled line spread function, the input column density and Doppler parameter are well-recovered for relatively broad components (≳ 7 km s−1). For these broad components, the 95 per cent confidence interval is less than 5 per cent of the best-fitting column density and b values. For narrower components (b < 7 km s−1), we found that while the input values are well-recovered for weak transitions (log N ≲ 13.0), the intrinsic line profiles begin to saturate when the column density exceeds log N ≈ 13.0. The simulations show that for these narrow and saturated components the best-fitting column density and b value become degenerate and the uncertainties in column density can be as high as 0.1 dex for absorbers of log N ≲ 13.5 and up to 0.3 dex for strong absorbers of log N > 14. For Mg ii components, we note that all narrow component are weak and saturation is therefore not a significant issue. For Fe ii components, including weaker transitions, such as Fe ii λ 2586, allows us to recover the underlying |$N({\rm Fe\,\small {II}})$| to better than 0.1 dex accuracy for components as strong as |$\log \,N({\rm Fe\,\small {II}})\approx 14$|. Based on the results of the simulations, we conclude that the column density measurements are robust for relatively isolated components.
Complications arise when two saturated components are blended together. This is the case for components 1 and 2 in sightline B of HE 0047−1756 (see Fig. 4 below). A simultaneous Voigt profile analysis of the two components yields two local χ2 minima at (log Nc, bc) = (16.5, 6.9) and (13.7, 18.0) for component 1, and (log Nc, bc) = (16.8, 14.9) and (14.9, 23.2), for component 2. For these two components, we apply a prior based on the known |$N({\rm Mg\,\small {I}})$| and the cloudy photoionization calculation (see Section 5.1, and adopt the second local minimum as the best-fitting values. This is justified by the implied |$N({\rm Mg\,\small {I}})/N({\rm Mg\,\small {II}})$| ratio which, at the first local minimum, would place the component in an unrealistically low gas density regime, nH < 10−4 cm−3 (see Fig. 9 below), leading to an unphysically large cloud size that exceeds 300 kpc for optically thin gas with solar metallicity.
4 DESCRIPTION OF INDIVIDUAL LENSING GALAXIES
With the separate measurements of galaxy and absorption-line properties presented in Section 3, here we proceed with a joint analysis of the stellar population and halo gas properties of each lensing galaxy.
4.1 The HE 0047−1756 Lens at z = 0.408
The lensing galaxy of HE 0047−1756 at z = 0.408 was spectroscopically identified by Ofek et al. (2006) and confirmed by Eigenbrod et al. (2006). Our two-dimensional surface brightness profile analysis has yielded a best-fitting Sérsic index of n = 3.9 ± 0.6, a half-light radius of re = 2.6 kpc, and an axis ratio of b/a = 0.78 ± 0.02 (Fig. 3). The best-fitting morphological parameters characterize the lens as an elliptical galaxy, which is consistent with the relatively old age (>1 Gyr) and a lack of ongoing star formation (SFR < 0.07 M⊙ yr−1) inferred from the spectral indices presented in Table 4. Integrating the best-fitting Sérsic profile, we estimate the total apparent magnitudes in the F555W, F814W, and F160W bandpasses, and find AB(F555W) = 21.64 ± 0.07, AB(F814W) = 19.71 ± 0.05, and AB(F160W) = 18.64 ± 0.06. Following the procedures described in Section 3.1, the observed apparent magnitudes translate to a rest-frame B-band absolute magnitude of MB = −20.7, which is roughly 0.9 L* at z = 0.4 according to Faber et al. (2007). In addition, we find a rest-frame optical colour of g − r = 0.77 and a total stellar mass of log M*/M⊙ = 10.9 for the lensing galaxy. Adopting the stellar-to-halo-mass relations of Behroozi, Wechsler & Conroy (2013) and Kravtsov, Vikhlinin & Meshscheryakov (2014), we further infer a total dark matter halo mass of log Mh/M⊙ = 12.4–12.7. In summary, we find that the lensing galaxy of HE 0047−1756 is a quiescent L* galaxy with structural and photometric properties typical of intermediate-redshift early-type galaxies (e.g. Rutkowski et al. 2012).
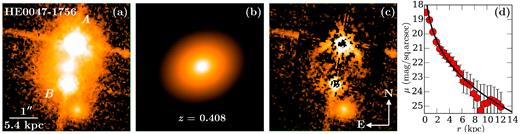
(a) HST/ACS F814W image of the field around HE 0047−1756. The lensing galaxy at z = 0.408 is at the centre of the panel surrounded by the doubly lensed QSO at zQSO = 1.67 (Wisotzki et al. 2004). We note that the redshift of the fainter source at 1.5 arcsec south of the lens is not known. Panel (b) displays the best-fitting Sérsic model surface brightness profile, which is characterized by a Sérsic index of n = 3.9 ± 0.6, half-light radius re = 2.6 ± 0.6 kpc, and an axis ratio of b/a = 0.78 ± 0.02. The best-fitting morphological properties are consistent with those expected from an elliptical galaxy. Panel (c) displays the residual image after subtracting the QSO PSFs and the best-fitting Sérsic model. Panel (d) displays an azimuthally averaged surface brightness profile of the lensing galaxy in the F814W bandpass. Each data point is calculated from an elliptical annulus of 0.1 arcsec (2 pixels) in width, and the associated error bar represents photon counting noise, which is driven primarily by the contaminating QSO light at large radii. The best-fitting Sérsic from the 2D analysis is shown as a black line. We note that the deviant points at 8–10 kpc are due to large residuals from subtracting the QSO light.
We note the presence of an extended source at ≈1.6 arcsec southwest of the lensing galaxy. This object appears to be bluer than the lensing galaxy (see left-hand panel of Fig. 1). We have also performed a two-dimensional surface brightness profile analysis for this object and found a best-fitting Sérsic index of n = 2.05 ± 0.08, consistent with the more extended morphology displayed in the HST images. No redshift measurement is available for this object. However, Chantry, Sluse & Magain (2010) noted that this galaxy is likely a major contributor to the shear term in the lens model that is needed to reproduce the image configuration of the lensed QSOs. Assuming this object is at the same redshift as the lensing galaxy, Chantry et al. (2010) calculated a velocity dispersion of σ = 88 km s−1 for this galaxy, which is comparable to the characteristic velocities of large satellite galaxies like the Large Magellanic Cloud (e.g. Alves & Nelson 2000).
At z = 0.408, the projected distance between the lens and QSO image A is dA = 4.6 kpc or 1.8 re, and the projected distance between the lens and QSO image B is dB = 3.3 kpc or 1.3 re. The two sightlines probe both the gaseous halo at small projected distances and the ISM of an elliptical galaxy where the gas is expected to be hot. Adopting the correlation between X-ray luminosity and B-band luminosity LB of local elliptical galaxies from O'Sullivan et al. (2001), we infer an X-ray luminosity of LX ≈ 1041 erg s−1 for the lens of HE 0047−1756. The expected luminous X-ray flux indicates that, similar to nearby elliptical galaxies, the lensing galaxy is likely surrounded by a hot halo.
At the same time, the absorption spectra show that not only abundant cool gas is present along both A and B sightlines in the inner halo of the galaxy, but the velocity spread is also very large. The total rest-frame equivalent width is found to be Wr(2796) = 4.46 ± 0.02 Å along sightline A at d = 4.6 kpc (1.8 re) north of the lens and Wr(2796) = 3.69 ± 0.04 Å along sightline B at d = 3.3 (1.3 re) kpc south of the lens. These ultrastrong absorbers are often attributed to starburst-driven outflows (e.g. Nestor et al. 2011). In the case of the lensing galaxy, however, the lack of ongoing star formation together with a dominant old stellar population makes a starburst-driven outflow origin an unlikely scenario. On the other hand, Rao et al. (2006) showed that strong Mg ii absorbers of Wr(2796) > 0.6 Å at z < 1.65 have a mean H i column density of |$\langle N({\rm H\,\small {I}})\rangle =(3.5\pm 0.7) \times 10^{20}\,{{\rm cm^{-2}}}$| which, together with the relative line ratios between Mg ii, Fe ii, and Mg i, indicate a high probability (>40 per cent) that the strong Mg ii absorbers found in the inner regions of the lensing galaxy are damped Ly α absorbers (DLAs), in which the gas is expected to be mostly neutral (e.g. Wolfe, Gawiser & Prochaska 2005).
It is clear from the echelle absorption spectra that the large equivalent widths are driven by complex multicomponent structures that span ≈500–600 km s−1 in line-of-sight velocity (Table 5 and Fig. 4). The observed velocity spread along an individual sightline exceeds the maximum circular velocity, vmax ≈ 240 km s−1, expected for haloes of ∼ 2.5 × 10¹² M⊙. In addition, the absorption profiles exhibit an edge-leading signature commonly seen in rotating discs with the highest column density gas moving (blueshifted) at the highest velocity towards the observer. Based on a grid of photoionization models discussed in Section 5.1 below, we find that component 1 along sightline A and component 2 along sightline B are indeed likely strong Lyman limit absorbers (or possibly DLAs) of |$\log \,N({\rm H\,\small {I}})>19$| which have a significant neutral fraction. Other weaker components remain in the optically thin regime with |$\log \,N({\rm H\,\small {I}})\lesssim 17$|. The lower |$N({\rm H\,\small {I}})$| is also reflected in the observed declining |$N({\rm Mg\,\small {II}})$| (by nearly 2 dex) with increasing receding velocity along the line of sight. Such edge-leading kinematic signatures are present along both sightlines.
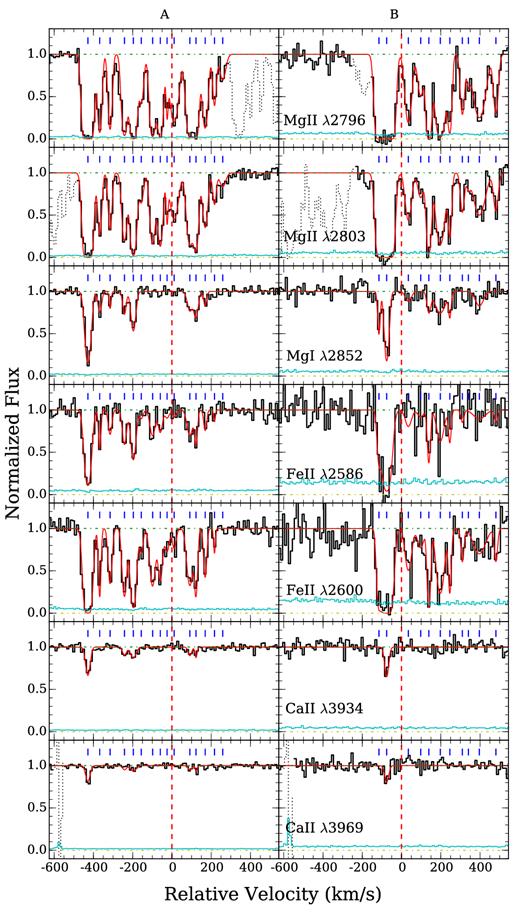
Continuum normalized absorption profiles of different transitions along the lensed QSO sightlines HE 0047−1756 A (left) at d = 4.6 kpc (or 1.8 re) and B (right) at d = 3.3 kpc (or 1.3 re) from the HE 0047−1756 lens. Zero velocity corresponds to the systemic redshift of the lensing galaxy at z = 0.408. The 1σ error spectrum is included in thin, cyan curve above the zero flux level. The blue tickmarks at the top of each panel indicate the location of individual components included in the Voigt profile analysis (see Section 3.2), and the best-fitting Voigt profile models are included in red. Contaminating features have been dotted out for clarity. Despite showing no sign of recent star formation, the inner halo of the lensing galaxy harbours a significant amount of cool gas with complex kinematic profiles that span ≈500–600 km s−1 in line-of-sight velocity and exhibit a large velocity shear of Δ v ≈ 350 km s−1 across the two sightlines separated by merely ≈8 kpc.
At d = 3–5 kpc, the QSO sightlines probe both halo gas at r ∼ 100 kpc (in front of and behind the lens) and the ISM at r ∼ 5–10 kpc. It is possible that a coherent structure in the ISM contributes predominantly to the absorption profiles, which drives the strong resemblance in the edge-leading signature, and that independent gas clumps in the halo contribute to the absorption separately along different sightlines, which adds noise to the profiles. To examine possible spatial coherence between the gas revealed along the two sightlines, we perform a cross-correlation analysis of the absorption profiles observed along A and B sightlines and found a clear maximum at velocity offset of Δ v ≈ 350 km s−1 between the two sightlines. Applying an velocity offset of Δ v = −350 km s−1, we find good match between components 1, 2, 5, 7, and 8 along sightline B and components 1, 5, 7, and 9 along sightline A, both in their relative absorption strengths and in velocity offsets. The observed kinematic profiles suggest strong coherence on scales of ∼8 kpc in the gas motion across the inner halo (a more complete discussion follows in Section 5.3). However, the matched components span a light-of-sight velocity range of ≈420 km s−1, still exceeding the maximum circular velocity, vmax ≈ 240 km s−1, expected for haloes of ∼ 2.5 × 10¹² M⊙.
4.2 HE 0435−1223 lens galaxy at z = 0.454
The lensing galaxy of HE 0435−1223 at z = 0.454 was spectroscopically identified by Morgan et al. (2005) and confirmed by Eigenbrod et al. (2006). This lens resides in a galaxy group with 12 spectroscopically confirmed members and a group velocity dispersion of |$\sigma _{\rm group}=520_{-80}^{+70}$| km s−1 (Wilson et al., in preparation). We note, however, that galaxy G22 in Morgan et al. (2005) at 4.4 arcsec from the lensing galaxy is spectroscopically identified at z = 0.7818 by Chen et al. (2014), and is therefore not part of the group. Our two-dimensional surface brightness profile analysis has yielded a best-fitting Sérsic index of n = 3.51 ± 0.04, a half-light radius of re = 4.4 kpc, and an axis ratio of b/a = 0.82 ± 0.01 (Fig. 5), consistent with measurements of Kochanek et al. (2006). The best-fitting morphological parameters characterize the lens as an early-type galaxy, consistent with the old stellar population (>1 Gyr) and a lack of ongoing star formation (SFR < 0.07 M⊙ yr−1) inferred from both the rest-frame UV continuum flux (Table 3) and the spectral indices presented in Table 4. Integrating the best-fitting Sérsic profile, we find the total apparent magnitudes in the F555W, F814W, and F160W bandpasses of AB(F555W) = 21.30 ± 0.04, AB(F814W) = 19.36 ± 0.03, and AB(F160W) = 18.34 ± 0.04. Our photometry for this lens galaxy is in general agreement with the magnitudes reported by Kochanek et al. (2006). The observed apparent magnitudes translate to a rest-frame B-band absolute magnitude of MB = −21.4 (corresponding to 1.7 L* at z = 0.45), a rest-frame optical colour of g − r = 0.74, and a total stellar mass of log M*/M⊙ = 11.1 for the lensing galaxy. The inferred dark matter halo mass is log Mh/M⊙ = 12.7–13.4, consistent with log Mh/M⊙ = 13.3 ± 0.4 from Kochanek et al. (2006) based on the lensing properties of this system. In summary, we find that the lensing galaxy of HE 0435−1223 is a quiescent super L* galaxy.
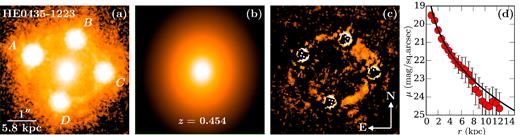
(a) HST/ACS F814W image of the field around HE 0435−1223. The lensing galaxy at z = 0.454 is at the centre of the panel surrounded by the quadruply lensed QSO at zQSO = 1.69 (Wisotzki et al. 2002). Panel (b) displays the best-fitting Sérsic model surface brightness profile, which is characterized by a Sérsic index of n = 3.51 ± 0.04, half-light radius re = 4.4 ± 0.1 kpc, and an axis ratio of b/a = 0.82 ± 0.01. The best-fitting morphological properties are consistent with those expected from an early-type galaxy. Panel (c) displays the residual image after subtracting the QSO PSFs and the best-fitting Sérsic model. Panel (d) displays an azimuthally averaged surface brightness profile of the lensing galaxy in the F814W bandpass. Each data point and the associated error are calculated from an elliptical annulus of 0.1 arcsec (2 pixels) in width. The best-fitting Sérsic from the 2D analysis is shown as a black line. We note that the deviant points at >8 kpc are due to large residuals from subtracting the QSO light.
At z = 0.454, the projected distances between the lensing galaxy and four lensed QSO images are d = 7.5, 6.7, 7.5, and 6.2 kpc or 1.7, 1.5, 1.7, 1.4 re for images A, B, C, and D, respectively. Similar to the doubly lensed QSO HE 0047−1756, the quadruply lensed QSO sightlines probe both the gaseous halo at small projected distances and the ISM of a massive, early-type galaxy. Adopting the same Lx–LB relation of O'Sullivan et al. (2001), we infer Lx ≈ (2–3.5) × 1041 erg s−1 for the lensing galaxy.
In contrast to the ultrastrong Mg ii absorbers found in the vicinities of the HE 0047−1756 lens, no trace of ionic absorption is detected near the HE 0435−1223 to sensitive limits. We measure 2σ upper limits of the underlying gas column densities for all observed transitions based on the absorption equivalent width limits presented in Table 5. The column density constraints are presented in Table 7. In Fig. 6, we present the continuum-normalized QSO spectra within ± 500 km s−1 of the systemic redshift of the lensing galaxy. The strong limits afforded by the MIKE spectra indicates a lack of cool gas in the inner halo of this massive, quiescent galaxy.
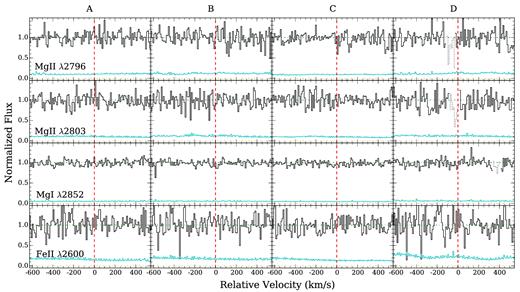
Continuum normalized spectra along the lensed QSO sightlines HE 0435−1223 A, B, C, D, at d = 7.5, 6.7, 7.5, and 6.2 kpc (or 1.7, 1.5, 1.7, 1.4 re), respectively. Zero velocity corresponds to the systemic redshift of the lensing galaxy at z = 0.454. The 1σ error spectrum is included in thin, cyan curve above the zero flux level. Contaminating features have been dotted out for clarity. In stark contrast to the ultrastrong Mg ii absorber detected along both sightlines of HE 0047−1756 (Fig. 5), none of the four sightlines near the HE 0435−1223 lens reveals any cool gas.
4.3 HE 1104−1805 lens galaxy at z = 0.729
The lensing galaxy of HE 1104−1805 at z = 0.729 was spectroscopically identified by Lidman et al. (2000). Our two-dimensional surface brightness profile analysis has yielded a best-fitting Sérsic index of n = 4.4 ± 0.2, a half-light radius of re = 8.2 kpc, and an axis ratio of b/a = 0.77 ± 0.01 (Fig. 7). The best-fitting morphological parameters indicate that the lens is also an elliptical galaxy, consistent with a lack of ongoing star formation (SFR < 0.1 M⊙ yr−1) inferred the rest-frame UV continuum flux (Table 3). Integrating the best-fitting Sérsic profile, we estimate the total apparent magnitudes in the F555W, F814W, and F160W bandpasses, and find AB(F555W) = 22.42 ± 0.06, AB(F814W) = 20.04 ± 0.04, and AB(F160W) = 18.77 ± 0.06. The observed apparent magnitudes translate to a rest-frame B-band absolute magnitude of MB = −22.4, corresponding to 3.5 L* at z = 0.7 according to Faber et al. (2007). In addition, we find a rest-frame optical colour of g − r = 0.71 and a total stellar mass of log M*/M⊙ = 11.4 for the lensing galaxy. The inferred dark matter halo mass is log Mh/M⊙ = 13.3–14.3. In summary, we find that the lensing galaxy of HE 1104−1805 is a massive, quiescent galaxy.
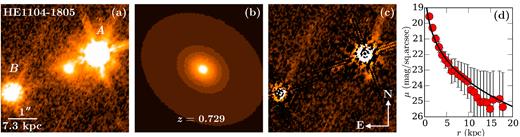
(a) HST/WFPC2-PC F814W image of the field around HE 1104−1805. The lensing galaxy at z = 0.729 is at the centre of the panel surrounded by the doubly lensed QSO at zQSO = 2.31 (Wisotzki et al. 2000). Panel (b) displays the best-fitting Sérsic model surface brightness profile, which is characterized by a Sérsic index of n = 4.4 ± 0.2, half-light radius re = 8.2 ± 0.2 kpc, and an axis ratio of b/a = 0.77 ± 0.01. The best-fitting morphological properties are consistent with those expected from an early-type galaxy. Panel (c) displays the residual image after subtracting the QSO PSFs and the best-fitting Sérsic model. Panel (d) displays an azimuthally averaged surface brightness profile of the lensing galaxy in the F814W bandpass. Each data point is calculated from an elliptical annulus Each data point and the associated error are calculated from an elliptical annulus of 0.1 arcsec (2.5 pixels) in width. The best-fitting Sérsic from the 2D analysis is shown as a black line. We note that the deviant points at >10 kpc are due to large residuals from subtracting the QSO light.
At z = 0.729, the projected distance between the lens and QSO image A is dA = 8.1 kpc or ≈re, and the projected distance between the lens and QSO image B is dB = 15.1 kpc or 1.8 re. Similar to the previous two lenses, the two sightlines probe both the gaseous halo at small projected distances and the ISM of an elliptical galaxy. Adopting the Lx–LB relation of O'Sullivan et al. (2001), we infer Lx ≈ 3 × 1042 erg s−1 for the lens of HE 1104−1805.
For the two lensed QSO sightlines, we have high S/N and high spectral resolution echelle spectra, and interestingly the inner halo of the HE 1104−1805 lens exhibits absorption properties that lie between the two previous cases. Only sightline A at d = 8.1 kpc (or ≈re) exhibits a modest amount of cool gas, as indicated by the presence of a moderately strong Mg ii absorber with Wr(2796) = 0.6 Å (Smette et al. 1995). Associated Fe ii, Mg i, and Ca ii absorption transitions are also detected at this location (Table 5). Sightline B at about twice the distance away, d = 15.1 kpc (or 1.8 re), does not show any trace of cool gas. We place a 2σ upper limit of Wr(2796) = 0.01 Å for possible underlying cool gas (Table 5).
Similar to the Mg ii absorbers found in the vicinities of the HE 0047−1756 lens, the strongest components (3 and 5) along HE 1104−1805 A may contain a non-negligible amount of H i with |$\log \,N({\rm H\,\small {I}})\gtrsim 17$| while the remaining weaker components are optically thin absorbers. Unlike the HE 0047−1756 lens, however, no edge-leading signature is found for the absorber near the HE 1104−1805 lens. The absorption kinematics in the vicinities of the HE 1104−1805 lens is shown in Fig. 8. The moderately strong Mg ii absorber at d = 8.1 kpc (or 1 re) is resolved into six dominant components of comparable strength, spanning ≈330 km s−1 in line-of-sight velocity. The observed velocity spread along sightline A is comparable to the maximum circular velocity, vmax ≈ 340 km s−1, expected for haloes of 5 × 10¹² M⊙. Results from our Voigt profile analysis are presented in Table 8.
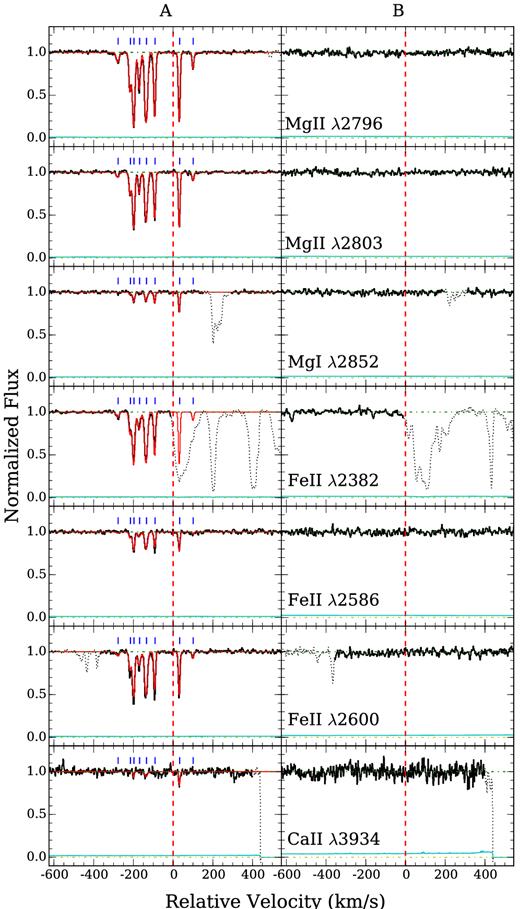
Continuum normalized absorption profiles of different transitions along the lensed QSO sightlines A (left) at d = 8.1 kpc (or ≈re) and B (right) at d = 15.1 kpc (or 1.8 re) from the HE 1104−1805 lens. Zero velocity corresponds to the systemic redshift of the lensing galaxy at z = 0.729. The 1σ error spectrum is included in thin, cyan curve above the zero flux level. The blue tickmarks at the top of each left-hand panel indicates the location of individual components included in the Voigt profile analysis (see Section 3.2), and the best-fitting Voigt profile models are included in red. The best-fitting model parameters were found by a simultaneous χ2 analysis to the HIRES and UVES spectra. The HIRES and UVES spectra were combined for display purposes only, as shown here. Contaminating features have been dotted out for clarity. Only sightline A exhibits chemically enriched cool gas characterized by six primary absorbing components that span ≈330 km s−1 in line-of-sight velocity, while sightline B exhibits no low-ionization transitions in the HIRES or UVES spectrum.
5 ANALYSIS AND RESULTS
Our multisightline absorption-line search has revealed a diverse range of halo gas properties at d = 1–2 re from three lensing galaxies at z = 0.4–0.7. While strong Mg ii, Fe ii, and Mg i absorption features are found at the redshift of the double lens for HE 0047−1756 in both sightlines, these absorption features are observed in only one of the two sightlines at the redshift the HE 1104−1805 lens and no absorbers are found in any of the four sightlines near the lens for HE 0435−1223. Incidentally, HE 0435−1223 is the only one of the three lenses in our study known to reside in a group environment (Wilson et al., in preparation). Here we examine the physical properties (such as temperature and ionization state), relative abundance pattern, and spatial coherence of gas kinematics in the vicinities of the two lensing galaxies in HE 0047−1756 and HE 1104−1805.
5.1 Photoionized cool gas associated with lensing galaxies
All Mg ii absorbers detected in our study have associated absorption transitions due to Fe ii λ 2600, Fe ii λ 2586, Mg i λ 2852, and Ca ii λ 3934. Comparisons of the relative line widths and absorption strengths between these transitions allow us to constrain both the temperature and ionization state of the gas. It is immediately clear from Tables 6 and 8 that for each component, different ionic transitions are found to share a consistent best-fitting Doppler parameter which is roughly 1–2 times the instrument resolution. Recall from Section 3.2 that our Voigt profile analysis was carried out with the velocity offsets of individual components fixed across all transitions, but letting log Nc and bc vary freely for different transitions. Fixing the bc value of each component for all transitions would lead to <0.1 dex differences in the best-fitting column density. The consistent best-fitting bc between Mg0 and Mg+ states lends strong support for the hypothesis that these different ions originate in the same gaseous clouds. In addition, the consistent bc between Fe+ and Mg+, which differ in mass by a factor of two, indicates that the line broadening is driven by non-thermal motions and confirms the expectation that Mg ii absorbing gas is typically cool with temperature T ≲ a few × 104 K (e.g. Bergeron & Stasińska 1986).
Given the relatively cool gas temperature, we consider the scenario in which the gas is being photoionized and determine the ionization state based on the observed relative abundances between Mg0 and Mg+ ions. Under the photoionization scenario, a key factor is the ionization parameter U, which is defined as the number of ionizing photons ϕ relative to the total hydrogen number density nH, U ≡ ϕ/c nH. For a fixed radiation field, lower gas densities lead to higher U parameters, and the gas is expected to be more highly ionized. Conversely, higher gas density lead to lower U parameters, and the gas is more neutral. We perform a series of photoionization calculations using the cloudy package (Ferland et al. 2013; v. 13.03) and construct a grid of models that span a range in U, from log U = −6 to log U = −1 and a range in gas metallicity, from 1/100 solar to solar. We consider both optically thin gas with |$\log \,N({\rm H\,\small {I}})=15$| and optically thick gas with |$\log \,N({\rm H\,\small {I}})=19$|, which are representative of the expected H i column density range for the absorbing clouds found near the lensing galaxies. For each photoionization model, we assume a plane-parallel geometry for the absorbing gas of T = 104 K, which is illuminated on both sides by an updated version of the Haardt & Madau (2001) ionizing radiation field (HM05 in cloudy) at z = 0.5. Then we compute the expected relative abundance ratios between Mg0, Mg+, and Fe+ for gas that follows a solar abundance pattern. While no empirical knowledge is available for the neutral hydrogen column density of the Mg ii absorbers found in the vicinities of the lensing galaxies, the photoionization models can be constrained based on the observed column density ratio between Mg0 and Mg+. Finally, we note that the cloudy models we constructed are dust-free, although we will discuss the effects of dust depletion in Section 5.2.
The top panel of Fig. 9 shows the expected |$N({\rm Mg\,\small {I}})/N({\rm Mg\,\small {II}})$| versus U for photoionized gas of 1/10 solar metallicity and different |$\log \,N({\rm H\,\small {I}})$| (solid and dotted curves), in comparison to observations from Tables 6 and 8 (blue lines and associated bands to indicate the 1σ uncertainties. The observed Mg i to Mg ii column density ratios constrain the ionization parameter in the range from log U ≈ −3.9 to log U ≈ −2 or gas density from nH ≲ 0.04 cm−3 to nH ≲ 4 × 10⁻⁴ cm−3. The results are insensitive to the adopted gas metallicity. The allowed U range is consistent with previous findings for weak Mg ii absorbers of Wr(2796) < 0.3 Å (e.g. Rigby, Charlton & Churchill 2002) or for Lyman limit systems at similar redshifts (e.g. Lehner et al. 2013).

Expectations from cloudy photoionization calculations (Ferland et al. 2013; v. 13.03). The top panel shows the expected |$N({\rm Mg\,\small {I}})/N({\rm Mg\,\small {II}})$| versus U for photoionized gas of T = 104 K, 0.1 solar metallicity, and two different |$N({\rm H\,\small {I}})$|. The observed Mg i to Mg ii column density ratios (Tables 6 and 8) are displayed in horizontal blue lines, with the band showing the 1σ measurement uncertainties. Comparisons between observations and model predictions for both optically thin (|$\log \,N({\rm H\,\small {I}})=15$|) and optically thick (|$\log \,N({\rm H\,\small {I}})=19$|) gas constrain U to be between log U ≈ −3.9 and log U ≈ −2 Experimenting with different gas metallicities (from 0.01 solar to solar) does not change the result. The bottom panel shows the ionization fraction of Fe+ relative to that of Mg+ as a function of U. The model predictions show that independent of gas metallicity the observed |$N({\rm Fe\,\small {II}})/N({\rm Mg\,\small {II}})$| ratio represents a conservative lower limit of the underlying (Fe/Mg) for optically thin gas (|$\log \,N({\rm H\,\small {I}})=15$|), while in the optically thick regime the observed relative ionic abundance roughly reflects the underlying total (Fe/Mg) ratio.
5.2 Uniform supersolar (Fe/Mg) across ≳ 400 km s−1 at d ≈ 1–2 re
The observed column density ratio between Fe+ and Mg+ ions allows us to estimate the underlying total elemental abundance ratio between iron and magnesium, (Fe/Mg), even though we cannot constrain the gas metallicity due to unknown |$N({\rm H\,\small {I}})$| for these absorbers. Constraining the relative abundance between iron and magnesium is particularly interesting, because both core collapse and Type Ia supernovae (SNe) contribute to the observed iron abundance (e.g. Tsujimoto et al. 1995) while magnesium is an α element generated primarily in massive stars and core-collapse SNe (e.g. Nomoto et al. 2006). Specifically, every Type Ia supernova is expected to release ∼0.7 M⊙ of iron, while at the same time producing ≲0.02 M⊙ of magnesium (e.g. Thielemann, Nomoto & Yokoi 1986; Iwamoto et al. 1999). The relative [Fe/Mg] ratio therefore provides a quantitative measure of the relative contribution of massive stars to the chemical enrichment in galaxies (e.g. Tsujimoto et al. 1995; Ferreras & Silk 2002; de Plaa et al. 2007).
We present the observed |$N({\rm Fe\,\small {II}})/N({\rm Mg\,\small {II}})$| versus velocity offset, Δ v, for individual components in Fig. 10. Observations for both sightlines A and B of HE 0047−1745 are presented in the top panel and observations for sightline A of HE 1104−1805 in the bottom panel. Error bars associated with individual data points represent the 1σ uncertainties, with upper limits indicating absence of Fe ii absorption.

The observed column density ratio of Fe+ to Mg+ versus velocity offset, Δ v, for individual components along both sightlines A and B of HE 0047−1745 in the top panel and along sightline A of HE 1104−1805 in the bottom panel. Error bars associated with individual data points represent the 1σ uncertainties, with upper limits indicating an absence of Fe ii absorption. The dotted line indicates the expected solar (Fe/Mg) ratio of log (Fe/Mg) = −0.08 (Asplund, Grevesse & Jacques Sauval 2006) for visual comparisons. The inset shows the geometric alignment between the lensing galaxy shown as the ellipse and the lensed QSO images. Both the axis ratio and position angle of the ellipse are representative of the observed morphological properties of the lens.
Fig. 10 displays two striking features. First, the observed |$N({\rm Fe\,\small {II}})/N({\rm Mg\,\small {II}})$| ratios are high, exceeding the typical solar abundance pattern. Secondly, the dispersion in the observed |$N({\rm Fe\,\small {II}})/N({\rm Mg\,\small {II}})$| ratio is small among different components across the full velocity range. The only exceptions are components 10 and 15 along HE 0047−1756 A and possibly component 2 along HE 0047−1756 B. Excluding these outliers, we find a median of |$\langle \,\log \,N({\rm Fe\,\small {II}})/N({\rm Mg\,\small {II}})\,\rangle \approx 0$| and dispersion of 0.11 and 0.09 dex, respectively, for sightlines A and B near HE 0047−1756. For HE 1104−1805 A, we find a median of |$\langle \,\log \,N({\rm Fe\,\small {II}})/N({\rm Mg\,\small {II}})\,\rangle = 0.06$| and dispersion of 0.03 dex.
Such homogeneity in abundance ratio across multiple components is not commonly seen in absorbers uncovered along random sightlines. For example, weak Mg ii absorbers often display a component-to-component |$N({\rm Fe\,\small {II}})/N({\rm Mg\,\small {II}})$| ratio that varies by ≈0.3 dex to more than 0.4 dex over Δ v ≈ 50 km s−1 (e.g. Narayanan et al. 2008) and high-redshift DLAs display up to 0.9 dex difference between components separated by Δ v ≲ 100 km s−1 (e.g. Fox, Richter & Fechner 2014). In contrast, the scatter of the observed |$N({\rm Fe\,\small {II}})/N({\rm Mg\,\small {II}})$| in the vicinities of the two massive lensing galaxies is <0.1 dex across Δ v > 400 km s−1.
For comparisons, we include in Fig. 11 the observed |$N({\rm Fe\,\small {II}})/N({\rm Mg\,\small {II}})$| versus |$N({\rm Fe\,\small {II}})$| for individual components found in weak Mg ii absorbers of Wr(2796) < 0.3 Å at z = 0.4–2.4 from Rigby et al. (2002) and Narayanan et al. (2008), and in DLAs or sub-DLAs at z = 1.8–2.4 from Dessauges-Zavadsky et al. (2004), Crighton et al. (2013), and Fox et al. (2014), together with the observations for individual components found near lensing galaxies. It is immediately clear that the relatively high |$N({\rm Fe\,\small {II}})/N({\rm Mg\,\small {II}})$| ratios are not common among QSO absorption-line systems found along random sightlines. While weak Mg ii absorbers have on average lower |$N({\rm Fe\,\small {II}})$| per component and exhibit a significant scatter in the observed |$N({\rm Fe\,\small {II}})/N({\rm Mg\,\small {II}})$| ratio, only a few components have been found to show enhancement in |$N({\rm Fe\,\small {II}})$| relative to |$N({\rm Mg\,\small {II}})$|. DLAs and sub-DLAs, which are thought to originate in young star-forming galaxies, have on average higher |$N({\rm Fe\,\small {II}})$| per component and exhibit a significant α-element enhancement abundance pattern. Neither one of these absorber populations occupies the same parameter space as the Fe-rich components found near the lensing galaxies. The observed discrepancy strongly suggests a different origin for the gas found along the sightlines near the two lensing galaxies.
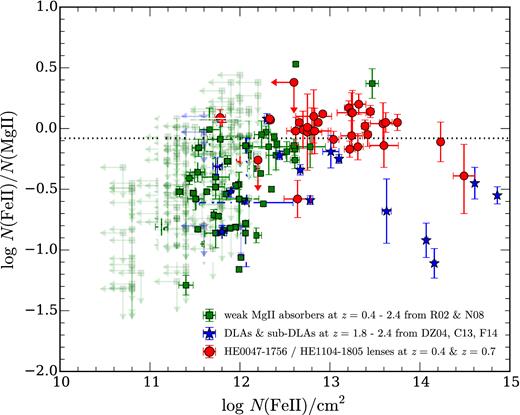
Observed Fe ii to Mg ii column density ratios versus |$N({\rm Fe\,\small {II}})$| both for absorbers selected from random sightlines and for halo gas around lensing galaxies from our study. Each data point represents a single absorbing component resolved in high-resolution QSO spectra. Our observations near lensing galaxies are presented in red, circles with error bars showing the corresponding measurement uncertainties. Measurements from high-redshift (z = 1.8–2.4) DLAs and sub-DLAs from Dessauges-Zavadsky et al. (2004), Crighton, Hennawi & Prochaska (2013), and Fox et al. (2014) are shown in blue star symbols. Measurements for weak Mg ii absorbers of Wr(2796) < 0.3 Å at 0.4 < z < 2.4 from Rigby et al. (2002) and Narayanan et al. (2008) are shown in green squares. Absorbing components with no associated Fe ii absorption transitions are shown as downward and left-pointing arrows with the data point indicating the 2-σ upper limit in |$N({\rm Fe\,\small {II}})$|. We have greyed out weak Mg ii data points without associated Fe ii detections for clarity. Like Fig. 10, the dotted line indicates the solar (Fe/Mg) abundance pattern for visual calibrations. With the exception of three outlying points, halo clouds around lensing galaxies occupy a unique |$\log \,N({\rm Fe\,\small {II}})/N({\rm Mg\,\small {II}})$|–|$\log \,N({\rm Fe\,\small {II}})$| space, separated from either the weak Mg ii absorber group or DLAs/sub-DLAs. The scatter in |$\log \,N({\rm Fe\,\small {II}})/N({\rm Mg\,\small {II}})$| is small, ∼0.1 dex, in the haloes around lensing galaxies. Including necessary ionization fraction corrections, our observations imply a supersolar Fe to Mg abundance pattern for the halo gas around these lensing galaxies.
We note that the presence of Ca ii absorption (Tables 6 and 8) also strongly implies the presence of dust (e.g. Savage & Sembach 1996; Wakker & Mathias 2000), which would further alter the observed elemental abundance pattern if not accounted for. Observations of local interstellar clouds have shown that Fe is more depleted in cool phase by as much as 0.5 dex relative to Mg (Lauroesch et al. 1996; Savage & Sembach 1996). If differential dust depletion is significant, then the inferred [Fe/Mg] will be even higher.
5.3 Probing spatial coherence of gas kinematics across d ≈ 8 kpc of the HE 0047−1756 lens
A primary goal of the multisightline study is to examine the spatial coherence of chemically enriched gas across the halo (e.g. Chen et al. 2014). In our current study, the doubly lensed HE 0047−1756 exhibits an ultrastrong Mg ii absorber along both lensed QSO sightlines separated by ≈8 kpc in projected distance, and offers a unique opportunity to examine possible correlation in the gas kinematics at d ≈ 1.5 re on the opposite sides of the lensing galaxy. We have noted two remarkable similarities in the absorption signatures between the two sightlines: (1) an edge-leading signature with the strongest absorption component moving at the highest blueshifted velocity and (2) strong correlation between a large number of components over a velocity range of ≈420 km s−1 along each sightline (see Section 4.1). These observed kinematic signatures suggest strong coherence on scales of 8 kpc in the gas motion across the inner halo of the HE 0047−1756 lens galaxy, similar to the strong coherence found on scales of 10 kpc at d ≈ 40–50 kpc from a blue, L* galaxy at z = 0.4188 by Chen et al. (2014). A natural explanation of the edge-leading signature is a rotating disc (e.g. Lanzetta & Bowen 1992). However, if the two sightlines probe the opposite sides of a rotating disc, then the edge-leading feature of the second sightline is expected to be flipped from the first (e.g. Prochaska & Wolfe 1997). This is not what is observed. Instead, the edge-leading profiles are merely offset by Δ v ≈ 350 km s−1 between the two sightlines. It is not clear a gaseous stream connecting to the lensing galaxy would produce such consistent edge-leading profiles on the opposite sides of the galaxy.
Further insights into the connection between the observed absorbing gas along two closely separated sightlines may be gained from comparing the chemical abundance pattern. In Section 5.3 and in Fig. 10, we show that while the majority of the absorbing components in HE 0047−1756 exhibit a uniform supersolar [Fe/Mg] relative abundance with a small scatter, three components have non-negligible likelihood of being Mg-rich (α-element enhanced). These are components 10 and 15 along sightline A and component 2 along sightline B. We note that component 2 in sightline B is especially interesting, given the observed large gas column density that exceeds all other components found near this lens. The large error bar in the Fe/Mg ratio indicates that there is a non-negligible probability that this gas may be Mg-rich. Because Mg-rich gas does not share the same SNe Ia enhanced chemical enrichment history as Fe-rich gas, these possible Mg-rich components could provide additional clues for the nature of the gas along these two sightlines.
Using the observed Fe/Mg ratio to identify absorption components sharing a common origin, we reproduce the best-fitting absorption profiles of Mg ii λ 2796, Fe ii λ 2600, and Mg i λ 2852 transitions from Fig. 4 in the bottom-left panel of Fig. 12 but highlight the few possibly Mg-rich components in shaded green. Excluding possible Mg-rich components, we find that the correlation between the absorption profiles along sightlines A and B weakens, with no clear maximum between Δ v = 0 and Δ v = 600 km s−1, due to a diminishing edge-leading signature along sightline B. We therefore caution that line-of-sight kinematics alone may not be sufficient to determine the spatial coherence of gas at multiple locations.
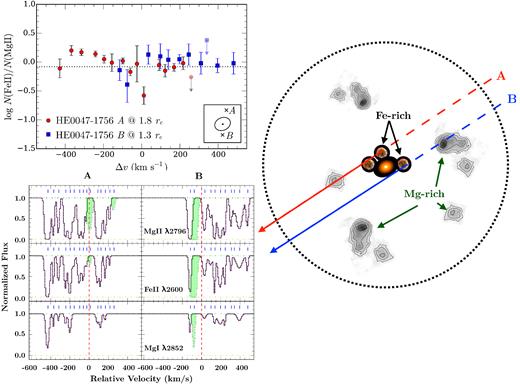
Cartoon illustrating the possibility of combining the observed |$N({\rm Fe\,\small {II}})/N({\rm Mg\,\small {II}})$| of individual components (upper-left panel) and their kinematic signatures (lower-left panel) for identifying the origins of the absorbing clouds in the diagram on the right. We adopt observations for the HE 0047−1756 lens for the illustration. In the absorption profiles panel, we present the best-fitting model absorption profiles from Fig. 4 for Mg ii λ 2796, Fe ii λ 2600, and Mg i λ 2852 transitions, but with possible Mg-rich components dotted out and shaded in pale-green. The resemblance in the kinematic signatures of Fe-rich absorbing gas between sightlines A and B is weakened. Because of the required SNe Ia contributions to the elevated Fe enrichment, as well as the remarkably uniform (Fe/Mg) relative abundances for these Fe-rich absorbing components, we propose that these components originate in the inner regions at radius r ∼ d, with the observed large velocity spread driven by recent SNe Ia ejecta (the schematic diagram on the right). While the large velocity shear (≈350 km s−1) between the Fe-rich gas across two sightlines may be explained by bulk rotation, we consider this scenario unlikely because the edge-leading features along sightlines on the opposite sides of the rotating disc are expected to be flipped from each other (Lanzetta & Bowen 1992; Prochaska & Wolfe 1997), contrary to what is observed here. We highlight the possibility of Mg ii-rich components originating in stripped gas from blue satellites or condensed halo clouds at larger distances (r ≫ d) that were enriched by early episodes of star formation.
6 DISCUSSION
The widely dispersed line-of-sight gas kinematics around the lens of HE 0047−1756 is especially remarkable when compared to the H i gas detected in nearby elliptical/S0 galaxies (e.g. Oosterloo et al. 2007; Serra et al. 2012). Roughly 40 per cent of nearby elliptical/S0 galaxies exhibit extended H i gas out to ∼30 kpc in radius with increasing velocity shear up to ± 200 km s−1 at the edges of the observed H i structures (e.g. Serra et al. 2012). The observed line-of-sight velocity spread around the HE 0047−1756 lens would still exceed the largest velocity dispersion (≈250 km s−1) known at the peak H i emission near the centre of local elliptical galaxies (see fig. 6 of Serra et al. 2012). Alternatively, the observations of the HE 0047−1756 lens can be explained if these gas-rich nearby ellipticals are surrounded by high-dispersion low column density clouds that fall below the typical column density limit of |$N({\rm H\,\small {I}})\approx 5\times 10^{19}$| cm−2 in local 21 cm observations.
The observed relative (Fe/Mg) abundance pattern offers new clues for understanding the origin of chemically enriched cool gas in massive quiescent haloes. In particular, strong metal-line absorbers are commonly attributed to starburst-driven outflows (e.g. Murray et al. 2011; Booth et al. 2013). However, it is difficult to explain the presence of metal-enriched cool gas near quiescent galaxies based on the outflow scenario. Additional explanations that have been proposed include stripped satellites due to tidal interactions or ram pressure force (e.g. Wang 1993; Agertz et al. 2009; Gauthier 2013), gas accreted from the IGM (e.g. Rauch et al. 1997; Nelson et al. 2013), as well as in situ cloud formation from thermal instabilities (e.g. Mo & Miralda-Escude 1996; Maller & Bullock 2004; Sharma et al. 2012). Different scenarios would predict different chemical abundance patterns. For example, if the gas is pre-enriched by early-generation star formation (which is expected for newly accreted IGM as well as ISM in and or stripped from blue satellites), then it is also expected to be α-element enriched (e.g. Rauch et al. 1997). On the other hand, if the gas has significant contribution from SNe Ia ejecta (which is expected for ISM in or stripped from red satellites), then it is expected to show Fe enhancement.
For the cool, Fe-rich gas, the observed supersolar (Fe/Mg) ratio indicates a significant contribution to the chemical enrichment from SNe Ia. For reference, the expected SNe Ia contribution relative to total (Type Ia and core-collapse SNe combined) in the solar abundance pattern is fIa ≈ 15 per cent (e.g. Tsujimoto et al. 1995; de Plaa et al. 2007). Here we estimate fIa for the observed Fe-rich gas around massive lensing galaxies based on the observed |$N({\rm Fe\,\small {II}})/N({\rm Mg\,\small {II}})$|, which shows a median of |$\langle \log \,N({\rm Fe\,\small {II}})/N({\rm Mg\,\small {II}})\,\rangle \approx 0\hbox{--}0.06$| (Section 5.2). From equation (4), these values represent conservative lower bounds for log (Fe/Mg). Adopting the expected yields for Type Ia and core-collapse SNe from Iwamoto et al. (1999), we estimate a minimum fractional contribution of SNe Ia to the chemical enrichment of fIa ≈ 20 per cent. The estimated SNe Ia contribution around massive, lensing galaxies is comparable to what is found for intracluster medium (e.g. de Plaa et al. 2007). Furthermore, SNe Ia occur in low-mass, evolved stars (e.g. Maoz, Mannucci & Nelemans 2014) with long lifetimes, which also implies that the gas has been enriched to relatively high metallicities by previous generations of massive stars. Indeed, observations of stellar atmospheres find an increasing Fe abundance with increasing metallicity (e.g. McWilliam 1997). We therefore expect the Fe-rich halo gas to also have a high metallicity. This expectation is at least consistent with what is found for the few Fe-rich, weak Mg ii absorbers by Rigby et al. (2002).
Based on the uniform supersolar (Fe/Mg) ratios with a small dispersion and the expected high metallicity, we argue that the Fe-rich absorbing components (which dominate the total absorption width) originate in SNe Ia enriched inner regions at radius r ∼ d from the lensing galaxies. The large velocity spread (Δ v ≳ 400 km s−1) can be attributed to recent SNe Ia ejecta (Fig. 12). In addition to chemically enriching their environment, SNe Ia ejecta can interact with the surrounding gas and deposit thermal energy that increases the velocity dispersion of the gas. We consider stellar winds from low-mass stars an unlikely source for the observed Fe-rich gas, because observations of nearby elliptical galaxies have uncovered a predominantly α-enhanced abundance pattern in these stars (e.g. Kuntschner et al. 2010).
A SNe Ia origin is qualitatively consistent with previous finding that the radial distribution of Type Ia SNe in early-type galaxies is consistent with the Sérsic profile describing the stellar light of the galaxies (Förster & Schawinski 2008). Recall also that the lensed QSO sightlines that have revealed this cool, Fe-rich gas pass through the interstellar space of the lensing galaxies at merely 1–1.8 re.
Alternatively, the observed kinematic and chemical signatures may be explained by Fe-rich gas expelled from red satellites. Large-scale surveys of nearby galaxies have shown that massive, red galaxies have a significantly higher fraction of red satellites (e.g. Prescott et al. 2011). Star formation in these red satellites is shut off as a result of gas removal upon entering the host halo (e.g. Larson, Tinsley & Caldwell 1980; Kawata & Mulchaey 2008). As the remaining stars continue to evolve in the satellites, we also expect increased contribution from SNe Ia to the chemical enrichment in the surrounding gas, resulting in increasingly Fe-rich abundance patterns.
The absence of absorption features along sightline B at 1.8 re from the lens for HE 1104−1805 and in all four sightlines at 1.4–1.7 re from the lens for HE 0435−1223 is qualitatively consistent with the partial gas covering fraction expected from either stripped satellites or clumpy SNe Ia ejecta. However, additional factors from the galactic environments may have also played an important role in depleting the cool gas near the quad-lens of HE 0435−1223. This lensing galaxy is the only one of the three lenses in our study known to reside in a group environment (e.g. Morgan et al. 2005; Wilson et al., in preparation) and the only one that appears to be devoid of cool gas at small projected distances to the lens. A similar example is found by Johnson et al. (2014), who reported a transparent sightline at d < 20 kpc from a pair of interacting galaxies. Interactions between group members may have heated or tidally stripped cool gas from the inner halo of the lens galaxy. Follow-up studies of the galaxy environments of the other two fields will cast important insights into possible environmental role in the CGM properties of these lenses.
It has been shown that chemically enriched, cool gas is not uncommon in massive, quiescent haloes (see e.g. Gauthier et al. 2009, 2010; Bowen & Chelouche 2011; Zhu et al. 2014). The mean gas covering fraction is found to be |$\kappa _{\rm Mg\,\small {II}}> 15$| per cent at d ≲ 100 kpc (Gauthier & Chen 2011; Huang et al. 2016). However, the physical nature of such gas remains unknown. Based on the suppressed velocity dispersion between Mg ii gas and galaxies, and the observed preferential geometric alignment of Mg ii absorbers with filaments, Huang et al. (2016) have recently argued that the observed Mg ii absorbers are best-explained by a combination of cool clouds formed in thermally unstable hot haloes and satellite accretion through filaments. We expect that Mg ii gas produced in these processes should exhibit an abundance pattern that reflects an α-element enhancement.
Interestingly, the strongest component (component 2) at Δ v ≈ −75 km s−1 in sightline B and a moderately strong component (component 10) at Δ v ≈ 11 km s−1 in sightline A of the HE 0047−1756 lens are consistent with an α-element enhancement, although we cannot rule out Fe-rich gas as the origin of component 2 in sightline B. We note that component 2 towards HE 0047−1756 B contains a significant amount of neutral gas with |$\log \,N({\rm H\,\small {I}})>19$|. The inferred large H i column density resembles the high velocity clouds (HVCs) found in the Milky Way Halo or DLAs and sub-DLAs found along random QSO sightlines. Both HVCs and DLAs exhibit α-element enhancement driven by core collapse SNe (e.g. Wolfe et al. 2005; Richter 2006), and both are primarily found in/near star-forming galaxies. This is, however, inconsistent with the old stellar population found for the lensing galaxy with no trace of a cool ISM. Incidentally, a blue galaxy is seen at ≈1.6 arcsec southwest of the lens. At z = 0.408, this galaxy would be at d ≈ 5.4 kpc from sightline B and nearly twice the distance from sightline A which shows weaker Mg-rich components. It is possible that this gas, if Mg-rich, originates in an infalling gas cloud or stripped gas from a blue satellite as it orbits around the lensing galaxy (see the cartoon illustration in Fig. 12).
While it is also possible that this possibly Mg-rich gas arises in the ISM or halo gas of a faint satellite that is missed in the glare of the QSO light, we consider this an unlikely scenario. Both Gauthier et al. (2010) and Huang et al. (2016) have estimated possible contributions from the CGM of satellite galaxies to the observed Mg ii absorption around massive luminous red galaxies (LRGs), assuming that the satellites can retain their gas content while moving in the hot haloes of LRGs. These authors found that the expected contribution from the CGM of satellites is <20 (10) per cent at d < 50 (100) kpc. Considering only ISM, however, which is roughly 10 times smaller in size than the CGM, we expect a contribution of <2 (1) per cent at d < 50 (100) kpc. Because the cross-section of blue satellites is negligible, the observed Mg-rich gas is unlikely to originate in an unresolved blue satellite. Follow-up spectroscopy to measure the redshift and star-forming properties of the blue object will provide necessary data for further studies.
In summary, if the observed ISM gas of massive galaxies is locally enriched by SNe Ia and and the halo is more dominated by pre-enriched gas from early-generation of young stars, then a radial dependence in [Fe/Mg] should be observed, with sightlines at small projected distances showing a higher fraction of high [Fe/Mg] absorbers. We plan to test this hypothesis using a larger sample of luminous red galaxy and QSO pairs.
7 CONCLUSIONS
We have carried out multisightline absorption spectroscopy of cool gas around three lensing galaxies at z = 0.4–0.7, HE 0047−1756, HE0435−1223, and HE 1104−1805. The fields are selected from wide-separation gravitational lens systems with angular separations θ ≳ 1.5 arcsec, which ensure that each lensed QSO serves as an independent probe of the foreground lensing galaxy. All three lensing galaxies are massive with estimated total stellar masses of log M*/M⊙ = 10.9–11.4. They exhibit spectral and photometric properties that are characteristic of nearby elliptical galaxies with half-light radii of re = 2.6–8 kpc.
For each lensing galaxy, the lensed QSO sightlines occur at projected distances of 1–2 re, providing for the first time an opportunity to probe spatial variations of the cool gas content both in the interstellar space at r ∼ re and in the haloes at larger radii r ≫ re of quiescent galaxies. The main results from our absorption-line analysis of halo gas properties at the redshift of the lensing galaxies are summarized below.
We observe a diverse range of absorbing gas properties among the three lensing galaxies. Specifically, both sightlines at 1.8 re and 1.3 re on the opposite sides of the lens for HE 0047−1756 exhibit an ultrastrong Mg ii absorber at the redshift of the lens. The lensing galaxy of HE 1104−1805 exhibits a moderately strong Mg ii absorber along sightline A at ≈re, but no trace of absorption within a sensitive upper limit along sightline B at 1.8 re. The strong absorbers found near the two lensing galaxies are resolved into 8–15 narrow components with line-of-sight velocity spread of Δ v ≈ 300–600 km s−1. In contrast, none of the four sightlines at d = 1.4–1.7 re from the quadruple lens for HE 0435−1223 exhibits detectable Mg ii absorption, and this is the only one of the three lenses in our study known to reside in a group environment.
The strong Mg ii absorbers with associated Fe ii, Mg i, and Ca ii absorption at d = 1–2 re reveal chemically enriched cool gas (T ≲ a few × 104 K) around massive, evolved galaxies at intermediate redshifts. The observed large column densities for Mg+, Fe+, and Ca+ suggest a significant neutral gas fraction, similar to Lyman limit clouds. The two strongest components may even be DLAs.
The majority of the absorbing components exhibit a supersolar Fe/Mg ratio with only three components displaying a likely Mg-rich (α-element enhancement) abundance pattern. All three possible Mg-rich components occur at the redshift of the lens for HE 0047−1756. The Fe-rich components, along both sightlines of the lens for HE 0047−1756 and one sightline of the lens for HE 1104−1805, show a uniform supersolar (Fe/Mg) ratio with a dispersion of <0.1 dex, across the full velocity range of the absorbers (Δ v ≈ 300–600 km s−1).
The absorbers uncovered on the opposite sides of the lens for HE 0047−1756 appear to share a common edge-leading absorption signature, suggesting a spatial coherence on scales of ≳ 8 kpc. However, the spatial coherence is diminished when excluding possible Mg-rich gas. The kinematic signatures of the remaining components share little resemblance between the two sightlines.
Given the predominantly old stellar populations in the lensing galaxies and the observed small scatter in Fe/Mg, we argue that the Fe-rich gas (which dominates the total absorption width) originates in the inner regions (at radius r ∼ 1–2 re) of the lensing galaxies, with the observed large velocity spread driven by recent SNe Ia ejecta. Stellar winds from low-mass stars are an unlikely source for the observed Fe-rich gas, because observations of nearby elliptical galaxies have uncovered a predominantly α-enhanced abundance pattern in these stars.
We consider the possibility that the few possible Mg-rich components arise in either stripped gas or pre-enriched halo gas at larger distances r ≫ d, where the chemical enrichment is likely driven by young stars. Incidentally, a candidate gas-rich companion is seen in deep HST images of HE 0047−1756. Follow-up studies of the galaxy environment will provide further insights into the physical origin of these components.
In summary, we show that additional spatial constraints in line-of-sight velocity and relative abundance ratios afforded by a multisightline approach provide a powerful tool to resolve the origin of chemically enriched cool gas in massive haloes. Our study of three lensing galaxies uncovers a broad range of absorbing gas properties around massive, evolved galaxies. A larger sample of lensing galaxies is clearly necessary to determine whether the supersolar Fe/Mg abundance pattern is representative of cool gas at small projected distances from evolved galaxies. At the same time, single QSO probes of foreground luminous red galaxies over a wide range of projected distances should yield important constraints for the radial dependence of [Fe/Mg], which will provide further insights into the chemical enrichment history in massive haloes.
This work is based on data gathered with the 6.5 m Magellan Telescopes located at Las Campanas Observatory, the ESO telescopes at the La Silla Paranal Observatory, and the NASA/ESA HST operated by the Space Telescope Science Institute and the Association of Universities for Research in Astronomy, Inc., under NASA contract NAS 5-26555. Additional data were obtained at the W.M. Keck Observatory, which is operated as a scientific partnership among the California Institute of Technology, the University of California and the National Aeronautics and Space Administration. The Observatory was made possible by the generous financial support of the W. M. Keck Foundation. We thank an anonymous referee for thoughtful comments that helped improve the presentation of the paper, Frederic Courbin for kindly providing the spectra of the lensing galaxies of HE 0047−1756 and HE 0435−1223 (data obtained using the ESO-VLT Unit Telescope 2 Kueyen under programmes 074.A-0563 and 075.A-0377), and Sebastián López for providing the echelle spectra of HE 1104−1805 (data obtained using the ESO-VLT Unit Telescope 2 Kueyen under programmes 067.A-0278 and 070.A-0439). FSZ and HWC thank Sean Johnson for important discussions and comments that helped improve the presentation of the paper. We also thank Rebecca Pierce for helpful comments on an earlier draft of the paper. MR thanks Andy McWilliam for useful discussions and the National Science Foundation for support through grant AST-1108815. MLW and AIZ acknowledge funding from NSF grant AST-1211874 and NASA grant ADP-10AE88G. MLW also thanks the Technology and Research Initiative Fund (TRIF) Imaging Fellowship programme for its support. In addition, HWC acknowledges the Aspen Center for Physics, which is supported by National Science Foundation grant PHY-1066293, and the organizers of the workshop on the ‘physics of accretion and feedback in the CGM’ for a productive visit in 2015 June, during which components of the work presented were accomplished.
It is possible that there exists an underlying faint disc that has been missed in the glare of the QSO images. We show in the rightmost panel of Figs 3, 5, and 7 that the 2σ limit on the surface brightness at d > re of each lensing galaxy is typically fainter than μ ≈ 23–23.5 magarcsec−2. Taking a disc scale length of rs ≈ 8 kpc, which is typical of nearby elliptical/S0 galaxies (see e.g. de Jong et al. 2004), we estimate that the disc component, if present, would have added <35 per cent of the total light.
REFERENCES
