


Abstract
Optical observations of faint meteors (10−7 < mass < 10−4 kg) were collected by the Canadian Automated Meteor Observatory between 2010 April and 2014 May. These high-resolution (metre scale) observations were combined with two-station light-curve observations and the meteoroid orbit to classify meteors and attempt to answer questions related to meteoroid fragmentation, strength, and light-curve shape. The F parameter was used to classify the meteor light-curve shape; the observed morphology was used to classify the fragmentation mode; and the Tisserand parameter described the origin of the meteoroid. We find that most meteor light curves are symmetric (mean F parameter 0.49), show long distinct trails (continuous fragmentation), and are cometary in origin. Meteors that show no obvious fragmentation (presumably single body objects) show mostly symmetric light curves, surprisingly, and this indicates that light-curve shape is not an indication of fragility or fragmentation behaviour. Approximately 90 per cent of meteors observed with high-resolution video cameras show some form of fragmentation. Our results also show, unexpectedly, that meteors which show negligible fragmentation are more often on high-inclination orbits (i > 60°) than low-inclination ones. We also find that dynamically asteroidal meteors fragment as often as dynamically cometary meteors, which may suggest mixing in the early Solar system, or contamination between the dynamic groups.
1 INTRODUCTION
Characterizing the meteoroids that impact the Earth each day is of the utmost importance for spacecraft, satellites, and life on Earth. While most of these bodies are too small to survive ablation and reach the ground, objects in the millimetre to centimetre size range are capable of damaging satellites (Drolshagen 2008). These faint meteors [masses between 10−7 and 10−4 kg, based on luminous efficiency values from Weryk & Brown (2013)] may be studied as they ablate in the atmosphere, and understanding their physical properties helps us understand those of their parent bodies: asteroids and comets.
Determining the physical properties of meteoroids is useful. In a practical sense, estimates of meteoroid penetration and spacecraft damage may be improved by determining more accurate values of meteoroid density and structure. Scientifically, differences between asteroids and comets can be deduced by observing how meteoroids from each parent body ablate and fragment in the atmosphere. Current models of Solar system formation suggest that asteroids and comets should differ significantly in their fundamental composition and constituents due to their formation at different distances from the Sun; in particular, comets should be lacking in refractory particles which formed at high temperatures in the inner Solar system. Calling this into question, in 2004, the Stardust probe flew by Comet Wild 2 and collected thousands of particles containing refractory material believed to have formed in the inner Solar system (Brownlee et al. 2006). These observations suggested similarities in composition between asteroids and comets, and large-scale mixing in the solar nebula. The Stardust mission collected samples between 1 and 300 μm in size: no millimetre-sized particles from comets or asteroids have ever been collected, apart from meteorites. Additionally, the presence of large refractory meteorite components, such as chondrules and calcium–aluminium inclusions in comets, which are too large to have been collected during the Stardust mission, are of interest to Solar system formation modellers. For these reasons, observing faint meteors and modelling their ablation are important for studying the composition and structure of cometary and asteroidal particles in this size range.
Meteor ablation models vary, but are based on the same assumptions: energy and momentum are conserved, and the observed brightness is proportional to the lost kinetic energy. There are up to four equations that make up the classical model: the deceleration equation, which describes the momentum transferred from the meteor to the intercepted air column; the mass-loss equation, which describes the energy needed to ablate the meteoroid; the luminosity equation, which describes the energy used to produce visible light; and the temperature equation, which is based on conservation of energy. These equations have many coefficients and make various assumptions. Three important coefficients are the drag coefficient, which describes what fraction of the meteoroid's momentum is transferred to the air column; the heat transfer coefficient, which describes what fraction of kinetic energy is used for ablating the meteoroid; and the luminous efficiency, which is the fraction of kinetic energy which produces light. The meteoroid is assumed to be spherical and uniform in composition; and the object is a solid, single body that is non-fragmenting. As the meteoroid descends, interactions between it and the exponentially thickening atmosphere heat it up and result in a late-peaked light curve (the variation in observed brightness as a function of time). This is often called a classical light curve.
The classical, non-fragmenting ablation model was accepted for lack of evidence to the contrary until Jacchia (1955) noted that the model did not agree with the behaviour of faint meteors observed with Super-Schmidt cameras. He found that the photometric masses of faint meteors (calculated from the light they produce) were much larger than the dynamic masses (determined by deceleration), and concluded that faint meteors fragment during their descent through the atmosphere. He also found that many of the faint light curves had their peak brightness near the beginning of the trajectory, and the length of the light curves (i.e. the difference between the beginning and ending height) tended to be smaller than predicted by classical ablation theory. The classical light-curve shape (a steady rise to a maximum brightness followed by a steep drop) is not typical of faint meteors, which show a wide variety of light-curve shapes (Fleming et al. 1993; Murray, Hawkes & Jenniskens 1999; Koten & Borovička 2001; Beech & Murray 2003). Within a single meteor shower, different light-curve shapes have been measured, and year to year differences in meteor shower families can also be seen (Murray et al. 2000). A study by Faloon, Thaler & Hawkes (2004) found no statistically significant differences in the F parameter between shower and sporadic meteor light curves, suggesting similar structures for the two groups of meteors. Similarly, Koten & Borovička (2001) found meteor light curves to have, on average, symmetric shapes, and large variation within individual meteor showers.
Fragmentation and the quantitative dustball model presented by Hawkes & Jones (1975) are able to explain the anomalous features observed in faint meteor light curves. The dustball model suggests that meteoroids are comprised of grains with a high boiling point held together by a material (a ‘glue’) with a lower boiling point. When the boiling temperature of the glue is reached during ablation, the glue is vaporized and the stony or metallic grains being held together are released. Once they reach their boiling temperature, each grain ablates classically, and the light produced is assumed to be the summed light production from each grain. The glue does not contribute to the observed brightness. This model suggests that small (millimetre-sized) meteoroids will have approximately constant begin, end, and maximum brightness heights, with respect to mass. The heights are set by the physical properties chosen for the grains. The dustball model has been used as the basis of recent numerical meteoroid ablation models somewhat successfully (Campbell-Brown & Koschny 2004; Borovička, Spurný & Koten 2007). The models by Campbell-Brown & Koschny (2004) and Borovička et al. (2007) were able to reproduce meteor light curves and observed decelerations (using two different fragmentation methods), but neither was able to simultaneously reproduce high-resolution behaviour of the meteoroids. Both models predicted longer and brighter wakes than observed with the high-resolution (metre scale) cameras (Campbell-Brown et al. 2013). A shorter or fainter predicted wake would be acceptable and the difference between observed and predicted wake may be explained through light emission by atoms in the trail. These high-resolution observations represent a new constraint for modellers and a new source of information on meteoroids.
If TJ ≤ 2, the meteoroid had a Halley-type orbit. Values greater than 2, but less than or equal to 3 indicate meteoroids from Jupiter family comets, and Tisserand values greater than 3 are associated with asteroids. These boundaries are not absolute: objects on asteroidal orbits can show cometary features (e.g. Comet Encke), and asteroidal objects can have cometary Tisserand values (e.g. near-Earth objects). The Tisserand parameter can be changed by close encounters with any of the planets other than Jupiter, and by radiation forces, which are particularly important for millimetre-sized objects. Nevertheless, the Tisserand parameter can separate meteoroids into three broad origin groups: asteroids, Jupiter family comets, and long period comets. For this work, we will be using the Tisserand parameter as a proxy for the origin of observed meteor events.
The structure of a meteoroid depends on the properties of the region of the Solar system in which it formed. Cometary meteoroids are porous, fragile objects, according to Whipple's icy-comet model (Whipple 1950, 1951), and this is consistent with studies of cometary meteoroid density and strength. Borovička et al. (2007) found that the Draconids, a Jupiter family meteor shower, have low mechanical strength, between 5 and 20 kPa. Borovička (2007) reports bulk densities around 300 kg m−3 for Jupiter family meteoroids (inferred from studies of the Draconids). He also reports that Halley-type meteoroids have densities around 800 kg m−3 (inferred from studies of the Perseids and Leonids), which agrees with Kikwaya, Campbell-Brown & Brown (2011), who find densities between 360 and 1510 kg m−3. Kikwaya et al. (2011) also find that asteroidal meteors have an average bulk density of 4700 kg m−3, and Borovička (2007) suggests strengths between 100 and 5000 kPa for the same class of meteoroids. The general trend from these data is that cometary meteoroids are soft, porous, fragile objects that crumble easily, while asteroidal meteoroids are stronger objects that do not fragment as readily.
In equation (3), ρb is the atmospheric density at the beginning of the luminous path; v∞ is the pre-atmospheric velocity; and zR is the zenithal angle of the radiant. Ceplecha (1988) used the Kb parameter to classify meteors into five main groups: asteroidal, A, B, C, and D. The groups refer to mm–cm-sized meteoroids and are associated with different types of material, as described in Table 1. The Kb parameter cannot distinguish between the effects of density, fragmentation, and volatility.
Classification and description of meteors according to their Kb parameter. The bulk density values are from Ceplecha (1988).
| Group | Kb | Description | Bulk density |
|---|---|---|---|
| (g/cm−3) | |||
| Asteroidal | > 8 | Ordinary chondrites | 3.7 |
| A | 7.3–8 | Carbonaceous chondrites | 2.0 |
| B | 7.1–7.3 | Dense cometary material | 1.0 |
| C | 6.6–7.1 | Regular cometary material | 0.75 |
| D | < 6.6 | Weak cometary material | 0.27 |
High-resolution video observations are able to provide strong constraints for meteor ablation models, which improves our understanding of both meteor-atmosphere interactions, and the physical properties (strength, density, mass) of meteoroids and their parent bodies (Campbell-Brown et al. 2013). In this work, we combine analysis of meteor light curves with high-resolution observations of meteor wake (or morphology) and the meteoroid orbit to infer the properties of parent bodies. Our questions include how often and in what way do cometary and asteroidal meteoroids appear to fragment? Do meteors from Jupiter family comets, long period comets, and asteroids show similar light-curve shapes? Do single-body meteors (which we have defined as those showing very short wake, implying negligible fragmentation) show classical light-curve shapes, and can the shape of light curves indicate the strength or fragmentation mode of meteoroids in general?
2 EQUIPMENT
The data used for this analysis were collected with the Canadian Automated Meteor Observatory (CAMO; Weryk et al. 2013). Each night, weather and moon permitting, the two station system automatically collects meteor observations. The two stations are located 45 km from each other, in Elginfield, Ontario, Canada (43| $_{.}^{\circ}$|193N, 81| $_{.}^{\circ}$|316 W) and Tavistock, Ontario, Canada (43| $_{.}^{\circ}$|265N, 80| $_{.}^{\circ}$|772W). The guided system has two intensified cameras: a wide-field camera with a 28° field of view, used to collect the meteor light curve and compute its orbit, and a narrow-field 1| $_{.}^{\circ}$|5 field-of-view camera that tracks the meteoroid in flight and provides high-resolution observations. Both cameras have resolutions of 640 × 480, and have 12 bit image depth to decrease the chances of image saturation. The wide-field cameras run at 80 frames per second and the narrow field at 110 frames per second. The narrow-field camera is able to resolve 3 m pixel−1 at a range of 100 km.
The wide-field camera detects meteors in real time with the All Sky and Guided Automatic Realtime Detection (asgard) software (Weryk et al. 2008). This software guides a pair of mirror-mounted galvanometers to track the meteor and direct the light into the narrow-field camera. For each frame of the wide-field video, asgard searches for pixels above a threshold set at five standard deviations above the mean background. If at least 6 pixels in any 8 × 8 pixel region are brighter than the threshold, it is flagged as a meteor, provided the detection occurs in at least three consecutive frames. A 5σ threshold detects 67 per cent of all meteors (Weryk et al. 2013).
The two station light-curve observations were collected between 2010 April 21, and 2014 May 11, and 3561 observations were recorded in total. The high-resolution video observations were collected between 2010 October 10 and 2014 May 11, and 2041 high-quality videos were collected. The discrepancy in collection dates is due to a few factors: the narrow-field cameras were not operational until late 2010; occasionally hardware failures occur (e.g. failure of the mirror control card; shifts of the wide-field plate); and sometimes the tracking is incomplete and the meteor moves out of the field of view.
3 METHOD AND CLASSIFICATION
The first task was to classify both the light-curve shapes and narrow-field morphologies in our sample. By combining these observations with the meteor's Tisserand parameter, we can investigate the physical properties of different classes of meteoroids, and the relationship between the light-curve shape and the fragmentation behaviour.
Because the height, brightness, and orbits of meteors are obtained automatically, errors can occur: asgard may mistakenly pick a nearby star or a transient bright pixel instead of the meteor, resulting in erroneous calculated trajectories, orbits, and light curves, or an error in the flat correction can affect the determined brightness values. As a result, the first goal was to examine each of the automated reductions and select the ones with fewest errors for additional analysis.
Our filter was run on all 3561 meteor light curves. 18 per cent of these events belong to meteor showers (the majority being North Taurids, South Taurids, Geminids, and Orionids). As a first filter, any meteors that began or ended off of the field of view were removed from consideration, since accurate calculation of the F parameter requires the beginning and ending heights. These events made up 55 per cent of our original 3561 meteor events.
Next, we plotted the light curve (in terms of absolute magnitude, which is the magnitude the meteor would have if placed at a range of 100 km) as recorded from each station, and generated a smooth curve with low pass filter interpolation. Three interpolated light curves were generated: one from each station, and one that considered data from both stations. A filter based on light-curve coverage and agreement between stations was then implemented in two steps.
At heights where there was overlap between the stations, the light curves were compared to verify that there was a variance of less than 0.5 mag for at least 50 per cent of the overlapping heights.
The overlapping height interval of light curves from each station was verified to span at least 70 per cent of the combined light curve derived from both stations.
The purpose of this filtering was to improve confidence in the asgard-generated light curves and trajectories by ensuring that there was good coverage and agreement of each meteor's light curve from both stations. The filters as applied to a sample meteor event are shown in Fig. 1. Varying sky conditions from each station and spurious asgard picks could cause differences in the photometry from each station. In manual reductions of the data, uncertainties are typically of the order of 0.2 mag, but are closer to 0.5 mag for the automated reductions.

The two filters applied to the collected data set ensured that the two station observations agreed with each other. The black diamonds indicate where light curves from both stations (Tavistock is Station 01 and Elginfield is Station 02) begin and end their height overlap.
After this filtering, the initial set of 3561 meteors was reduced to 891 high-quality observations. The remaining combined meteor light curves were then classified. Light curves with a single peak were classified according to the F parameter. Other shapes seen include double peaked and flat curves, and are shown in Fig. 2.

There are a few variations on flat light curves that were observed: the entire curve may have a small range of measured brightness; the curve may increase in brightness and remain almost constant at its maximum intensity for the remainder of the observation; or it may begin and remain near a maximum intensity before decreasing. For this work, flat meant that at least 50 per cent of the light curve on both sides of the point of maximum brightness was within 0.5 magnitudes of the maximum brightness. For meteor light curves that fall into this category, it is not informative to calculate an F parameter because the majority of the curve is within the estimated uncertainty of the maximum point. The light-curve shape classifications are thus: early peaked (F < 0.35); symmetric (0.35 ≤ F ≤ 0.65); late peaked (F > 0.65); double peaked; and flat. We expect classical light curves to fall into the late-peaked category.
The next step was to classify the high-resolution narrow-field video observations. These observations offer a new way to study meteor ablation, as development of the wake and any fragmentation can be observed directly. These videos were classified manually based on the dominant morphology of the head and wake of the meteor and the fragmentation mode (see Fig. 3). The morphology of the meteor wake and the head of the meteor are intertwined. A meteoroid experiencing continuous fragmentation is expected to show a long trail and a smeared head due to the differential deceleration of grains of assorted sizes. The meteoroid is crumbling apart as predicted by the dustball model, and may be made of weak material. A meteoroid experiencing negligible fragmentation, on the other hand, may indicate strong material, and will show a rounded head and little to no wake, indicating that very little solid material is being shed by the meteoroid. Meteors that show gross fragmentation, either along the line of motion or transversely, are poorly understood at the heights of the meteoroids being examined in this study (typically h > 90 km). The mechanism that allows a meteoroid to disrupt into similarly sized portions is unknown: for large meteoroids, pressure is the cause, but pressure is negligible at the heights at which these faint meteors ablate (Stokan & Campbell-Brown 2014). The video classifications are listed in Table 2 and illustrated in Fig. 3.
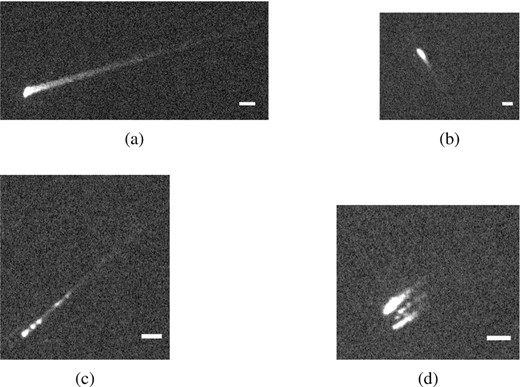
The different morphologies used to classify meteor events. The scale bar in each figure corresponds to 100 m. (a) shows a distinct trail (continuous fragmentation) and a smeared head, (b) shows a meteor with a short trail (negligible fragmentation) and a round head, (c) shows a meteor experiencing gross fragmentation, and (d) is a meteor showing transverse fragmentation.
Classification categories used for the high-resolution video observations collected from CAMO.
| Description |
|---|
| Smeared head; distinct wake; no distinct fragments |
| Round head; little to no wake; no distinct fragments |
| One or more noticeable fragments |
| One or more fragments showing transverse speed |
| Description |
|---|
| Smeared head; distinct wake; no distinct fragments |
| Round head; little to no wake; no distinct fragments |
| One or more noticeable fragments |
| One or more fragments showing transverse speed |
Some meteors (545) clearly showed multiple consecutive morphologies during their ablation; they were not included in this analysis and will be studied in a future work. In total, 1496 high-resolution single-morphology video observations were classified.
A sample of long- and short-trailed meteors were measured to determine the average length in metres for the two categories. The length of the meteor was measured as the distance between the head and the portion of the trail that exhibited brightness below the mean background brightness plus two standard deviations. Meteors classified as having long trails were found to be on average, 195 m in length, whereas those classified as having short trails were 90 m. These lengths took into account the range to each meteoroid, as well as a correction for the perspective angle (the angle between the meteoroid velocity vector and the camera line of sight).
The meteors that made up our final data set had two station observations in agreement with each other, were well tracked, had high-resolution video observations that began and ended on screen, and showed only one dominant morphology.
After classifying the high-resolution narrow-field videos our final data set was made up of 295 meteor events. The range of meteor maximum absolute magnitudes for this set of events is −2.7 to 3.1 mag.
4 RESULTS
4.1 High-resolution video morphologies
Over the data collection period for narrow-field video observations, 27 per cent of the videos collected showed multiple morphologies. These events show various combinations of the morphologies described in Table 2. For example, many meteors initially show a short trail, and then a long, distinct trail, and then finally gross fragmentation. Others show long distinct trails and then fragmentation either along the line of motion or transversely. These meteor events will be discussed in a future work.
The 1496 single-morphology meteor events are shown in Fig. 4. Meteors that show distinct trails make up the majority of events seen by CAMO. The surprising proportions of each parent class described by each narrow-field morphology is also indicated on Fig. 4. Contrary to expectations based on predicted meteoroid strengths, there is equal probability for a meteoroid showing a distinct trail as originating from an asteroid or cometary parent body. Similarly, this also applies to meteoroids showing short trails or gross fragmentation.
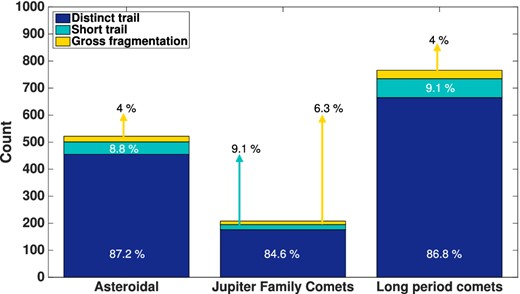
All 1496 single-morphology, high-resolution videos, collected between 2010 October 10 and 2014 May 11, according to Tisserand parameter. There are 1296 meteor events that were classified as having distinct trails; 135 meteor events that showed short trails; and 65 events that showed gross fragmentation.
4.2 Light curve and Tisserand parameter data distribution
Each of the 891 high-quality light-curve meteor observations were classified according to light-curve shape. For most events, this meant a description based on the F parameter value. The distribution of all single-peaked, non-flat light curves is shown in Fig. 5. Flat light curves made up 15 per cent of the classified light-curve shapes and double-peaked curves made up 18 per cent (but in reality, the contribution is much less). As described previously, classifying flat light curves according to the F parameter was avoided as at least 50 per cent of the light curve on both sides of the maximum brightness value are within 0.5 mag, the uncertainty in magnitude for light curves computed by asgard. The mean F parameter value is 0.49, and based on Fig. 5, most single-peaked light curves are symmetric in shape.
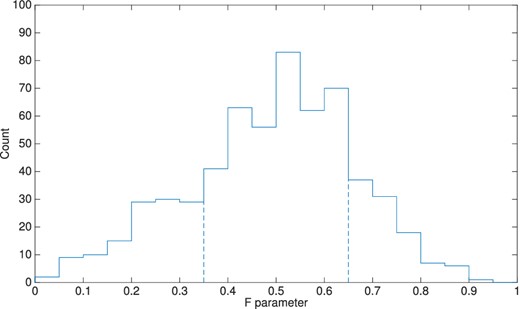
Of 891 meteor events, 599 were single peaked. The mean F parameter value is 0.49. Fourteen per cent of the 891 events were early peaked; 42 per cent were symmetric; and 11 per cent were late peaked.
Fig. 6 shows the distribution of meteor events by Tisserand parameter. Values greater than three describe objects with asteroidal orbits: 37 per cent of meteor events fall into this category. Values less than or equal to three but greater than two describe Jupiter family comets, and values less than or equal to two describe long period comets. These make up 14 per cent and 49 per cent of our data set, respectively.
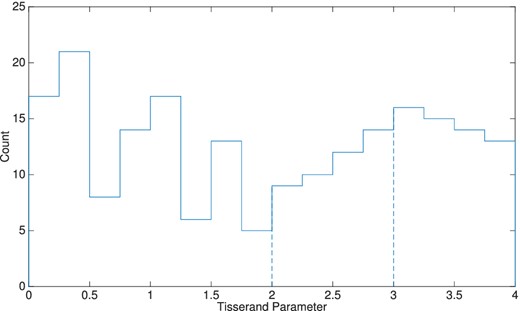
Meteor events with Tisserand parameter values between zero and four. The dashed vertical lines indicate the distinction between the parent classes: T less than or equal to two describe long period comets; T less than or equal to three, but greater than two describe Jupiter family comets; and T greater than three describe asteroids.
4.3 Video morphology subsets
Each video morphology is associated with an expected light-curve shape and origin. For example, we would expect asteroidal meteoroids to exhibit high material strength compared to cometary bodies, and thus show less fragmentation, corresponding to short trails in the high-resolution video, and late-peaked light curves. Conversely, we would expect cometary meteoroids to fragment, showing either distinguishable fragments or long trails, and producing a variety of light-curve shapes. Sorting the data by morphology and plotting it as a histogram according to the light-curve shape, and divided by parent class contribution allows us to verify or refute these expectations. Fig. 7 shows the two most commonly seen video morphologies: meteors with distinct trails, and meteors with short trails. Both subsets unexpectedly show very similar distributions of light-curve shape (mostly symmetric in both cases), and contributions by parent classes. It should be reiterated that this result is unexpected as meteoroid ablation models predict that meteors with short trails (interpreted to undergo negligible fragmentation) should produce late-peaked light curves, which was not the case here.

4.4 Parent class subsets
To evaluate predictions of differential ablation and fragmentation behaviour between asteroidal and cometary meteoroids, the data set was sorted by Tisserand parameter into two groups (asteroidal origin and cometary origin), and histograms were plotted according to the light-curve shape and divided by high-resolution video morphology. These are shown in Fig. 8. Asteroidal and cometary meteoroids show similar properties, evidenced by similar distributions in Fig. 8. Asteroidal meteors, which we expect to be stronger than those originating from comets, were expected to show mostly late-peaked curves, and negligible fragmentation.

4.5 Kb parameter
The Kb parameter can be used as a measure of the strength of meteoroids, so one would expect that meteors with long trails, which are crumbling, would have lower strength than meteors which fragment into a few pieces, while non-fragmenting meteors should be strongest. In Fig. 9, the meteor events are sorted by video morphology and the distributions of Kb for each morphology are plotted. The different Kb groups are listed in the top panel of the figure. This allows us to evaluate the strength and volatility of the events according to their observed morphology. Meteors showing long trails are expected to be weak, and to have low Kb values, whereas those showing gross fragmentation are expected to be strong, fracture into large objects, and have high Kb values.
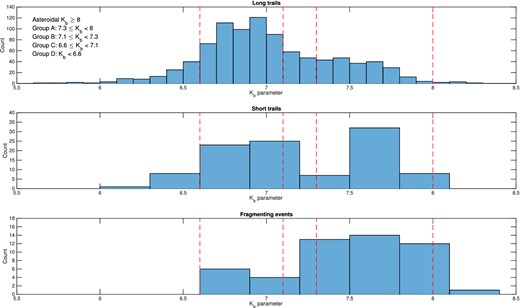
Kb histograms for the three morphologies. The groups defined by Ceplecha (1988) are given in the top panel, and the red dashed lines define those boundaries.
4.6 Orbital elements
As discussed below, the Tisserand parameter is not always a reliable indicator of origin. Inclination, on the other hand, is not affected by radiative forces, so low or high inclination should reliably divide long period cometary material from asteroidal or Jupiter family comet material. Meteor events were analysed according to their orbital elements to see if any further relationships exist. Events with inclination uncertainties greater than five degrees, were removed, as were those with unrealistic velocities and poor convergence angles. A plot of inclination versus eccentricity is shown in Fig. 10, with the narrow-field video morphologies shown in different colours. Objects of asteroidal origin are expected to have low inclinations and low eccentricities, as are objects that show little to no fragmentation.
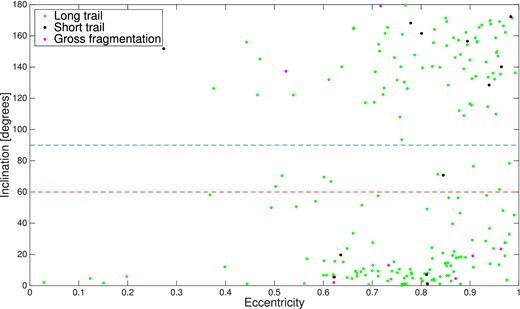
This figure includes all events with acceptable convergence angles and velocities that end onscreen. The remaining events with inclination uncertainties greater than 5|$\deg$|, were removed. The blue dashed line marks the boundary between prograde and retrograde objects, and the red dashed line marks the boundary between low- and high-inclination objects.
5 DISCUSSION
Fig. 4 shows that most of the meteors observed by CAMO have distinct trails, consistent with continuous fragmentation. This supports the dustball model, implying that most meteoroids are made of loosely bound grains which separate when the meteoroid heats up. A study by Weryk et al. (2013) found that 75 per cent of all tracked, multistation events showed fragmentation in some form. We find that approximately 90 per cent of our full data set (1496 video classifications) show fragmentation (continuous or gross). This discrepancy may be due to a few factors: different data sets were used for the two studies and the threshold criteria for fragmentation may have been different. The Weryk et al. (2013) study considered multistation events, whereas this study did not require that narrow-field observations be recorded at both sites as long as there were two-station wide-field observations to calculate the meteor trajectory and light curve. The mean F parameter value for our light-curve data set of 891 meteors is 0.49, and this is consistent with other studies on faint meteor light curves: Fleming et al. (1993) studied 34 meteors, mainly sporadic meteors, and found an average F value of 0.51 for curves 1 and 2 mag below the peak magnitude; Beech & Murray (2003) analysed Leonid light curves from 1998 to 2001, and found a range of F values from 0.487 to 0.652, for light curves measured 1.25 mag below the peak magnitude. In this work, the mean F parameter for cometary meteors was 0.49, and for asteroidal meteors was 0.48, which is essentially the same.
The ranges used for the F parameter [early peaked (F < 0.35); symmetric (0.35 ≤ F ≤ 0.65); late peaked (F > 0.65)] were chosen such that the symmetric range would have a smaller range than early peaked and late peaked, to ensure that only truly symmetric curves would be selected. However, this is subjective. To assess how the results would change if we implemented a stricter range for the symmetric category, we reclassified meteor events, allowing the symmetric category to hold only those events with 0.4 ≤ F ≤ 0.6. We found that both cometary and asteroidal groups of meteors kept approximately the same fraction of events that show distinct trails, short trails, and gross fragmentation, in spite of the different F range used for symmetric light curves. With a narrower range, symmetric light curves are still the most frequently seen, but late-peaked light curves become a larger portion of the overall distribution. A narrower range for symmetric light curves changes the proportion of events in each F parameter category, but does not change the overall results of our study.
The most surprising result to come out of this work are the proportions shown in Fig. 4. We expected that most cometary meteors would show continuous fragmentation (long distinct trails), while asteroidal meteoroids would show fragmentation less frequently (short, negligible trails). As seen in Fig. 4, this was not the case. The fact that the proportions are almost equal suggests that the fragmentation mode [distinct trail (dustball fragmentation) versus negligible trail (single-body ablation) versus gross fragmentation] is not an indicator of the object's origin. This implies either (1) that cometary and asteroidal meteors may be more similar in structure than previously believed. This agrees well with studies of comet Wild 2 (on particles smaller than those in our data set) that suggest large-scale radial mixing occurred in the early Solar system (Brownlee, Joswiak & Matrajt 2012). Or (2) that sporadic meteors on asteroidal orbits may have originated from cometary parent bodies, but had their orbits slowly circularized by radiative forces, pushing them across the dynamic boundary.
The majority of meteors observed in this study are cometary in origin, as shown in Fig. 6. However, the Tisserand parameter is a constant only under the restricted three-body problem. It is important to note that we only see the current orbit in our analysis. Objects that appear to be on asteroidal orbits may have had their originally cometary orbits perturbed by radiative forces. Overlap between categories is a possibility, and has been previously observed (comet 2P/Encke has an asteroidal orbit, for example). This means that the distribution of meteor events shown in Fig. 6 may not accurately describe the observed objects: because Poynting Robertson drag will increase the Tisserand parameter, the particles found to be asteroidal in origin may actually come from Jupiter family comets. To assess the likelihood of contamination between dynamic groups, we considered dynamic and collisional lifetimes of small particles. Simulations done by P. Pokorny (private communication) of millimetre-sized particles show that within 50 000 yr, objects on Jupiter family comet orbits are able to change their Tisserand parameters to values greater than 3, suggesting that contamination of asteroidal objects by decaying cometary meteoroids is likely. This may explain the similarities found in this study between dynamically asteroidal and cometary particles.
The orbital elements of our meteor events were examined to better understand how their Tisserand parameters relate to their orbital elements. From Fig. 10, we find that there are almost no events with low inclinations and low eccentricities, where we would expect most asteroidal objects to belong. Interestingly, we find that by colouring the events by their video morphology, it becomes apparent that many of the short-trailed objects are in retrograde orbits (7 versus 5 in prograde orbits). The difference is greater when the events are divided into groups with inclination greater than and less than 60|$\deg$| (the red dashed line): we see that there are more high-inclination short-trailed objects than low inclination (8 versus 4). While there are very few short-trailed objects that end onscreen in total, these results are lower limits. We were cautious in flagging events as ending onscreen: both wide-field observations needed to end onscreen, or the event was flagged as ending offscreen. When we recreate Fig. 10 with events that end both on and offscreen, the same trend is seen (short trailed events are highly inclined), but in greater numbers (39 retrograde versus 27 prograde, 49 high inclination versus 17 low inclination). Objects that show minimal amounts of fragmentation are expected to have low inclinations and eccentricities, which is contrary to our results. While it is possible to change the inclination of a particle dramatically through a planetary interaction, it is very unlikely to change a prograde orbit to a retrograde orbit, so most of these non-fragmenting objects are likely cometary in origin.
Fig. 7 shows that the majority of meteors observed by CAMO are cometary meteoroids with symmetric light curves. We expected meteors with asteroidal origins to show minimal amounts of fragmentation (little to no wake in the high-resolution video), and we expected meteors with negligible fragmentation to have late-peaked light curves, consistent with single body ablation. Fig. 8(a) shows that our data do not support those predictions. Instead the majority of dynamically asteroidal meteors observed with CAMO show symmetric light curves (indicative of a distribution of grain sizes) and long trails, like the cometary meteoroids. These objects were expected to ablate as single bodies, and the lack of classically shaped light curves is unexpected, but may be due to non-uniform compositions or densities, or non-spherical shapes. Pockets of volatiles may be present. This does not explain the observed trails, however.
From Fig. 7(b), we see that meteors with short trails show mainly non-classical light curves. This may also be indicative of differential ablation. We find that meteor light curves are unable to predict the fragmentation behaviour of the meteoroid.
The Kb parameter, when plotted for sporadic meteors, shows two distinct maxima (Ceplecha 1967). The distribution of our meteor events, when sorted by video morphology, is shown in Fig. 9. Non-fragmenting meteors (those that show short trails) are expected to be strongest; the crumbling meteors that show long trails are expected to be the weakest; and those that show gross fragmentation are somewhere in between. The Kb parameter is also a measure of volatility: a strong meteoroid with pockets of volatiles will have a high begin height. Meteors which do not fragment but have higher than expected begin heights (low Kb parameter) may be like this. We find that meteors that show long trails (crumbling meteors) are predominantly weak; meteors that show short trails (non-fragmenting) can be either weak or strong, surprisingly; and meteors that show gross fragmentation are strong.
6 CONCLUSIONS AND FUTURE WORK
In this work, we classified and compared faint meteors on asteroidal and cometary orbits by combining high-resolution video observations, light-curve shape, and the computed meteoroid orbit. We find that the majority of meteors observed with the CAMO have cometary orbits (T ≤ 3) and show long distinct trails in high-resolution video (pixel scale ∼3 m at 100 km). We observed that dynamically asteroidal meteors tended to fragment as often as their cometary counterparts. This contradicts the expectation that asteroidal objects are stronger and less susceptible to fragmentation, and may mean that the particles on asteroidal orbits are actually cometary.
The two most commonly seen morphologies, distinct trails and short trails, show the same trend, unexpectedly: whether a meteoroid experiences continuous fragmentation or not, it is likely to show a symmetric light curve. This is not what we predicted: meteoroids that show negligible fragmentation (i.e. a short trail) were expected to show a late-peaked light curve. As a result, ablation of a non-homogeneous object, or differential ablation, may have to be considered for these cases. Light-curve shape should not be considered a reliable sign of a meteoroid's fragmentation behaviour. When the data set is analysed in terms of the Tisserand parameter, we see that dynamically asteroidal meteors show remarkably similar proportions and properties to cometary meteors.
With our large data set, there are a few next steps to consider. In this work, we did not separate out shower meteors. Doing so will allow us to compare our results to similar studies of double-station video observations of meteors, such as work by Štork et al. (2002) or Koten et al. (2004). The goal of that work would be to do the same kind of analysis as done in this study (i.e. study light curve and fragmentation behaviour to infer strength and structure), but to control the parent body more strictly.
From our original video data set of 2041 observations, we removed 545 events that showed multiple morphologies. Objects that we observe beginning with no trail which then develop one may allow for detailed modelling of fragmentation and determination of physical properties, since we are seeing the onset of fragmentation. Conversely, meteoroids that show a trail that vanishes, may be objects with a unique grain size distribution, with a superposition of a certain conventional profile (e.g. power law) and a single large refractory grain. Finally, we have a number of meteor events that show gross fragmentation with both transverse dispersion of fragments and dispersion along the direction of motion. As the mechanism responsible for the transverse spread of fragments at these heights (h > 90 km) is poorly understood, this set of events may be able to provide some strong constraints for new models of small meteoroid fragmentation.
The authors thank J. Borovička for helpful comments and review of the manuscript. The authors thank Z. Krzeminski and J. Gill for maintenance of CAMO, and J. Aubrey and A. Iffat for their help with this project. The authors also thank P. Pokorny for helpful discussions. Funding was contributed by the NASA Meteoroid Environment Office (grant NNX11AB76A).
REFERENCES
