


Abstract
We perform dry merger simulations to investigate the role of dry mergers in the size growth of early-type galaxies in high-density environments. We replace the virialized dark matter haloes obtained by a large cosmological N-body simulation with N-body galaxy models consisting of two components, a stellar bulge and a dark matter halo, which have higher mass resolution than the cosmological simulation. We then resimulate nine cluster-forming regions, whose masses range from 1 × 10¹⁴ to 5 × 10¹⁴ M⊙. Masses and sizes of stellar bulges are also assumed to satisfy the stellar mass–size relation of high-z compact massive early-type galaxies. We find that dry major mergers considerably contribute to the mass and size growth of central massive galaxies. One or two dry major mergers double the average stellar mass and quadruple the average size between z = 2 and 0. These growths favourably agree with observations. Moreover, the density distributions of our simulated central massive galaxies grow from the inside-out, which is consistent with recent observations. The mass–size evolution is approximated as |$R\propto M_{{\ast }}^{\alpha }$|, with α ∼ 2.24. Most of our simulated galaxies are efficiently grown by dry mergers, and their stellar mass–size relations match the ones observed in the local Universe. Our results show that the central galaxies in the cluster haloes are potential descendants of high-z (z ∼ 2–3) compact massive early-type galaxies. This conclusion is consistent with previous numerical studies which investigate the formation and evolution of compact massive early-type galaxies.
1 INTRODUCTION
Observations strongly suggest that massive ( ≳ 1011 M⊙) early-type galaxies (ETGs) at high-z (z ∼ 2–3) are more compact than galaxies with comparable mass in the local Universe. This finding challenges the Λ cold dark matter (ΛCDM) model of the structure formation of the Universe. High-z ETGs are 3–5 times smaller than local ETGs with comparable mass (e.g. Daddi et al. 2005; Trujillo et al. 2006, 2007; Buitrago et al. 2008; Cimatti et al. 2008; van Dokkum et al. 2008). These high-z ETGs also lie below the stellar mass–size relation in the local Universe, a relation well investigated through the Sloan Digital Sky Survey (SDSS) data base (e.g. Shen et al. 2003). The stellar mass densities of these high-z ETGs are inferred to be one to two orders of magnitude higher than those of local ETGs. Several recent observations have also revealed higher velocity dispersions of high-z ETGs than those of local ETGs with comparable mass (Cenarro & Trujillo 2009; Cappellari et al. 2009; van Dokkum, Kriek & Franx 2009; van de Sande et al. 2011). Compact massive ETGs at high-z exhibit quiescent star formation activity and relatively old stellar populations (e.g. Cimatti et al. 2008; van Dokkum et al. 2008), similarly to ETGs in the local Universe (e.g. Thomas et al. 2005). Moreover, they are extremely rare in the local Universe (e.g. Taylor et al. 2010). Because local ETGs also contain old stellar populations, it appears that compact massive ETGs at high-z must increase their size and decrease their velocity dispersion from z ≃ 2 to z = 0 without recent star formation. This problem is called the ‘size evolution problem of ETGs’.
An ETG can evolve its size without star formation if it undergoes a dry merger event (e.g. Cox et al. 2006; Ciotti, Lanzoni & Volonteri 2007; Oogi & Habe 2013, hereafter Paper I). Dry mergers can increase a galaxy's size more than wet (i.e. gas-rich) mergers because of the absence of energy dissipation via the gas component. In addition, dry minor mergers are a more efficient process for the size evolution of ETGs than dry major mergers (Bezanson et al. 2009; Naab, Johansson & Ostriker 2009; Paper I). In Paper I, we have demonstrated by N-body simulations that sequential minor mergers of compact satellite galaxies most effectively promote size growth and decrease the velocity dispersion of compact massive ETGs. The role of dry mergers for the formation of ETGs is also discussed in terms of the inner surface brightness profiles of local ETGs (Kormendy et al. 2009; Kormendy & Bender 2012).
It is interesting to study dry merger processes in the context of the ΛCDM model. In Paper I, we have analysed the Millennium Simulation Data Base (Springel et al. 2005; De Lucia & Blaizot 2007), and shown that the mass evolution of ETGs is mainly governed by dry major and minor mergers. The study of mergers in high-density environments is especially interesting because ETGs are more common in high-density environments (galaxy groups and clusters) than in low-density environments (e.g. Dressler 1980) in the local Universe. Using a semi-analytic model, Shankar et al. (2013) have reported that the size evolution of ETGs largely depends on the galactic environment. They have also predicted that size evolution in galaxies inhabiting massive haloes is strengthened by the large number of mergers (see also Paper I). We may naturally expect that many high-z compact massive ETGs evolved into the ETGs observed in present high-density environments. In such dense environments, the size evolution of ETGs may be enhanced by dry mergers. According to recent observations, major mergers have strongly influenced the mass growth of massive ETGs (López-Sanjuan et al. 2012; Ferreras et al. 2014) and the brightest cluster galaxies (Burke & Collins 2013; Lidman et al. 2013).
There are some numerical studies to investigate the effects of the merging process in high-density environments (Dubinski 1998; Rudick, Mihos & McBride 2006, 2011; Murante et al. 2007; Puchwein et al. 2010; Laporte et al. 2012); however, most of these have not focused on the size growth of compact massive ETGs. Naab et al. (2009) and Oser et al. (2012) performed cosmological hydrodynamic simulations of massive ETG formation. Both the studies showed that, in the field environments, ETGs increase sizes from z ∼ 3 to z = 0 through dry minor mergers. However, neither study explored the size growth in high-density environments.
Indeed, few numerical studies have simulated the dry merging process in high-density environments (Ruszkowski & Springel 2009; Laporte et al. 2013). Ruszkowski & Springel (2009) assumed a constant stellar to dark halo mass ratio, M*/Mhalo = 1/9, for all of their model galaxies at z = 3. This value is significantly larger than that reported in recent abundance-matching studies of the observed high-z galaxies (Behroozi, Conroy & Wechsler 2010; Guo et al. 2010; Moster et al. 2010). The authors also assumed the local stellar mass–size relation given by Shen et al. (2003). However, this assumption cannot be extended to high-z massive galaxies, which are highly compact as discussed above. Laporte et al. (2012) also pointed out the above shortcomings of the previous studies. Laporte et al. (2013) analysed nine high-resolution cosmological dark matter simulations of galaxy clusters from the Phoenix project (Gao et al. 2012). They investigated the size and mass growths of cluster galaxies by assigning star particles to the original dark matter particles on the basis of the stellar-to-halo relation obtained from the abundance-matching method. In their approach, they used a weighting scheme, and stellar systems were not separated from dark matter haloes. However, stellar systems may evolve as different collisionless systems from dark matter haloes because stars are formed in dense gas within the deep gravitational potential of dark matter haloes. In addition, Laporte et al. (2013) focused on the growth of the brightest cluster galaxies in rich clusters, whose masses exceed 5 × 10¹⁴ h−1 M⊙.
In this paper, we investigate the mass and size growth of high-z compact massive ETGs in dense environments by dry merging process. The ETGs are evolved up to the present Universe. Dry mergers of the high-z galaxies are synthesized in cosmological N-body simulations by the resimulation technique described in the next section. In our simulations, massive galaxies are grown in less massive clusters (|$10^{14} \,\mathrm{M}_{{\odot }} \lesssim M \lesssim 5\times 10^{14} \,\mathrm{M}_{{\odot }}$| at z = 0). This mass range was not covered in previous studies by Oser et al. (2012) and Laporte et al. (2013). In the dry merger scenario, the efficiency of size growth depends on the stellar-to-halo mass ratio of the galaxy. Here, we assume the stellar-to-halo mass relation derived from abundance-matching studies of high-z galaxies (Moster et al. 2010; see also Behroozi et al. 2010; Guo et al. 2010).1 We investigate the relative importance of dry major and minor mergers for the mass and size growth of compact massive ETGs in clusters. Further, we compare our numerical results of the growth with the observed stellar mass–size relations in the local Universe.
The remainder of this paper is organized as follows. In Section 2, we outline the simulations, presenting our cosmological N-body simulation, initial models and selected simulation parameters. The merger remnants of our simulations are analysed and the results presented in Section 3. In Section 4, we summarize the paper and discuss the evolutionary paths of our simulated galaxies, and compare our results with those of previous theoretical and observational studies.
2 SIMULATIONS
We investigate the mass and size evolutions of cluster galaxies similar to Dubinski (1998), Rudick et al. (2006) and Ruszkowski & Springel (2009). We simply assume that spheroidal galaxies form at the centres of dark matter haloes at z ∼ 3, the epoch of observed compact massive ETGs. The ETGs at z ∼ 3 are simulated in equilibrium N-body galaxy models with higher numerical resolution than our cosmological dark matter simulation. The stellar components of the model galaxies are assumed from the stellar-to-halo mass relations obtained via abundance matching by Moster et al. (2010). Cluster regions are simulated by the following procedure.
We perform a large-scale cosmological dark matter simulation (see Section 2.1) until z = 0.
We randomly select nine cluster-sized haloes (hereafter, called the cluster haloes) from ∼50 cluster haloes with virial masses Mvir ≃ 1014–5 × 10¹⁴ M⊙ yielded by the cosmological simulation at z = 0.
The particles within twice the virial radius of each selected cluster halo are traced back to z = 2.85.
We identify the virialized dark matter haloes with masses exceeding 1011 M⊙ at z = 2.85, and replace these haloes with our galaxy models, which have higher mass resolution (see Section 2.2).
The cluster region is resimulated until z = 0 (see Section 2.3).
This procedure is implemented for the nine randomly selected cluster regions. Steps (i)–(v) are described in more detail below.
2.1 Cosmological dark matter simulation
The cluster haloes were selected in a high-resolution cosmological simulation using the greem code (Ishiyama, Fukushige & Makino 2009; Ishiyama, Nitadori & Makino 2012). greem is a massively parallel treepm code suitable for very large cosmological N-body simulations. The cosmological parameters were based on the ΛCDM cosmological model (Ω0 = 0.3, λ0 = 0.7, h = 0.7, σ8 = 0.8, n = 1.0), which is consistent with the observational results obtained by the Planck satellite (Planck Collaboration XVI 2014). The similar parameter values were adopted in our previous simulation (Ishiyama et al. 2013, 2015). We constructed a cube with a comoving size of 171.4 Mpc and periodic boundary conditions. The cube contained 16003 particles, corresponding to a mass resolution of 5.0 × 10⁷ M⊙. The initial redshift was 83. The gravitational Plummer softening length was 2.6 kpc at z = 0. The softening was constant in the comoving coordinates from z = 83 (initial condition) to z = 4. From z = 4 to 0, it was constant in the physical coordinates. The initial particle distributions were generated by the mpgrafic package (Prunet et al. 2008), which is a parallelized variation of the grafic package (Bertschinger 2001). More than 50 cluster haloes with virial masses exceeding 1014 M⊙ were identified in the cosmological simulation at z = 0. Among these, nine were randomly selected for resimulation.
2.2 Replacement by galaxy model
In this subsection, we describe how the dry merger process is simulated in the cluster regions using galaxy models. In these simulations, the particles within twice the virial radius of each cluster halo were traced back to z = 2.85. The virialized dark matter haloes at z = 2.85 for the traced particles were identified by the friends-of-friends (FOF) algorithm (Davis et al. 1985). For the dark matter haloes with FOF halo masses exceeding 1011 M⊙, the spherical regions within the virial radius from the halo centres of mass were replaced with our galaxy model, as described below.
In this replacement, we do not take into account the haloes which are already the substructures of the larger FOF haloes at z = 2.85. Since these substructures could host galaxies, these may affect the galaxy merger rate. To investigate these effects, we counted the substructures with mass ≥1012 M⊙, which could host galaxies with mass ≳ 1010 M⊙ at z = 2.85. To do this, we use the Spline Kernel Interpolative denmax (skid2) algorithm (Gelb & Bertschinger 1994; Kereš et al. 2005; see also Section 2.4). We found that the ratio of these substructures to the total haloes we replace with our galaxy model is less than 0.5. This indicates that these substructures do not affect significantly the galaxy merger rate.
Our model galaxies consisted of two components, i.e. a stellar bulge and a dark matter halo. The mass distributions in each component were modelled by a two-component Hernquist profile (Ciotti 1996). A similar model was used in Paper I; however, different bulge mass assumptions were imposed on the galaxy model. In this paper, the bulge mass M* and the dark matter halo Mhalo were based on the stellar-to-mass relation obtained by the abundance-matching method of Moster et al. (2010), assuming that Mhalo and M* sum to Mvir.
2.2.1 Dark matter halo
The dark matter haloes were modelled by the Navarro–Frenk–White (NFW) profile obtained in cosmological simulations (Navarro, Frenk & White 1997). The concentration parameter cvir was derived using the approach of Ruszkowski & Springel (2009), which is a modified version of a toy model proposed by Bullock et al. (2001) that sets cvir = cvir(Mvir, z).
2.2.2 Stellar bulge
Finally, we ensured that the bulge and the dark matter halo were equilibrated in the total gravitational potential by the N-body method. For further details of this method, see Paper I and Kuijken & Dubinski (1994).
2.3 Resimulation
Using our galaxy models, we resimulated the cluster regions extracted from our cosmological simulation. After replacing the virialized dark matter haloes in our cosmological simulation with the higher resolution galaxy models at z = 2.85, we simulated the cluster regions from z = 2.85 to 0. In the galaxy models, the resolution of the star and dark matter particles was improved by a factor of 8 compared to that of the dark matter particles in the cosmological N-body simulation, and corresponds to a mass resolution of 6.25 × 10⁶ M⊙. The higher resolution dark matter and star particles of the galaxy models have the same mass in order to minimize differential two-body heating effects between the two components. The softening length of both the particles was 0.325 kpc. The particle mass and softening length are comparable with those of the Phoenix simulations (Gao et al. 2012; Laporte et al. 2013). The remaining dark matter particles beyond the virialized haloes were retained with a mass of 5.0 × 10⁷ M⊙, and the softening length was 0.65 kpc. These softening lengths were constant in the physical coordinates from z = 2.85 to 0. Simulations were conducted in gadget-2 code (Springel 2005), a parallelized treepm code. To mimic the tidal fields, we resimulated the Lagrangian region of the particles residing within twice the virial radius of the cluster haloes at z = 0. Vacuum boundary conditions were assumed in the Lagrangian region. To confirm that the vacuum boundary condition does not affect our main results, we modelled the dark matter distributions in cluster haloes by a cosmological simulation with periodic boundary conditions, and compared the results with our resimulated results.
As a test, we investigated the evolution of our galaxy models from z = 2.85 to 2 after the replacement. We compare them with the dark matter haloes in the dark matter-only simulations in Figs 1 and 2. We have confirmed that our galaxy models are stable and that the total density profiles do not differ significantly at r ≳ 30 kpc between our galaxy models and the dark matter haloes in the dark matter-only cases. The latter result shows that our procedure is valid in this paper.
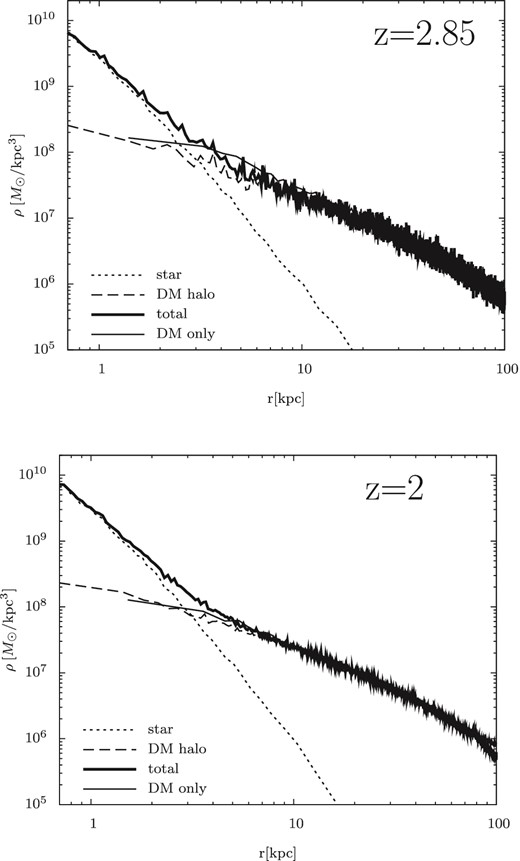
Density profiles of the central galaxy for the run H07 at z = 2 and 2.85. The thick solid lines are the density profiles of all stars and all dark matter particles. The dotted (dashed) lines denote star (dark matter) particles. The density profiles of dark matter in the dark matter-only simulation are also plotted (the thin solid lines).
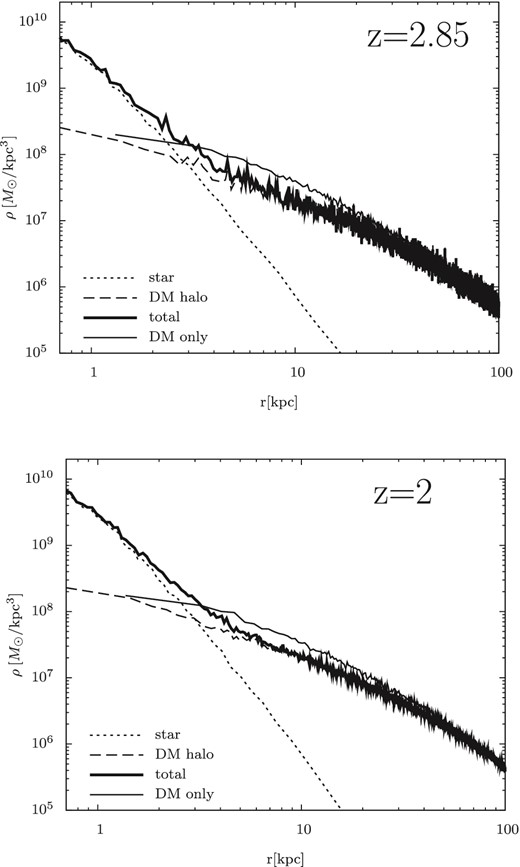
The same as Fig. 1, but for H29.
2.4 Identification of galaxies and galaxy mergers
Galaxies and their merger histories were identified from 38 simulation snapshots collected from z = 2.85 to 0. The time interval between the snapshots was ∼100 Myr at z = 2.85 and ∼500 Myr at z = 0. Galaxies were identified using the skid algorithm, which evaluates the particle number densities at each particle position, and moves each particle along the particle number density gradient until it oscillates around some positions. The particles are then linked using the FOF algorithm. Finally, in each linked group, particles with negative energy binding to the group centre of mass are retained; those that violate this criterion are removed. This procedure is applied to all star particles. Groups with more than 100 particles are defined as galaxies. As described in Paper I, galaxies are surrounded by sparse stellar particles, which may affect their half-mass radii and effective radii. Thus, imitating Paper I, the galactic stellar mass and radii were defined by imposing a truncation radius rtrunc = 60 kpc (see Paper I for details). We define the galaxy stellar mass as the stellar mass within rtrunc, which is centred at the galaxy's centre of mass. To avoid the effects of substructures on the galaxy mass and size, we get rid of the substructures in this analysis.
In constructing merger trees of galaxies, we connected a galaxy to its descendant galaxy at a later redshift through simulation snapshots. The most tightly bound particles in a galaxy were identified at a given redshift and traced to the next snapshot. The galaxy containing that particle in the next snapshot was assumed to be the descendant galaxy. If the most bound particles in multiple galaxies were found in a single descendant galaxy, the earlier galaxies were assumed to have merged into the descendant galaxy. We call the most massive galaxy in each cluster halo at z = 0 the central galaxy. When tracing the merger history of the central galaxy through earlier snapshots, the most massive progenitor at each snapshot (or redshift) was similarly called the central galaxy. Furthermore, the halo containing the central galaxy is defined as the central halo.
3 RESULTS
To investigate the effect of dry mergers on the mass and size growth of ETGs in dense environments, we resimulate nine of the generated cluster haloes. Their virial masses were Mvir ≃ 1014–5 × 10¹⁴ M⊙ at z = 0. Their masses, physical properties of their most massive galaxies at z = 0 and their most massive progenitors (hereafter called central galaxies; see Section 2.4) are summarized in Table 1. The dark matter distribution and star particles in a typical cluster halo (run H29) at z = 2.85 and 0 are presented in Fig. 3. Most of the star particles initialized at z = 2.85 reside in the central region of the cluster halo at z = 0, and are distributed along the elongation direction of the cluster halo. The stellar mass of the central galaxy is 1.96 × 10¹¹ M⊙ at z = 0. There are many dark matter subhaloes in the cluster haloes at z = 0 (Fig. 3; bottom left). While there are numerous star particles in subhaloes near the centre of the cluster halo, they are sparse in more distant subhaloes. This spatial difference in the number ratio of star particles to dark matter particles indicates that old stellar populations mainly reside in the high-density regions of galaxies. This distribution should be related to the morphology–density relation observed in the local Universe (e.g. Dressler 1980).
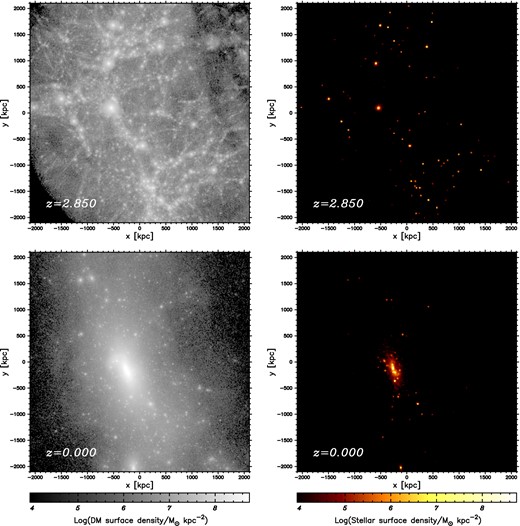
Surface density maps of the dark matter particles (left) and star particles (right) at z = 2.85 (top) and z = 0 (bottom) in run H29 (see text). The star particles reside in dark haloes with FOF halo mass MFOF ≥ 1011 M⊙ at z = 2.85 as described in the text. The box size is 4 Mpc × 4 Mpc on the physical scale. Grey-scale and colour bars indicate the surface densities of dark matter and stellar matter, respectively.
Simulated physical properties of cluster haloes at z = 0, central haloes (see text) at z = 2.85 and the central galaxies in the cluster haloes at z = 0 and 2.85 (see text). The masses and sizes of the stellar components in the central galaxies are based on rtrunc = 60 kpc. Mhalo and M* are the masses of the dark matter halo and the stellar systems of central galaxies, respectively. α is the size growth efficiency defined in the text. The ‘Avg.’ row gives the averaged values (values in parentheses are averaged without H48 and H49).
| Name | Mhalo(z = 2.85) | Mhalo | M*(z = 2.85) | M*(z = 0) | |$\frac{M_{{\ast }} (z=0)}{M_{{\ast }} (z=2)}$| | |$\frac{R_{\rm e} (z=0)}{R_{\rm e} (z=2)}$| | α |
|---|---|---|---|---|---|---|---|
| (1013 M⊙) | (1014 M⊙) | (1010 M⊙) | (1010 M⊙) | |$(R_{\rm e} \propto M_{{\ast }}^{\alpha })$| | |||
| H07 | 1.28 | 3.73 | 10.7 | 22.2 | 2.12 | 2.56 | 1.25 |
| H29 | 1.03 | 1.81 | 9.37 | 15.1 | 1.66 | 2.41 | 1.74 |
| H31 | 0.594 | 1.57 | 6.44 | 17.1 | 2.71 | 6.34 | 1.85 |
| H33 | 0.320 | 1.22 | 3.61 | 11.2 | 3.17 | 5.46 | 1.47 |
| H43 | 0.797 | 1.14 | 7.80 | 17.1 | 2.24 | 3.77 | 1.64 |
| H44 | 0.365 | 0.826 | 4.12 | 9.48 | 2.35 | 4.68 | 1.81 |
| H45 | 0.398 | 1.17 | 4.58 | 15.7 | 3.51 | 5.84 | 1.41 |
| H48 | 1.34 | 1.10 | 11.0 | 11.4 | 1.06 | 1.31 | 4.69 |
| H49 | 0.845 | 0.879 | 8.19 | 8.43 | 1.05 | 1.25 | 4.32 |
| Avg. | – | – | – | – | 2.27(2.59) | 3.98 (4.70) | 1.90 (1.63) |
To investigate whether the galaxy sizes are stable, we checked the change of the effective radius of each central galaxy from z = 2.85 to the time of the first interaction with another galaxy. We found that the satellite galaxies with stellar masses M* ≲ 4 × 10¹⁰ M⊙ increase their sizes up to ∼0.8 kpc artificially because of insufficient mass and spatial resolutions. For central galaxies, these changes are smaller than those due to mergers in all runs. Thus, in the following subsections, we focus on the evolution of the central galaxies from z = 2 to 0.
3.1 Mass and size growth of the central galaxies
Table 1 lists the mass growth factors M*(z = 0)/M*(z = 2) of the central galaxies. The diversity of the mass growth factors reflects their various merger histories. Most of the central galaxies increased their masses by a factor of 2–3 from z = 2 to 0 (the average stellar mass growth factor is 2.27), which is consistent with the observational estimates of van Dokkum et al. (2010). They selected sample galaxies with constant number density in the redshift range 0 ≲ z ≲ 2 from the NOAO/Yale NEWFIRM Medium Band Survey, and estimated the mass increase of the compact massive ETGs from z = 2 to 0. Our simulation naturally reproduces their estimated value.
Table 1 also shows the size growth factors Re(z = 0)/Re(z = 2). The average size growth factor of the central galaxies is 3.98 from z = 2 to 0, which is also consistent with the observational estimates of van Dokkum et al. (2010). This growth can be approximated as Re ∝ (1 + z)−a with a ∼ 1.26. In the observational estimates, a ranges from 0.75 (Newman et al. 2010) to 1.62 (Damjanov et al. 2011; see also Buitrago et al. 2008; Cimatti, Nipoti & Cassata 2012; Newman et al. 2012; van der Wel et al. 2014). In Paper I, we reported that changes in Re reflect the manner of the mass deposition of the accreted stars. As we will show in Section 3.3, stars accreted through the mergers are frequently, deposited in the outer regions of the central galaxies. This process ensures efficient size growth.
As discussed above, the average mass growth, size growth and size growth efficiency derived in this paper agree with observational estimations. This indicates that dry mergers sufficiently explain the size growth of compact massive ETGs. Because the mass and size growths of central galaxies widely vary, they are related to the stellar merger histories of the galaxies in the next subsection.
3.2 Stellar merger histories

Cumulative numbers of dark matter haloes as functions of their mass at z = 2.85 in each run.
Number of major mergers and the mass fractions of major and minor dry mergers in our simulated central galaxies at z = 0. Columns 2–5 list the number of merger events with mass ratios M2/M1 ≃ 1, 1/2, 1/3 and 1/4, respectively. Also listed are the mass fractions of dry major mergers with mass ratios 1/4 < M2/M1 < 1 (column 6) and of dry minor mergers with the mass ratios M2/M1 < 1/4 (column 7).
| Name | 1 | 1/2 | 1/3 | 1/4 | fmajor | fminor | |$\frac{M_{\ast }(z=2.85)}{M_{\ast }(z=0)}$| |
|---|---|---|---|---|---|---|---|
| H07 | 1 | 0 | 0 | 0 | 0.46 | 0.053 | 0.48 |
| H29 | 0 | 1 | 0 | 0 | 0.29 | 0.089 | 0.62 |
| H31 | 0 | 1 | 0 | 1 | 0.55 | 0.070 | 0.38 |
| H33 | 2 | 0 | 0 | 0 | 0.63 | 0.046 | 0.32 |
| H43 | 0 | 2 | 0 | 0 | 0.54 | 0 | 0.46 |
| H44 | 0 | 1 | 1 | 0 | 0.55 | 0.011 | 0.43 |
| H45 | 0 | 1 | 1 | 0 | 0.72 | 0 | 0.29 |
| H48 | 0 | 0 | 0 | 0 | 0 | 0.032 | 0.96 |
| H49 | 0 | 0 | 0 | 0 | 0 | 0.028 | 0.97 |
3.3 Density profiles
The time evolution of the stellar density profiles is very important for understanding the size growth of the central galaxies. The thick lines in Fig. 5 show the angle-averaged stellar density profiles of the central galaxies at z = 0 for nine runs (H07, H29, H31, H33, H43, H44, H45, H48 and H49). Three individual stellar density profiles are also plotted; the initial density profiles of the central galaxies at z = 2.85 (called in situ stars), the density profiles of stars at z = 0 that resided in the central galaxies at z = 2.85 (also called in situ stars) and the density profiles of stars at z = 0 that resided in other virialized haloes at z = 2.85 (called accreted stars).
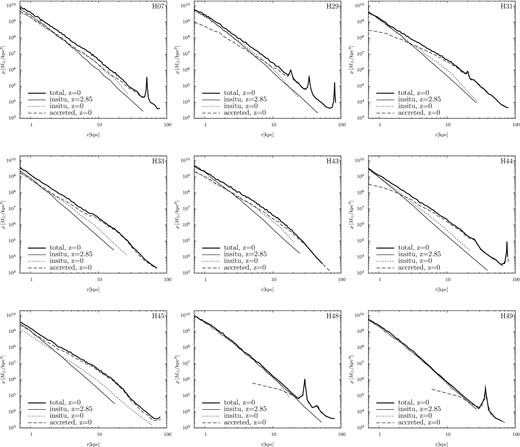
Stellar density profiles of the central galaxies at z = 0 in the cluster haloes. From top left to bottom right: runs H07, H29, H31, H33, H43, H44, H45, H48 and H49. Thick solid lines are the density profiles of all stars in the central galaxies, dotted and dashed lines denote stars originated in the most massive progenitor (in situ stars) and the less massive galaxies (accreted stars), respectively. Thin lines show the initial profiles at z = 2.85.
As shown in these figures, the stellar density profiles can be grouped into three types. In the first type, the stellar density profile shows excesses at r > 1 kpc from the progenitor stellar density profile at z = 2.85, but shows little change in the density profile at r < 1 kpc. The stellar density profiles of H29, H31, H43 and H44 are of this type. The size growth efficiencies of these runs are α = 1.71–1.89 (see Table 1). The accreted stars dominate in the excesses of the stellar density profiles at r > 1 kpc, whereas the in situ stars dominate in the inner part of the central galaxies (except for H43). The radii of the regions dominated by in situ stars range from 2 to 5 kpc, as shown in Fig. 5. These profiles well agree with the merger remnants yielded by N-body simulations of dry minor mergers (Bédorf & Portegies Zwart 2013; Hilz, Naab & Ostriker 2013; Paper I). In H43, the in situ and accreted stars make comparable contributions to the stellar density profile at z = 0 over a wide region (r < 6 kpc). This feature typifies equal-mass major merger remnants (see Appendix A). As shown in Section 3.2, the merger mass ratios of type 1 profiles are 1/4 < M2/M1 < 1/2, signifying major mergers.
In the second type, stellar density profile excesses appear at all radii from the progenitor stellar density profile. H07, H33 and H45 are of this type. The size growth efficiencies of these runs are α = 1.29–1.49 (see Table 1). The accreted and in situ stars contribute similarly to the stellar densities at r < 1 kpc, which is typical of equal-mass major merger remnants. The central galaxies in H07 and H33 experienced one or two equal-mass mergers (see Table 2). In H45, the accreted stars dominate the stellar density profile at all radii because the central galaxy experienced multiple major mergers, and the accreted stars of two companion galaxies considerably contribute to the stellar density of the remnant. Consequently, the mass fraction of major mergers is large in this case (fmajor = 0.71; Table 2).
In the third type of density profile, the accreted stars make a minor contribution, manifesting mainly as spikes in the outer galaxy profiles. The central galaxies have experienced only a few minor mergers from z = 2.85 to 0 (see Table 2). Runs H48 and H49 show type 3 density profiles. Because of the minor mergers, their size growth efficiencies (α = 2.84 and 2.78 in runs H48 and H49, respectively) are higher than those in other runs. The spikes in the outer profile represent the surviving cores of satellite galaxies. These cores might artificially elevate the growth efficiencies in our analysis. However, we have already rejected this possibility in Paper I, by evaluating the effect of such cores on the growth efficiency. Although the cluster halo masses of H48 and H49 are comparable to those of H44 and H45, their central galaxies remain compact, which also occurs in high-z ETGs. These compact galaxies resemble compact ETGs found in the local Universe (Poggianti et al. 2013). However, our compact galaxies could reflect our initial condition about the sizes of galaxies. We assume the initial galaxy sizes as the median sizes of the stellar mass–size relation of ETGs given by Newman et al. (2012). Thus, the initial galaxy sizes in our simulations are compact. However, van der Wel et al. (2014) find the intrinsic scatter in size for both early- and late-type galaxies over the redshift range 0 < z < 3. Furthermore, Muzzin et al. (2013) showed that the passive fraction is about 30 per cent at the highest mass end of the luminosity function at z = 2 (see also Section 2.2). Thus, we do not conclude that our compact ETGs at z = 0 are analogues of those observed by Poggianti et al. (2013).
These compact galaxies resemble compact ETGs found in the local Universe (Poggianti et al. 2013). However, our compact galaxies could reflect our initial condition about the sizes of galaxies. As we describe in Section 2.2, van der Wel et al. (2014) show the variation of galaxy size at high-z. Thus, we do not conclude that our compact ETGs at z = 0 are analogues of those observed by Poggianti et al. (2013).
To clarify the differences between the three types of the density profiles, we define the concentrations of in situ and accreted stars by the following equation: C = rtrunc/rhalf, where rtrunc = 60 kpc given in Section 2.4 and rhalf is the half-mass radius of in situ or accreted stars. We also define the concentration ratio, R, as follows: R = Cinsitu/Caccreted. A concentration ratio larger than the unity means that the accreted stars are more extended than the in situ stars. C and R of the central galaxies at z = 0 are summarized in Table 3. Table 3 shows that the ratios R are larger in the first type than in the second type (except H43). Our results show that the accreted stars in the first type are more extended than those in the second type and contribute to the efficient size growth. In H43, R is smaller than those in the other first type, and is comparable to those in the second type. This indicates that H43 has the property intermediate between the first type and the second type. In the third type, the ratios R are larger than those in other types. This reflects that the accreted stars in this type contribute only to the outer profile.
Half-mass radii of in situ stars and accreted stars, the concentrations, C = rtrunc/rhalf, of in situ stars and accreted stars, and concentration ratios, R = Cinsitu/Caccreted, of the central galaxies at z = 0. Here, rtrunc = 60 kpc (see text).
| Name | rhalf,insitu | rhalf,accreted | Cinsitu | Caccreted | R |
|---|---|---|---|---|---|
| (kpc) | (kpc) | ||||
| H07 | 3.61 | 4.87 | 16.6 | 12.3 | 1.35 |
| H29 | 2.13 | 9.00 | 28.1 | 6.67 | 4.21 |
| H31 | 2.35 | 13.1 | 25.5 | 4.57 | 5.58 |
| H33 | 7.64 | 6.03 | 7.85 | 9.96 | 0.788 |
| H43 | 4.03 | 7.01 | 14.9 | 8.55 | 1.74 |
| H44 | 1.78 | 9.31 | 33.7 | 6.44 | 5.23 |
| H45 | 4.49 | 8.26 | 13.3 | 7.27 | 1.83 |
| H48 | 1.85 | 25.4 | 32.4 | 2.36 | 13.7 |
| H49 | 1.61 | 25.4 | 37.2 | 2.36 | 15.8 |
3.4 Surface density profiles
The stellar surface density profiles of the central galaxies in the nine runs are shown in Fig. 6. Apart from H48 and H49, the growth of the surface densities from their progenitors increases with their radii. This growth feature is consistent with the ‘inside-out’ growth of ETG surface density profiles reported by van Dokkum et al. (2010). In their observational study, these authors determined the growth of the surface density profile of compact massive ETGs from z = 2 to 0 using the stacking technique. The accreted stars increased the surface densities in the outer regions of these galaxies, as shown in Section 3.3. Thus, we find that even major mergers lead to inside-out growth. In the galaxies of H33 and H45, the surface density increases at r ≲ 1 kpc from their progenitors. Similar increases in the inner regions have been reported in controlled simulations of dry major mergers (Paper I; Hilz et al. 2013). In H48 and H49, the evolving surface density profiles show no inside-out growth from z = 2.83, and the surface stellar densities remain within their progenitors, except for small ripple structures in the outer galaxies.
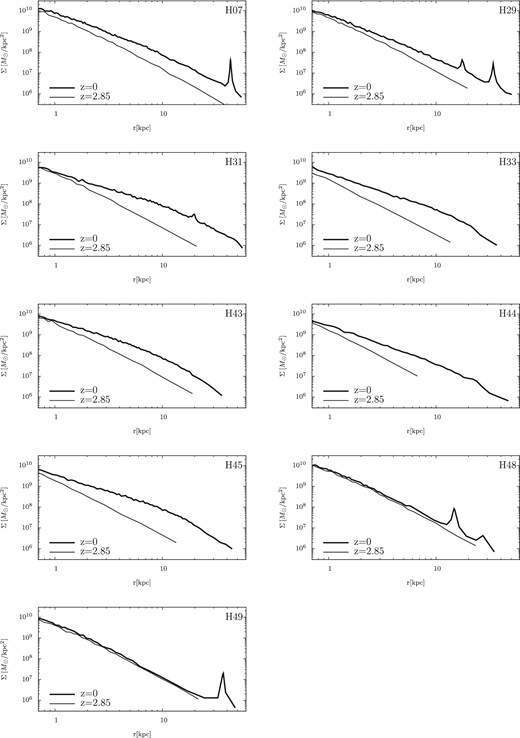
Stellar surface density profiles of the central galaxies in cluster haloes at z = 0 (thick lines). Top left to bottom right: run H07, H29, H31, H33, H43, H44, H45, H48 and H49. Thin lines show the initial surface density profiles at z = 2.85.
3.5 Stellar mass–size evolution
We now compare the stellar mass–size relations of the central galaxies at various redshifts with those observed in local ETGs. Fig. 7 plots the size versus mass of the central galaxies at z = 2, 1, 0.4 and 0, and the mean local stellar mass–size relations obtained from SDSS (Shen et al. 2003; a similar figure is shown in fig. 8 of Laporte et al. 2013). As an additional comparison, the mean stellar mass–size relations of ETGs in 2.0 < z < 2.5, reported by Newman et al. 2012, are also plotted. In our simulations, the central galaxy sizes remain almost constant before z = 2 because they experience no stellar mergers at these redshifts. At z = 1, all central galaxies remain below the locally obtained plots. At z = 0.4, four galaxies are within ±1σ of the mean local plot. We have confirmed that for most of the central galaxies the masses and sizes increase by dry major and minor mergers at z ≤ 1. The mass growth is consistent with the numerical results from Laporte et al. (2013) as well as the observational results from Liu et al. (2008, 2009), Lidman et al. (2013) and Burke & Collins (2013). At z = 0, roughly 60 per cent of the central galaxies lie within ±1σ of the mean local plot. Therefore, dry major and minor mergers are sufficient to increase the masses and sizes of the simulated compact massive ETGs to those of local ETGs. Our results agree with other numerical studies which focused the size growth of compact massive ETGs from z ∼ 2 to z = 0 at different mass ranges and using different methods (Naab et al. 2009; Oser et al. 2012; Laporte et al. 2013). The central galaxies in H48 and H49 remain far below the local plot because their merger events are too small to alter the central galaxies (see Section 3.2).
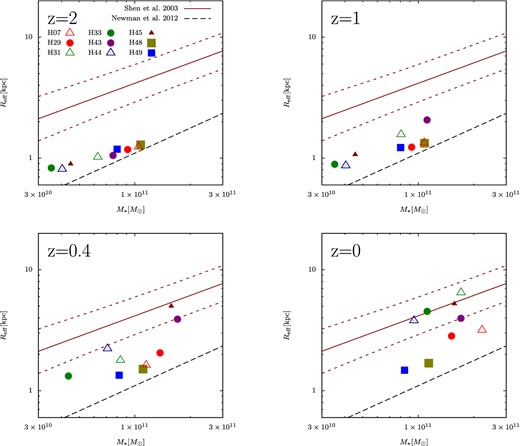
Stellar mass–size relations in our simulated cluster galaxies. We plot the most massive progenitor galaxies in our simulated cluster haloes. The central galaxies are denoted by red open triangles (H07), red filled circles (H29), green open triangles (H31), green filled circles (H33), purple filled circles (H43), blue open triangles (H44), filled brown triangles (H45), olive filled squares (H48) and blue filled squares (H49). The solid lines (mean) and brown dotted lines (±1σ of the mean) are the stellar mass–size relations of the local ETGs derived from SDSS (Shen et al. 2003). The black dotted lines are the mean stellar mass–size relations of ETGs at 2.0 < z < 2.5 (Newman et al. 2012). Top left to bottom right: z = 2, 1, 0.4 and 0.
Fig. 8 plots the redshift evolution of the central galaxy sizes. For comparison with the observations of Cimatti et al. (2012), we plot the mass-normalized effective radius Reff/M0.55 versus the redshift. Excluding H48 and H49, the average size of the central galaxies evolves as Reff/M0.55 ∝ (1 + z)−1.09. The trend of the average size evolution is similar to that of Cimatti et al. (2012). Our sample is, however, too scarce to compare our result with the Cimatti et al. (2012) quantitatively, which exploited a large sample of 1975 ETGs at 0.2 < z < 3 for their analysis.
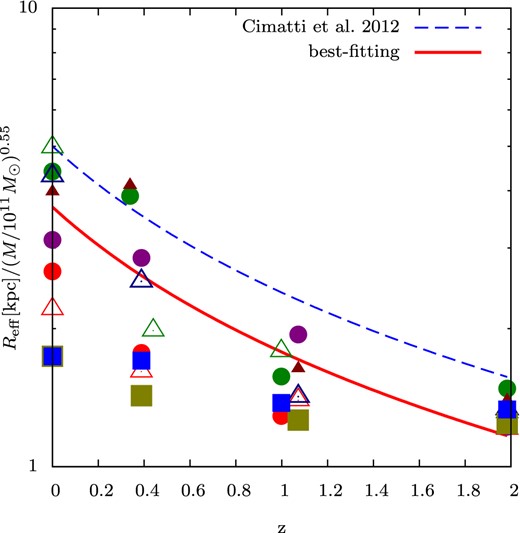
Size evolution of our simulated galaxies as a function of redshift. The vertical axis shows the mass-normalized effective radius, Reff/M0.55. The blue dashed line is the observational result of Cimatti et al. (2012), approximated as Reff/M0.55 ∝ (1 + z)−1.06. The red solid line is the average size evolution of the central galaxies in our numerical results, approximated as Reff/M0.55 ∝ (1 + z)−1.09. In this analysis, H48 and H49 are excluded because their galaxies remain roughly compact from z = 2.85. The coloured symbols are explained in the caption to Fig. 7.
3.6 Stellar-to-halo mass relation
Finally, we compare the simulated and observationally inferred stellar-to-halo mass relations in galaxies at z = 0. Fig. 9 shows our simulated results and the stellar-to-halo mass relations obtained by abundance matching at z = 0 by Moster et al. (2010), Moster et al. (2013), Behroozi et al. (2013) and Reddick et al. (2013). The inferred mass ratios of stellar to dark matter components are lower in massive dark matter haloes than in less massive ones (Behroozi et al. 2010; Guo et al. 2010; Moster et al. 2010). Our simulations qualitatively replicate these results. In contrast, cosmological hydrodynamic simulations overproduce stars in cluster-sized haloes by overcooling their gas content (Lackner et al. 2012; Dubois et al. 2013; Ragone-Figueroa et al. 2013). Our present model simulates stellar and dark matter components but excludes star formation. Essentially, we simulate star formation quenching in all dark matter haloes at z = 2.85. All our simulated galaxies are roughly consistent with Behroozi et al. (2013) and Reddick et al. (2013), although they lie at ∼0.2–0.4 dex below the average stellar-to-halo mass relation at z = 0 reported by Moster et al. (2010, 2013).
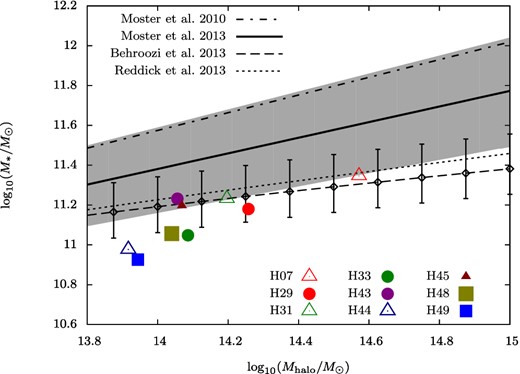
Stellar-to-halo mass relations of the central galaxies at z = 0. The dash–dotted line was obtained by the abundance-matching method, performed at z = 0 by Moster et al. (2010). The thick solid, dashed and dotted lines are the results of Moster et al. (2013), Behroozi et al. (2013) and Reddick et al. (2013), respectively. The dark grey area and the error bars represent the plausibility range and the 1σ scatter bars around the relation of Moster et al. (2013) and Behroozi et al. (2013). The coloured symbols are explained in the caption to Fig. 7.
4 SUMMARY AND DISCUSSION
Using a resimulation technique, we demonstrated that central galaxies in cluster haloes of masses 1–5 × 10¹⁴ M⊙ double their average mass and quadruple their size from z = 2 to 0 by dry mergers. The simulated growths favourably agree with van Dokkum et al. (2010), who conducted a stacking analysis of the observational data, and Shankar et al. (2015), who performed a detailed comparison between their semi-empirical model and observational data. By simulating galaxy merger processes in high-density environments, we showed that major mergers are important contributors to the mass growth of the central galaxies of 1–5 × 10¹⁴ M⊙ cluster haloes (see Table 2). The central galaxies (except H48 and H49) experienced one or two dry major mergers because the number density of the massive galaxies exceed the Universe mean under such environments. Our result also agrees with the previous studies which investigated the size growth of compact massive ETGs at the different halo mass ranges (Naab et al. 2009; Oser et al. 2012; Laporte et al. 2013), and confirms the evolution of ETGs driven by dry major and minor mergers.
The stellar density and surface density profiles of our simulated central galaxies exhibited inside-out growth from z = 2.85 to 0. This inside-out growth is consistent with the observational analysis of van Dokkum et al. (2010). The exceptions were runs H48 and H49, in which the central galaxies were as compact and massive as their progenitors at z = 2.85 and experienced only a few minor merger events.
According to our numerical results, the central galaxies in dark matter haloes satisfying |$5\times 10^{14} \,\mathrm{M}_{{\odot }}\gtrsim M_{\mathrm{halo}} \gtrsim 10^{14} \,\mathrm{M}_{{\odot }}$| are potential descendants of high-z (z ∼ 2–3) compact massive ETGs, as argued by the other studies at the different mass ranges (Naab et al. 2009; Oser et al. 2012; Laporte et al. 2013). The relationship between the stellar mass of the central galaxies and the mass of the cluster haloes at z = 0 roughly agrees with the observational results of Behroozi et al. (2013) and Reddick et al. (2013).
In most of our simulated central galaxies at z = 0, the mass–size relation is similar to that of local ETGs reported by Shen et al. (2003). Moreover, the redshift evolution of the average mass-normalized size of the central galaxies approximates the observations of Cimatti et al. (2012), although two of the central galaxies remain compact in our simulations.
Our result agrees with the other observational studies. López-Sanjuan et al. (2012) analysed massive ETGs in the COSMOS field, and showed that nearly half of the galaxies with stellar masses exceeding 1011 M⊙ acquired their extra mass through major mergers (M2/M1 ≥ 1/4 at z ≲ 1). Ferreras et al. (2014) formed a similar conclusion from the SHARDS survey. The importance of major mergers has also been highlighted in the brightest cluster galaxies (Liu et al. 2008, 2009; Burke & Collins 2013; Lidman et al. 2013). Together with our results, these observations show that major mergers are important contributors to the mass growth of massive galaxies.
Recently, Laporte & White (2015) performed N-body simulations which explicitly followed the evolution of both stars and dark matter in clusters. They showed that the evolution of their brightest cluster galaxies did not differ appreciably from those found in the simulations which are used the weighting scheme. This last study notwithstanding, it is worth investigating the mass and size growth using the resimulation technique which we have performed.
We note that our simulations have a number of limitations. For initial structures of the galaxies, we assume that all galaxies are compact and follow the stellar mass–size relation of ETGs at 2.0 < z < 2.5 obtained by Newman et al. (2012). However, van der Wel et al. (2014) show the intrinsic scatter in size in a given mass range and not all z ∼ 2 galaxies are compact. In addition, Muzzin et al. (2013) showed that the passive fraction is about 30 per cent for massive galaxies. Thus, our initial condition could be too simplistic to represent high-z galaxies. We should consider the structural variation of progenitor galaxies in future studies. Furthermore, in our simulations, we ignored additional star formation. However, this could contribute to mass growth from z = 3 to 0 (e.g. Ownsworth et al. 2014). Therefore, we should incorporate star formation as an extension of our present galaxy formation approach.
We are grateful to the referee for providing constructive comments that improved the paper. We thank Volker Springel for making gadget-2 publicly available. We thank Takashi Okamoto and Masahiro Nagashima for their fruitful discussions and comments. Numerical computations were partially carried out on Aterui and Cray XT4 supercomputers at Center for Computational Astrophysics, CfCA, of National Astronomical Observatory of Japan, and the K computer at the RIKEN Advanced Institute for Computational Science (Proposal numbers hp120286). This work is partly supported by grant-in-aid for COE Research (20001003) of Japan Society for the Promotion of Science (to AH). This study has been funded by MEXT/JSPS KAKENHI grant no. 25287041. TI has been funded by MEXT HPCI Strategic Program, MEXT/JSPS KAKENHI grant nos. 24740115 and 15K12031.
More recently, Moster, Naab & White (2013) and Behroozi, Wechsler & Conroy (2013) also derive the stellar-to-mass relations, respectively. At z ∼ 3, the stellar masses in haloes with 1013 M⊙ in all studies show agreement with each other, that is M* ∼ 1011 M⊙. On the other hand, at low halo mass end (Mhalo ∼ 1011 M⊙), the results of Moster et al. (2013) and Behroozi et al. (2013) predict larger stellar mass than that of Moster et al. (2010), which we adopted in this paper. However, the relation of Moster et al. (2010) is within the plausibility range of Moster et al. (2013). Thus, our assumption for initial stellar masses is consistent with those papers.
REFERENCES
APPENDIX A: DENSITY PROFILES OF THE MERGER REMNANT OF AN equal-mass DRY MAJOR MERGER
Fig. A1 shows the stellar density profiles of the merger remnant of an equal-mass dry major merger (run 2A in Paper I). In Paper I, the major merger was assumed as a parabolic, head-on encounter of two equal-mass galaxies (i.e. a mass ratio of 1:1). Moreover, the galaxies were assumed to be stellar bulges with dark matter haloes. The initial model and the simulation parameters are detailed in Paper I. From Fig. A1, we observe that the stars in both progenitor galaxies (approximately) equally contribute to the stellar density of the remnant at all radii. In other words, both progenitors make almost equal contributions to the remnant profile. This behaviour significantly differs from that of dry minor mergers (see Paper I), especially in the inner region (r < 1 kpc). The mass–size growth in Fig. A1 is given by |$R_{\rm e}\propto M_{\ast } ^{\alpha }$|, where α ∼ 1.6 (Paper I).
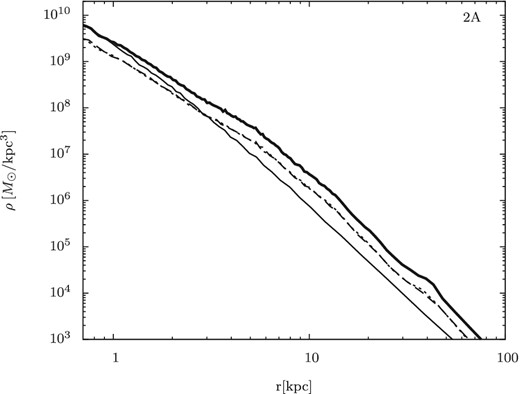
Stellar density profiles of the remnant stellar system of a dry major merger (run 2A in Paper I). As in Fig. 5, the thick (thin) line is the density profile of all stars in the merger remnant (the initial galaxy model). The dotted and dashed lines denote the stars belonging to the two progenitor galaxies involved in the merger.
