-
PDF
- Split View
-
Views
-
Cite
Cite
Maxim Lyutikov, Serguei S. Komissarov, Oliver Porth, The inner knot of the Crab nebula, Monthly Notices of the Royal Astronomical Society, Volume 456, Issue 1, 11 February 2016, Pages 286–299, https://doi.org/10.1093/mnras/stv2570
Close - Share Icon Share
Abstract
We model the inner knot of the Crab nebula as a synchrotron emission coming from the non-spherical MHD termination shock of relativistic pulsar wind. The post-shock flow is mildly relativistic; as a result the Doppler beaming has a strong impact on the shock appearance. The model can reproduce the knot location, size, elongation, brightness distribution, luminosity and polarization provided the effective magnetization of the section of the pulsar wind producing the knot is low, σ ≤ 1. In the striped wind model, this implies that the striped zone is rather wide, with the magnetic inclination angle of the Crab pulsar ≥45°; this agrees with the previous model-dependent estimate based on the gamma-ray emission of the pulsar. We conclude that the tiny knot is indeed a bright spot on the surface of a quasi-stationary magnetic relativistic shock and that this shock is a site of efficient particle acceleration. On the other hand, the deduced low magnetization of the knot plasma implies that this is an unlikely site for the Crab's gamma-ray flares, if they are related to the fast relativistic magnetic reconnection events.
1 INTRODUCTION
The Crab pulsar and its pulsar wind nebula (PWN) remain prime targets for high-energy astrophysical research. In many ways, the current models of active galactic nuclei and gamma-ray bursts are based on what we have learned from the studies of the Crab. The recent detection of flares from the Crab nebula by AGILE and Fermi satellites (Abdo et al. 2011; Tavani et al. 2011) have brought this object into the ‘focal point’ once again. Their extreme properties seem impossible to explain within the standard theories of non-thermal particle acceleration and require their overhaul with important implications to high-energy astrophysics in general (e.g. Lyutikov 2010; Clausen-Brown & Lyutikov 2012; Cerutti, Uzdensky & Begelman 2012; Lyubarsky 2012; Bühler & Blandford 2014).
In the MHD models of the Crab nebula, the superfast magnetosonic relativistic wind of the Crab pulsar terminates at a reverse shock (Rees & Gunn 1974; Kennel & Coroniti 1984). However, finding the shock in the images of the Crab nebula has not been a straight-forward matter – there seem to be no sharp feature which can be undoubtedly identified with the shock surface. In their seminal paper, Kennel & Coroniti (1984) discuss the underluminous region hosting the Crab pulsar and surrounded by the optical wisps as an indicator of the shock presence. After the discovery of the inner X-ray ring by Chandra (Weisskopf et al. 2000; Hester et al. 2002), the ring is often referred to as the termination shock and yet this feature looks much more like a collection of knots than a smooth surface. A new twist in the story has come with the recent PIC simulations which show the shock particle acceleration is highly inefficient in even relatively weakly magnetized relativistic plasma (Sironi & Spitkovsky 2009, 2011a). These results make one doubt that the shock can be visible at all. On the other hand, the wind from an oblique rotator should have the so-called striped zone where the orientation of magnetic field alternated on the scale of the pulsar period. The magnetic energy associated with these stripes can be dissipated at the termination shock and converted into the energy of the wind particles (Lyubarsky 2003; Sironi & Spitkovsky 2011b; Amano & Kirk 2013; Pétri & Lyubarsky 2007).
Given the highly anisotropic nature of the wind, the termination shock is squashed along the polar direction and can be highly oblique with respect to the upstream flow (Lyubarsky 2002). Downstream of the shock, the flow can still be relativistic and its emission subject to strong Doppler beaming. The computer simulations of the Crab nebula and its radiation (Komissarov & Lyubarsky 2004) revealed the presence of a very bright compact feature in the synthetic synchrotron maps, highly reminiscent of the HST knot 1 of the Crab nebula located very close to the pulsar (also called the inner knot, Hester et al. 1995). (In these simulations, the termination shock was treated as source of synchrotron electrons with power-law energy spectrum, which then were carried out into the nebula by the shocked wind plasma.) This feature, confirmed in the later more advanced 2D (Camus et al. 2009) and 3D (Porth, Komissarov & Keppens 2014) simulations, is associated with the location at the termination shock where the shocked plasma flows in the direction of the fiducial observer and thus strongly Doppler-boosted. Komissarov & Lyutikov (2011) argued that given the short synchrotron lifetime of the high-energy electrons compared to the dynamical time-scale of the shock, the knot can be the main source of the gamma-ray emission from the nebula at 10–100 MeV.
Recently, a targeted multiwavelength study of the Crab's inner knot has been conducted by Rudy et al. (2015) in order to check if it shows any activity correlated with the gamma-ray flares. Although no such correlation has been found, the optical data reveal the structure and temporal evolution of the knot with unprecedented detail. In this paper, we investigate if the data are consistent with the MHD-shock model of the knot using simple analytical and semi-analytical tools. In particular, we combine the theoretical shape of the shock with the oblique shock jumps in order to obtain the Doppler beaming of the post shock emission and use this to determine the location, the shape and the brightness distribution of the knot.
2 GEOMETRY OF THE TERMINATION SHOCK
At the location of the termination shock, the magnetic field of the pulsar wind has the form of loops centred on the pulsar's rotational axis. The wind's termination shock is also symmetric with respect to the rotational axis and hence the magnetic field is parallel to the shock surface. The pulsar wind is not spherical – its luminosity per unit solid angle increases with the polar angle measured from the pulsar rotational axis. As a result, the termination shock is not spherical and the radial stream lines of the wind are generally not normal to the shock surface – locally the shock is oblique. In addition, the pulsar wind is ultrarelativistic and its thermal pressure is negligibly small. The corresponding shock equations have been analysed in Komissarov & Lyutikov (2011), Lyutikov, Balsara & Matthews (2012); see also Appendix A. Here we summarize their results using the notation introduced in Komissarov & Lyutikov (2011).
Since the shock is driven into the wind by the pressure inside the nebula, pn, which is approximately uniform in the nebula due to its slow expansion, we replace |$\tilde{p}_2$| with constant pn, which makes our approach similar to the Kompaneets approximation (Kompaneets 1960). This approximation was already used by Lyubarsky (2002), to determine the shape of the termination shock for a weakly magnetized wind. It less clear if the approximation can hold well for the polar section of the shock where the magnetization and the Lorentz factor of the post-shock flow can be very high. This makes terms other than the total pressure potentially important in the transverse force balance. This is already seen in the numerical simulations with moderate wind magnetization, where the magnetic hoop stress leads to compression of the polar region (Porth et al. 2014). Moreover, these simulations show that the polar flow is highly variable. Keeping these in mind, we shell still shell proceed exploring the models based on the assumption |$\tilde{p}_2=p_n=$| const.
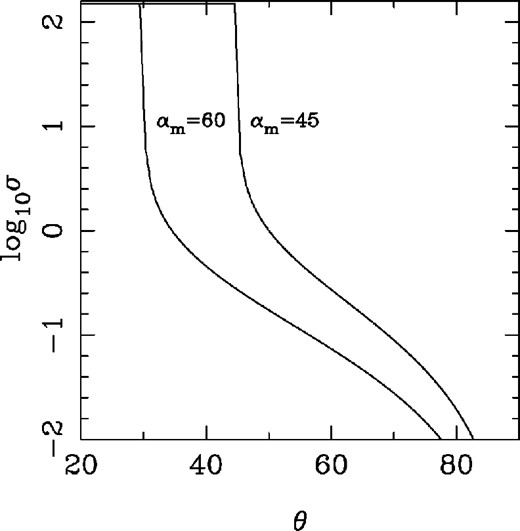
Magnetization of the striped wind zone after the dissipation of stripes for the magnetic inclination angles αm = 60° and 45°.
As a start, we consider the case of uniform σ1, where it does not depend on the polar angle. This corresponds to the case of aligned rotator, α = 0, where σ1 = σ0 everywhere. The top panel of Fig. 2 shows the solutions for σ1 = 0, 1 and 10. As one can see, for higher σ1 the shock is located closer to the pulsar. This is in agreement with the earlier results by Kennel & Coroniti (1984). In fact, the curves differ only by the scaling factor |$\sqrt{1-\chi (\sigma _1)}$|, as follows from equation (15).
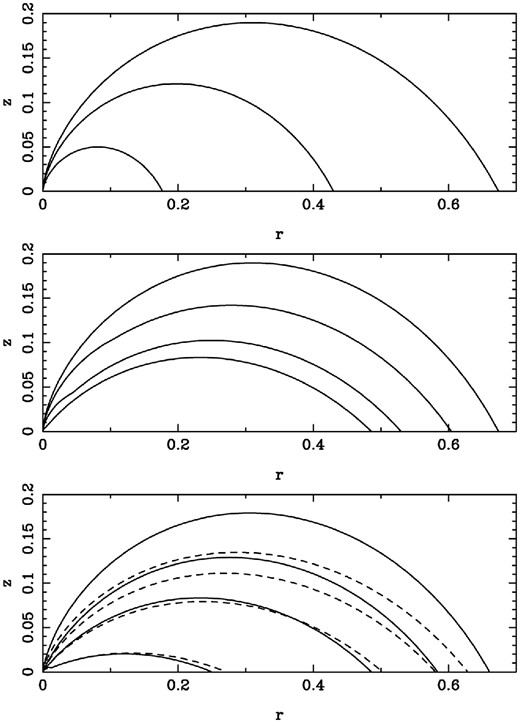
Top panel: shape of the termination shock for a uniform distribution of σ1. The curves correspond to σ1 = 0, 1 and 10, from top to bottom. Middle panel: shape of the termination shock for the non-uniform distribution of σ1 corresponding to a striped wind with α = π/4 and f(θ) = sin 2θ. The lines correspond to σ0 = 0, 1, 10 and 103, from top to bottom. Bottom panel: shape of the termination shock for the non-uniform distribution of σ1 corresponding to a striped wind σ0 = 103 and f(θ) = sin nθ. The lines correspond to α = 80°, 60°, 45° and 20°, from top to bottom. The solid lines correspond to n = 2 and the dashed lines to n = 4.
Fig. 3 zooms into the inner region of the middle panel of Fig. 2, where the shock exhibits a noticeable break. The origin of this break is easy to understand. At θ < θm, the magnetization σ1 = σ0 is constant. Hence, the shock curve is a miniature version of that of pure hydro shock (see equations 11 and 12). At θ = θm, σ1(θ) rapidly drops leading to higher wind ‘ram’ pressure and the shock shoots out almost radially until the ‘ram’ pressure approaches that of the nebula. This interpretation suggests that for high σ0, the shape of the equatorial part of the termination shock is independent on that in highly magnetized polar section.
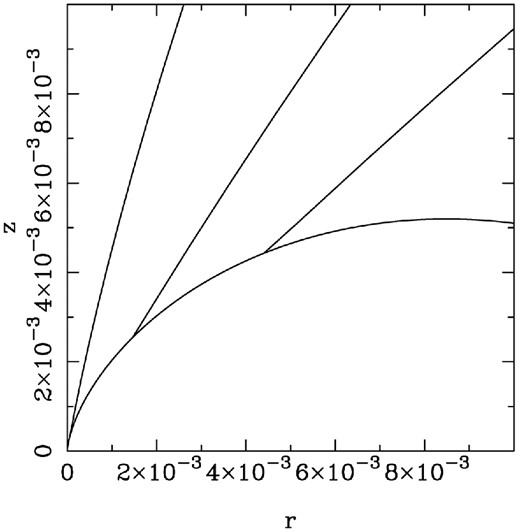
Shape of the termination shock near the origin. The solutions correspond to the model with σ0 = 103 and f(θ) = sin 2θ. As in the middle panel of Fig. 2, the magnetic inclination angle α = 80°, 60°, 45° and 20°, from top to bottom.
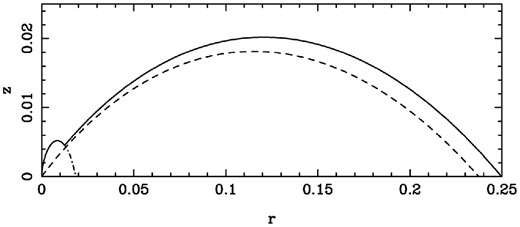
Shape of the termination shock for σ0 = 103 and f(θ) = sin 2θ and α = 20°. The solid line shows the original solution and the dashed one the approximate one for the truncated wind and the dash–dotted one the solution corresponding to σ1 = σ0.
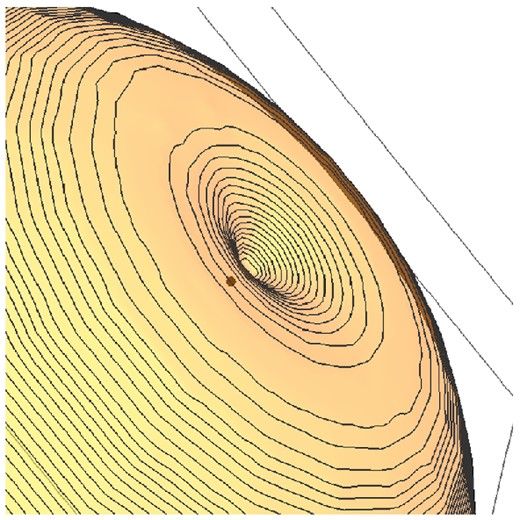
View of the polar region of the termination shock for f(θ) = sin 2θ and the viewing angle θob = 60°; the pulsar position is shown by the dot.
3 ESTIMATES OF BASIC PARAMETERS
As the shocked plasma expands and slows down, its observed emissivity drops. Fig. 6, based the results of 3D RMHD simulations by Porth et al. (2014), illustrates this behaviour. One can see a relatively thin layer of enhanced emissivity just above the shock surface. Its thickness is approximately one-third of its distance from the line connecting the origin (pulsar) and the observer. The main reason for the drop of the emissivity with the distance from the shock is the reduction of the Doppler beaming.
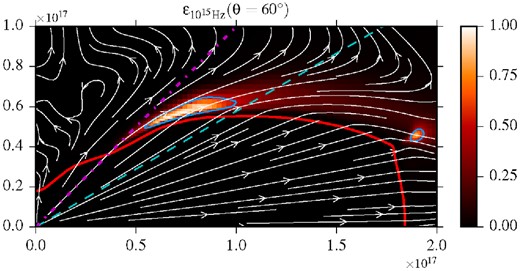
The observed optical emissivity of the post-shock flow in the 3D RMHD simulations of Porth et al. (2014). The arrowed lines are the instantaneous stream lines. The dashed line is the line of view and the blue curves show the regions of enhanced observed emissivity.
Komissarov & Lyutikov (2011) estimated some of the the knot parameters in the shock model, assuming that they are determined by the Doppler boosting of the emission from the shocked plasma. In their calculations, they assumed that the velocity of the plasma is parallel to the shock surface. Here, we do a more careful and extended analysis.
3.1 Low σ at the knot location
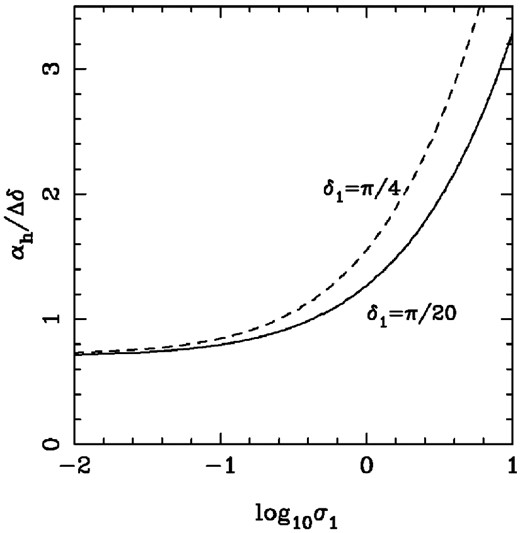
Since σ1 is expected to be low only in the striped-wind zone, this allows us to conclude that the magnetic inclination angle α > 90° − θob ≈ 30°, where θob ≈ 60° the observed angle between the line of sight and the rotational axis of the Crab pulsar (Ng & Romani 2004). Based on this result we focus in the rest of the paper on the case of low σ1.
3.2 Separation from the pulsar
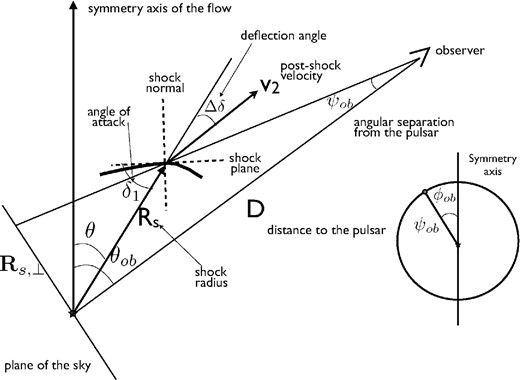
Geometry of the shock in the plane defined by the location of an observer, the pulsar and a point on the shock surface.
3.3 Transverse size
4 SYNTHETIC IMAGES
In this section we construct two-dimensional ‘images of the knot’. Obviously, in order to obtain the brightness distribution we need to integrate the emissivity along the line of sight. However, from the shock geometry, we can only conclude how it is distributed over the shock surface. Therefore, in this section we start by constructing images of this surface and later study the effects of finite thickness of the emitting layer. We expect a longer geometrical length of the emitting region along the line tangent to the shock surface. This factor would make the knot more compact along the symmetry axis in the image. On the other hand, the finite thickness of the emitting layer would tend to increase the knot size in this direction.
For all images presented in the paper we use θob = π/3.
4.1 Emissivity maps
As an illustration, Fig. 9 shows the results for the shock shape described by equation (21) with n = 2 and constant magnetization parameter σ1 = 0, 1, 10. One can see that only in the case σ1 = 0 there is a clear separation between the knot and the pulsar, in full agreement with the results of Section 3. The plots also confirm the conclusion of Section 3, that high σ1 models result in radially elongated elongated images, which is in conflict with the observations.

Synthetic emission maps of the knot for σ1 = 0, 1, 10 (from left to right) and f(θ) = sin 2θ. In all cases, the distances are in arcsec, the pulsar is located at the origin and the emission peak is at 0.7 arcsec from the pulsar. The peak emissivity is normalized to unity and the third contour corresponds to one half of the peak value. For high σ ≥ 1 the inner knot is both very broad and elongated in radial direction, which is inconsistent with the observations. The contours start from 0.9 of the peak value and decrease by the factor of |$\sqrt{2}$| thereafter.
In Fig. 10, we compare the results for n = 2 and n = 4. One can see that the difference between the model is not dramatic – in the n = 4 model, the knot is a little bit more tangentially elongated. The proper shock emissivity may reduce with the distance from the pulsar reflecting the reduced wind power. To probe the importance of this factor, we also considered the model where the shock emissivity scales as R−2ϵgeom – the results are shown in the right-hand panel of Fig. 10. One can see that the knot becomes significantly more compact and less elongated in the radial direction. This image is closer to those of the Crab's inner knot, which is approximately 2:1 in size (tangential over radial), while its separation from the pulsar, ∼0.65 arcsec is much larger than it's radial width (0.15 arcsec in the HST image and somewhat larger, 0.35 arcsec in the Keck image), (Rudy et al. 2015).

Sensitivity of the synthetic images to the shock model. Left-hand panel: shock shape f(θ) = sin 2θ and uniform proper emissivity; center panel: shock shape f(θ) = sin 4θ and uniform proper emissivity; right-hand panel: shock shape f(θ) = sin 2θ and proper emissivity scaling with the spherical radius as ∝ R−2. In all the cases σ1 = 0. The contours start from 0.9 of the peak value and decrease by the factor of |$\sqrt{2}$| thereafter.
Finally, we have also explored the case of the shock shape of striped wind described by equation (14), with σ1 varying according to equation (17). In all models described here, the shock emissivity is ϵ = R−2ϵgeom.
For large magnetic inclination angle α > θob, the shock shape is very similar to the our ‘standard’ one. Moreover, σ1 ≪ 1 and hence the images are not much different from those shown in Fig. 10. For small magnetic inclination angle α < θob the knot emission comes from the inner lobe of the shock, where the shock shape is exactly the same as the standard one. However, σ1 is very high now, leading to images which are in stark conflict with the observations (like the one in the left-hand panel of Fig. 9).
The most interesting is the case with α ≈ θob, where the knot emission comes from the transitional section of the shock where σ1 varies rapidly and the shock surface is closely aligned with the line of sight (see Fig. 11). In Fig. 12 we show the results for α = π/3 and π/4. One can see that for α = π/3, a the images can show a very high degree of elongation in the transverse direction. However, for α = π/4, this elongation is no longer seen. The results confirm our expectation that the differences between standard shock shape (equation 15) and that of the striped wind (21) are not dramatic and the conclusions based on the models with standard shape are quite robust.
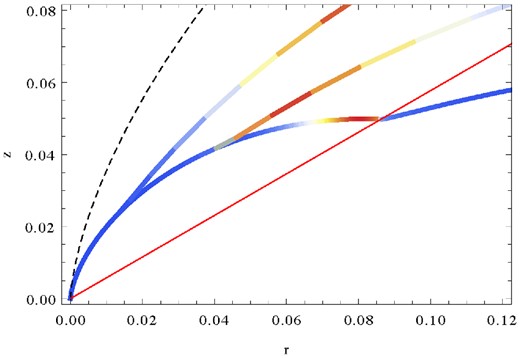
Shock contour for obliqueness of π/3, π/4, π/6 (top to bottom) for wind magnetization of σ0 = 10 and f(θ) = sin 2θ. The hydro shock solution is indicated dashed black. The shock-contours are colored with the Doppler factor cubed. Red contour describes the los to the Pulsar for the assumed inclination angle θob = 60°. Right-hand panel is a zoom-in. One can see the double-humped structure of the termination shock, leading to a emission closely aligned with the line of sight in the case of α = π/4.
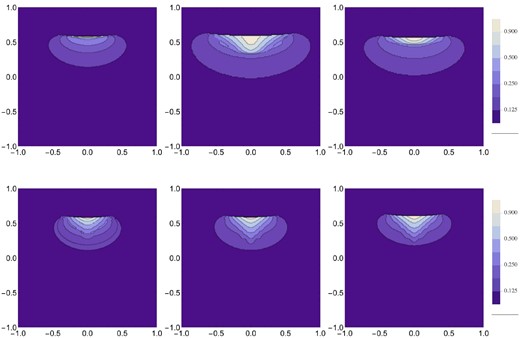
Emissivity maps for the striped-wind shock shape. Top row: α = π/4. Bottom row: α = π/3. Left column: σ0 = 10, n = 2; riddle column: σ0 = 100, n = 2; right column: σ0 = 10, n = 4. The contours start from 0.9 of the peak value and decrease by the factor of |$\sqrt{2}$| thereafter.
Rudy et al. (2015) also pointed out that the Crab's knot could be a bit convex away from the pulsar (the ‘smily face’). In the synthetic synchrotron maps presented in this section, the distant side of the knot has a sharp edge slightly convex the other way. This feature reflects the curvature of the folding edge of the shock surface projection on to the plane of the sky. However, in the images based on the RMHD numerical simulations of PWN the edge curvature is washed away (Porth et al. 2014). In these simulations, the emission comes from a layer of finite thickness downstream of the termination shock (see Fig. 6). As we show next, this can be an important factor in determining the detailed shape of the knot.
4.2 Brightness distribution
In Fig. 13 illustrates the results obtained for the shock shape parameter n = 2 with σ1 = 0. As one can see, the ‘frown’ turns into a ‘smile’ already for ϵr = 0.1. At this point, the emissivity is still a sharp layer attached to the shock. Notwithstanding the ad hoc nature of this simple model, the results indicate that the shape of the knot is very sensitive to the downstream flow. We hence suggest that a modelling of the knot's shape must take into account the flow in the post-shock layer.
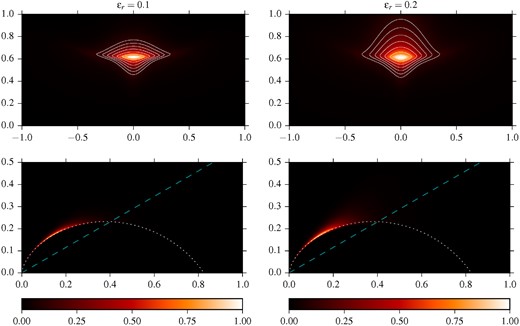
Knot images resulting from emitting region of finite thickness (top) and corresponding emissivity distributions (bottom). The dashed line shows the line of sight and the white dotted line traces the assumed shape of the termination shock. The contours start from 0.9 of the peak brightness and decrease by the factor of |$\sqrt{2}$| thereafter.
5 POLARIZATION
Given the velocity field and the assumed magnetic structure of the flow (azimuthal) we can also calculate the polarization signature. In order to do this properly, the relativistic aberration of light has to be taken into account Lyutikov et al. (2003). In our case, the calculations are slightly different due to the different geometry of the problem. The details can be found in Appendix B.
We start with the case where emission come only from the shock surface. Fig. 14 shows the degree of polarization for the total flux coming from the shock with n = 2 and proper emissivity scaling as R−2. (the results for n = 4θ look very similar.) One can see that for 0 < σ1 < 1 the degree of polarization varies only slightly. For the observed value of p = 2.6, we obtain Π ≈ 50 per cent. For magnetization σ1 ≥ 1, the polarization signal nearly coincides with that for a spherical shock (Lyutikov et al. 2003) – in this case the flow deflection angle Δδ is small and its speed is highly relativistic.
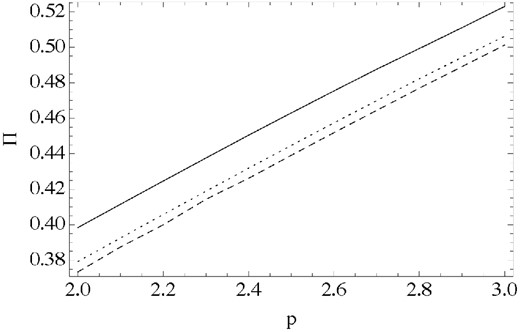
Polarization of the shock integral emission in the case of zero thickness as a function of the particle spectral index p. Solid curves correspond to the integration over the whole shock surface for models with σ1 = 1, 0.1, 0 (top to bottom) and constant rest-frame emissivity. The dashed line shows the result for spherical surface obtained in Lyutikov et al. (2003).
Thus, our model predicts high polarization of the knot emission in agreement the observations, but the predicted value is still somewhat lower than the observed one of Π ∼ 60 per cent (Moran et al. 2013). In order to understand the reason, we carried out additional polarization calculations.
To check if the finite thickness of the emitting layer can effect the polarization, we carried out calculations with the same volume emissivity model as in Section 4.2. The results are presented in Fig. 15, which shows that the degree of polarization remains largely unchanged – the changes are quite small – when the thickness is increased from 10 to 50 per cent of the local shock radius, the polarization increases by merely 2 per cent. This leads us to conclude that a finite extent of the emitting region alone is unlikely to explain the high observed degree of polarization.
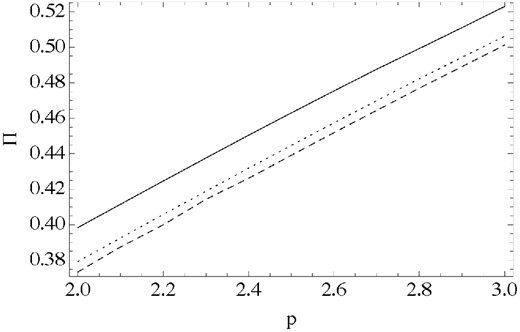
Polarization fraction in the model with finite width of the emitting layer (σ1 = 0). The width is scaled with the local shock radius: 10 per cent – dashed, 20 per cent – dotted and 50 per cent solid. Even for a unrealistically wide emitting region of 50 per cent, the observed polarization degree of ∼60 per cent still cannot be reproduced.
In the observations of Moran et al. (2013), the knot polarization was measured in a very localized area with an aperture radius of 0.15 arcsec. However according to the data by Rudy et al. (2015), the transverse FWHM size of the knot is ≈0.32 arcsec and FWRMS size is ≈0.56 arcsec and hence the aperture used in Moran et al. (2013) captures only the bright inner part of the knot. This can be significant because the depolarization of total flux in our calculations is caused by the gradual rotation of the polarization vector across the knot, which is illustrated in Fig. 16. Thus, a smaller area of integration would give a higher polarization degree.

Image of the knot (σ1 = 0) and its polarization vectors (E-field) for f(θ) = sin 2θ, (left) and f(θ) = sin 4θ, (right). At each location the polarization degree corresponds to the theoretical maximum for the synchrotron emission. The rotation of polarization vectors across the image results in depolarization of the integral emission. The contours start from 0.9 of the peak value and decrease by the factor of |$\sqrt{2}$| thereafter.
In order to investigate this effect we carried out additional calculations where the integration over the azimuthal angle was limited to the interval (−ϕb, +ϕb). To determine a reasonable range for ϕb, we recall that the knot emissivity decreases by the factor of two from its peak value for streamlines making angle αh ≈ 0.33/Γ2 ≈ 0.14 to the one leading to the peak (see Section 3.3).
In Fig. 17, we show the results of integration for ϕb = 0.1, 0.25 and 0.5. One can see that for all these value the polarization is significantly higher compared to what we obtained previously. In fact, for ϕb = 0.1 the flux polarization degree almost coincides with the theoretical maximum in uniform magnetic field. Deviations from the exact axial symmetry of our model will naturally reduce the polarization degree.

Polarization signal coming from the area of the shock limited by |ϕ| ≤ 0.1, 0.25, 0.5. (At the peak of emission the abscissa of 0.15 arcsec corresponds to ϕ ≈ 0.1.) The dashed line is the theoretical maximum for the synchrotron emission in uniform magnetic field.
6 OTHER PROPERTIES
6.1 Energetics
The observations give the isotropic optical-IR luminosity of the knot of 1.3 × 1033 erg s−1 (Rudy et al. 2015). Given the Doppler beaming angle of 1/Γ2 with |$\Gamma _2\approx \delta _1^{-1} = 2.5$| the actual total knot luminosity is Lob ≈ 1.6 × 1031 erg s−1, implying the radiative efficiency of frad ≈ 10−5.
6.2 Variability
Moran et al. (2013) and Rudy et al. (2015) discuss the variability of the position, size and the luminosity of the inner knot – the position fluctuates relative to the mean by approximately 10 per cent on the time-scales of month(s). At the same time the overall size of knot correlates with the distance from the pulsar, while the luminosity anticorrelates with it.
The numerical simulations by Camus et al. (2009) and, Porth et al. (2014) show that inner region of PWN is highly dynamic and the shock surface is constantly changing as the result. When the external pressure drops the shock expands and when the pressure increases the shock recedes. The emission of wisps is one effect of this variability observed in the synthetic synchrotron images obtained in the simulations. The other one is the unsteady behaviour of the inner knot, whose position and brightness change in time. In fact, Porth et al. (2014) reported an anticorrelation of their synthetic knot luminosity with its projected distance from the pulsar.
In order to understand these results, let us consider the simplest model of the shock variability, where the shock shape is preserved but its length-scale R0 fluctuates. In this case, the downstream emissivity is the same function of θ and ϕ up to a factor depending on R0. This means that the ratio of the knot size to its separation from the pulsar remains unchanged (see Section 3), which is in good agreement with the HST observations, which give |$\psi _\perp \propto \psi _{\rm k}^{0.8\pm 0.13}$|.
The results of computer simulations show that the shock variability is more complicated, with the shock shape changing as well in response to the external perturbations on the scale below R0 (Porth et al. 2014). Thus, the predictions based on the model of uniform scaling should be considered as rather approximate.
Since in the MHD theory both the wisp production and the knot variability are related to the variations of the shock geometry, one would expect approximately the same time-scale for both these phenomena.3 Although the available observational data do not cover a sufficiently long period of time, they indicate that this may be the case (Hester et al. 2002; Moran et al. 2013; Rudy et al. 2015).
6.3 Connection to Crab's gamma-ray flares
The discovery of flares from the Crab nebula (Abdo et al. 2011; Tavani et al. 2011) challenges our understanding of particle acceleration in PWNe and possibly in other high-energy astrophysical sources.
The short lifetime of gamma-ray emitting electrons means that if they are accelerated at the termination shock then the gamma-ray emitting region is a thin layer above the shock where the flow Lorentz factor is still high and hence its emission is subject to the Doppler beaming. Komissarov & Lyutikov (2011) used this to argue that most of the observed gamma-ray emission of the Crab nebula may come from the inner knot. They and Lyutikov et al. (2012) also speculated that the gamma-ray flares of the Crab nebula may come from the knot as well and proposed to look for correlations between the knot's optical emission and the gamma-ray emission from the nebula. The relativistic post-shock flow may help to explain the peak frequency of flares exceeding the radiation reaction limit of ≈100 MeV (Lyutikov 2010; Komissarov & Lyutikov 2011). Moreover, a blob moving through the knot of ≈10 light days length would be observed for the time smaller by |$2 \Gamma _2^2$|, which can explain the short time-scales of the Crab's flares.
The observed cut-off of the synchrotron spectrum of the Crab nebula at ∼100 MeV in the persistent Crab nebula emission and especially during the flares, when the cut-off energy approached even higher value of ∼400 MeV, is in conflict with slow stochastic acceleration mechanisms (Lyutikov 2010; Clausen-Brown & Lyutikov 2012). Alternatively, the flares may result from linear particle acceleration during explosive relativistic magnetic reconnection (e.g. Lyutikov & Uzdensky 2003; Lyubarsky 2005; Lyutikov 2010; Cerutti et al. 2014). Fast and efficient particle acceleration during the reconnection requires highly magnetized plasma, σ ≥ 1, in the flare-producing region (e.g. Lyubarsky 2012). However, our results show that the knot plasma cannot be that highly magnetized. Moreover, the magnetic field in this region is still expected to be very regular (after the dissipation of the small-scale magnetic stripes), namely azimuthal of the same orientation (Porth et al. 2014), and hence lacking current sheets required for the reconnection. Finally, the coordinated programs of optical observations did not reveal anything unusual about the inner knot emission during the gamma-ray flares (Weisskopf et al. 2013; Rudy et al. 2015). Thus, we have to admit that the Crab flares are unlikely to originate from its inner knot.
If flares do not come the termination shock then they are certainly not connected to the shock particle acceleration mechanism. An explosive magnetic reconnection seems to be the only realistic alternative. A favorable location for such reconnections would have high magnetization parameter σ = B2/w > 1, where w is the relativistic enthalpy, as this would ensure the relativistic Alfvén speed. In addition, its magnetic field should be somewhat disordered so that thin current sheets may develop. In PWNe, such plasma is expected to exist in the polar region downstream of the termination shock, which is fed by the unstriped section of the pulsar wind (Lyubarsky 2012; Komissarov 2013; Porth et al. 2014).
The current observations do not rule out yet that at energies below 100 MeV the synchrotron gamma-ray emission between flares is coming from the knot. If so, a slow variability of the persistent gamma-ray emission at these energies, on the time-scale of wisp production, is expected. Additional studies are required to clarify this issue.
7 COMPARISON WITH OTHER STUDIES
Almost simultaneously with our manuscript, the results of an independent study by Yuan & Blandford (2015) have become publicly available. (Some of their results have been outlined already in Rudy et al. 2015.) We agree in the conclusion that the observed knot parameters rule out high magnetization of the post-shock plasma. However, they could not reach a definitive conclusion on the acceptability of the shock model even in the low-magnetization regime, pointing to a number of difficulties. The main of them concern the transverse size of the knot, its shape and polarization.
For the transverse size, Yuan & Blandford (2015) claimed that in the basic shock model it exceeds the distance to the pulsar at least by the factor of 2.8, in conflict with the observations. However, this estimate is based on the assumption that the emissivity drops by the factor of 2 at an angle αh = 1/Γ2 to the velocity vector. In reality, the combination of the Doppler beaming with the anisotropy of the proper synchrotron emissivity in uniform magnetic field leads to a much smaller angle (see Section 3.3). Curiously, their synthetic image in Fig. 3b shows a much more compact knot, well in line with our results.
For the polarization of the integral shock emission, they obtained a value which is lower compared to that of the inner knot as obtained by Moran et al. (2013). In fact, this result agrees with our calculations, when the flux integration is carried out over the whole shock surface. However, in the observations, the polarization is measured only for the bright core of the knot (area with an aperture radius of 0.15 arcsec). We have demonstrated that smaller integration area leads to higher polarization degree, allowing a much better fit.
Finally, Yuan & Blandford (2015) pointed out that the shock model cannot reproduce the ‘smily’ shape of the knot, claimed in Rudy et al. (2015), but yields images more reminiscent of a ‘frown’. This conclusion is base on the model where the emission comes only from the shock surface, which also leads to a very sharp brightness drop at the distant (relative to the pulsar) edge of the knot. We have shown that in models with finite thickness of the emitting layer, these features do not survive and the frown can easily turn into a smile or even a pout. In fact, the experimentation with different geometries of streamlines in the emitting zone by Yuan & Blandford (2015) also show rather strong distortions of synthetic images. To address such details more advance models, based on computer simulations, are required.
8 CONCLUSION
In this paper, we have further explored the model of the Crab nebula inner knot as a Doppler-boosted emission from the termination shock of the pulsar wind. This model successfully explains a number of its observed properties.
Location. The knot is located on the same side of the pulsar as the Crab jet, along the symmetry axis of the inner nebula, and on the opposite side as the brighter section of the Crab torus. This is a direct consequence of the termination shock geometry and the Doppler-boosting.
Size. The knot size is comparable to its separation from the pulsar. This also follows from the shock geometry and the Doppler-beaming. The anisotropy of the proper synchrotron emissivity, which vanishes along the magnetic field direction in combination with the relativistic aberration of light is another significant factor. Only models with low magnetization of the post-shock flow, with the effective magnetization parameter of the wind σ1 < 1 agree with the observations.
Elongation. The knot is elongated in the direction perpendicular to the symmetry axis. This is because the knot emission comes from the region where the shock surface is almost parallel to the line of sight.
Polarization. The knot polarization degree is high, and the electric vector is aligned with the symmetry axis. This come due to the fact that the post-shock magnetic field is highly ordered in the vicinity of the termination shock and azimuthal. In the model, the relativistic aberration of light leads to a noticeable rotation of the polarization vector along the knot and this prediction could be tested in future polarization observations. Accordingly, the polarization degree of the integral knot emission depends on the integration area – the bigger the area the smaller the degree is.
Luminosity. Taking into account Doppler-beaming, the observed radiative efficiency of the inner knot is consistent with efficient particle acceleration at the termination shock and the knot's magnetic field of one milli-Gauss strength, which is a reasonable value for the inner Crab nebula.
Variability. The knot flux is anticorrelated with its separation from the pulsar. In the numerical simulations, the termination shock is found to be highly unsteady, changing its size and shape. As the shock moves away from the pulsar, so does the knot region, which leads to lower magnetic field and hence lower emissivity. Another outcome of the shock variability in the MHD simulations is the emission of wisps and hence one expects both the processes to occur on the same time-scale, which is consistent with the observations.
In many cases, the agreement with the observed properties of the Crab's inner knot falls short of a perfect fit. Given the uncertainties in the shape of the termination shock, proper emissity of the shocked plasma and the post-shock flow which are present in the model it would be naive to expect more. Further investigations of the models, involving advanced numerical simulations, are needed to achieve this.
Our results may have a number of important implications to the astrophysics of relativistic plasma in general and that of PWN in particular. They show that the termination shock of the relativistic wind from the Crab pulsar is a reality and that this shock is a location of efficient particle acceleration. The strong Doppler-beaming of the emission from the shock explains why this shock has been so elusive. Only the emission from a small patch on the shock surface, the inner knot, is strongly Doppler-boosted and hence prominent. For most of the shock, its emission is beamed away from the Earth and hence difficult to observe.
The shock model of the inner knot allows us to constrain the parameters of the wind from the Crab pulsar. Taken directly, the model requires the wind to be particle-dominated, σ1 < 1, at least at the polar latitudes of 40°–60°. However, in the case of a striped wind, its termination shock can mimic that of a low σ flow even when the actual wind magnetization is extremely high (Lyubarsky 2003). In this context, the magnetic inclination angle of the Crab pulsar should be above 45°, which means that most of the Poynting flux of the Crab wind is converted into particles, if not in the wind itself then at its termination shock (Komissarov 2013). This is in agreement with the results of numerical simulations, which can reproduce the observed properties of the inner Crab nebula extremely well in models with moderate wind magnetization (Porth et al. 2014). However, the polar region of a pulsar wind is free of stripes and can still inject highly magnetized plasma into its PWN.
The fact that during the gamma-ray flares of the Crab nebula the inner knot does not show any noticeable activity suggests that the flares occur somewhere else. This is consistent with the fact that any stochastic acceleration mechanism is too slow to compete with radiative losses and deliver electrons capable of emitting synchrotron photons of 100 MeV energy. Our conclusion that the inner-knot plasma is not highly magnetized also disfavours the knot as a site of explosive relativistic magnetic reconnection. To proceed really fast, the magnetic reconnection has to occur in magnetically dominated plasma (Lyutikov 2010; Clausen-Brown & Lyutikov 2012; Lyubarsky 2012; Cerutti et al. 2014; Sironi & Spitkovsky 2014). The inner polar region of the Crab nebula is the only location where such conditions can be met.
We would like to thank Roger Blandford for stimulating discussions of the issue. We also thank Paul Moran for information on the details of the polarization observations and Lorenzo Sironi for comments on the manuscript.
This work had been supported by NASA grant NNX12AF92G and NSF grant AST-1306672. SSK and OP are supported by STFC under the standard grant ST/I001816/1.
We used the wisp length of 3 arcsec, as stated in (Hester et al. 1995) for the ‘thin wisp’, to calculate the ratio of the isotropic wisps luminosity to that of the inner knot.
The maximal spectral power in the Crab nebula comes out in UV-soft X-rays, where the radiative times scales of leptons is roughly comparable to the age of the nebula. Most of this emission comes from the old volume-filling population of particles, and not from the freshly accelerated ones close to the termination shock.
Knot variability may occur on shorter scales (Lyutikov et al. 2012).
REFERENCES


