


Abstract
NGC 4473 is a so-called double sigma (2σ) galaxy, i.e. a galaxy with rare, double peaks in its 2D stellar velocity dispersion. Here, we present the globular cluster (GC) kinematics in NGC 4473 out to ∼10Re (effective radii) using data from combined Hubble Space Telescope/Advanced Camera for Surveys and Subaru/Suprime-Cam imaging and Keck/Deep Imaging Multi-Object Spectrograph. We find that the 2σ nature of NGC 4473 persists up to 3Re, though it becomes misaligned to the photometric major axis. We also observe a significant offset between the stellar and GC rotation amplitudes. This offset can be understood as a co-addition of counter-rotating stars producing little net stellar rotation. We identify a sharp radial transition in the GC kinematics at ∼4Re suggesting a well defined kinematically distinct halo. In the inner region (<4Re), the blue GCs rotate along the photometric major axis, but in an opposite direction to the galaxy stars and red GCs. In the outer region (>4Re), the red GCs rotate in an opposite direction compared to the inner region red GCs, along the photometric major axis, while the blue GCs rotate along an axis intermediate between the major and minor photometric axes. We also find a kinematically distinct population of very red GCs in the inner region with elevated rotation amplitude and velocity dispersion. The multiple kinematic components in NGC 4473 highlight the complex formation and evolutionary history of this 2σ galaxy, as well as a distinct transition between the inner and outer components.
INTRODUCTION
Kinematically distinct components (KDCs) in early-type galaxies (ETGs) provide clues about their formation and evolution. The KDCs can be viewed as fossils of the accretion and merger processes that built up present-day galaxies in the hierarchical formation framework. Early studies of the kinematics of ETGs were limited to the central regions, where rotation, sometimes along a misaligned or twisted rotation axis, and KDCs were observed (Davies et al. 2001; Emsellem et al. 2004; Krajnović et al. 2011). More recently, the probed radii have been extended into the halo region, where some of these features have been shown to persist, while in others, changes are seen at large radii (Arnold et al. 2014; Raskutti, Greene & Murphy 2014; Foster et al. 2015). Stellar light is, however, faint in the halo region, hence the need for bright kinematic tracers like planetary nebulae and globular clusters (GCs).
Galaxies, apart from forming GCs ‘in situ’, are expected to have acquired some GCs formed ‘ex situ’ through galaxy mergers in the two-phase galaxy formation model (e.g. Oser et al. 2010). Almost all ETGs, studied with deep enough photometry, have been shown to have at least a bimodal GC colour distribution (e.g. Ostrov, Geisler & Forte 1993; Zepf & Ashman 1993). This colour bimodality usually points at an underlying bimodality in metallicity (Usher et al. 2012), which has been linked with the hierarchical merging history of the host galaxies (Tonini 2013). It is possible, by observing correlations in position–velocity parameter space of GCs (Romanowsky et al. 2012; Blom et al. 2014; Foster et al. 2014), to unearth relics of the assembly history of the host galaxy. This is because in the galaxy outskirts, dynamical time-scales are longer – on the order of ∼1 Gyr (Coccato, Arnaboldi & Gerhard 2013), hence a ‘memory’ of the infalling galaxies’ orbital properties is expected to be retained (Johnston, Hernquist & Bolte 1996; Helmi & White 1999). GCs therefore contain fossil records of the chemical and dynamical processes that shaped the structure of present-day galaxies. Similarities between the kinematics (amplitude of rotation velocity, velocity dispersion, direction of rotation, etc.) of stars and GCs in galaxies (Foster et al. 2011; Pota et al. 2013) can be used to further constrain their likely assembly history.
Double sigma (2σ) galaxies (Krajnović et al. 2011) are examples of multispin galaxies (Rubin 1994), easily identified by observing their stellar two-dimensional (2D) velocity dispersion maps. These maps uniquely show a pair of symmetric, off-centre, significant bumps (2σ peaks) aligned along the photometric major axis (Bois et al. 2011; Krajnović et al. 2011; Foster et al. 2013). This feature has been linked to the presence of a pair of extended, counter-rotating disc-like stellar structures at the centre of the galaxy. 2σ galaxies are rare – ∼4 per cent in the ATLAS|$\rm ^{3D}$| survey (Krajnović et al. 2011) – probably because the conditions required to produce them are uncommon, as shown in idealized binary merger simulations (e.g. Jesseit et al. 2007; Bois et al. 2011). They were formed in these simulations only when the merging spiral progenitors have similar masses (mass ratio 1:1 to 3:1) and are coplanar (Crocker et al. 2009). It should be noted that an alternative channel for forming galaxies with counter-rotating stellar components is accretion of cold gas along cosmological filaments (Rix et al. 1992; Thakar & Ryden 1996; Algorry et al. 2014). Generally, the 2σ galaxies from the ATLAS|$\rm ^{3D}$| survey are flattened (ellipticity, ϵ > 0.4), viewed at high inclination (i > 70°) and have low to intermediate luminosities.
NGC 4473 is the most massive known 2σ galaxy (Krajnović et al. 2011), though it can be described as an L* galaxy. It has an absolute magnitude of MK = −23.8 and is photometrically undisturbed. It is a flattened (ϵ = 0.43) elliptical galaxy at a distance of 15.2 Mpc in the Virgo Cluster, with effective radius Re of 27 arcsec and photometric position angle of 92| $_{.}^{\circ}$|2 (Brodie et al. 2014, and references therein). It has a galaxy recession velocity (Vsys) of 2260 km s−1. A Sérsic function fit to its surface brightness shows that NGC 4473 is a ‘cuspy’ galaxy with excess central light (Kormendy et al. 2009; Dullo & Graham 2013), suggesting a dissipative merger origin. It has fast rotation in its inner region (<1Re) and harbours a pair of counter-rotating stellar discs (Cappellari et al. 2007; Krajnović et al. 2011). Foster et al. (2013) studied the stellar kinematics out to ∼3Re and observed counter-rotation which extends beyond ∼60 arcsec along the photometric major axis. They used the Stellar Kinematics with Multiple Slits (SKiMS) method (Norris et al. 2008; Proctor et al. 2009) which extends the stellar kinematics to relatively large radii. They also identified multiple stellar kinematic components in the galaxy outskirts, rotating along both the photometric major and minor axes. They concluded therefore that NGC 4473 is triaxial, with a kinematically distinct halo (KDH).
Here, we study the kinematics of the GC system of NGC 4473 using photometric and spectroscopic data from the SAGES Legacy Unifying Globulars and Galaxies (SLUGGS)1 survey (Brodie et al. 2014) out to large galactocentric radii (i.e. ∼10Re). While Foster et al. (2013) were able to identify a KDH, they could only probe the inner edge of this region. GCs are better suited to probe this KDH properly. We therefore study the radial profile of the GC system kinematics, with particular interest in any sharp kinematic transition(s). These transitions can be used to understand the nature of the last major merger the galaxy experienced, as proposed by Hoffman et al. (2010). We also investigate the radial extent of the 2σ velocity dispersion feature, using GCs. We study the kinematics of the blue and red GC subpopulations separately: differences in their kinematics, besides providing additional evidence for GC colour bimodality, also provide clues about the progenitor galaxies (Bekki et al. 2005).
This paper is structured as follows. In Section 2, we present the photometric and spectroscopic data used in this study. In Section 3, we focus on the photometric analysis, produce 2D mean velocity and velocity dispersion maps, as well as statistically determine the significance of the 2σ feature. We also produce one-dimensional (1D) kinematic radial and colour profiles. Section 3 ends with a discussion of the line-of-sight velocity distributions (LOSVDs) of the GC system. In Section 4, we briefly summarize models from the literature which form 2σ galaxies. In Section 5, we discuss our results, relating them to model predictions from the literature. Finally, in Section 6, we briefly summarize the paper.
OBSERVATIONS AND DATA REDUCTION
NGC 4473 was observed with Suprime-Cam on the Subaru telescope on the night of 2010 November 4. The total exposure times were 688, 270 and 450 s with average seeing of 0.65, 0.65 and 0.67 arcsec in the g, r and i bands, respectively. The raw images were reduced using the SDFRED2 reduction pipeline (Ouchi et al. 2004). To detect GCs, a model of the galaxy light using the iraf/ellipse task was first subtracted from the reduced images and the iraf/daofind task was then used to find bright and compact objects. At a distance of 15.2 Mpc, GCs in NGC 4473 are unresolved and appear as point sources. The objects detected from different bands were matched and aperture photometry was carried out with the iraf/phot task to remove extended sources using the method described in Spitler et al. (2008). Finally, we corrected our photometry for reddening using the dust extinction maps from Schlegel, Finkbeiner & Davis (1998). We used a (g − r) versus (r − i) colour–colour plot to identify GC candidates. We supplement our photometric catalogue with g- and z-band photometry from the Hubble Space Telescope (HST) Advanced Camera for Surveys (ACS) for NGC 4473 (see Spitler et al. 2006; Strader et al. 2006, for details of the photometric reduction). We used the colour transformation equation from Usher et al. (2012) to convert the HSTz-band photometry into the i band. Our final photometric catalogue consists of 1097 GC candidates.
We used the Deep Imaging Multi-Object Spectrograph (DEIMOS) on the Keck II telescope to obtain spectra for objects that are probable GCs from our photometric catalogue. The spectroscopic observations were taken on the nights of 2011 March 30, 2012 February 19 and 2012 February 20. Seeing was between 0.7 and 0.95 arcsec and four DEIMOS masks were observed during the campaign. We used the usual SLUGGS set-up described in Pota et al. (2013) and integrated for 2 h per mask, though one of the masks was observed for 2.75 h. We reduced our raw spectra using the DEEP spec2d pipeline (Cooper et al. 2012) in idl. We determined the heliocentric radial velocities by cross-correlating each spectrum with 13 stellar templates, obtained with the same DEIMOS instrumental set-up, using the iraf/rv.fxcor task. For each object, the radial velocity is the average of the measured radial velocities from fxcor. The uncertainty of each radial velocity is estimated by adding in quadrature the error output from fxcor to the standard deviation among the templates, which is an estimate of the systematics.
The peaks of the calcium triplet (CaT) lines (at 8498, 8542 and 8662 Å) and the Hα (6563 Å) line were used to identify GCs associated with NGC 4473 based on their radial velocities. For secure GC confirmation, we require at least two clearly visible CaT lines (usually 8542 and 8662 Å) and the Hα when probed, as well as GC-status consensus by at least two members of the team. Four spectroscopic GCs had repeated measurements from different masks, all in good agreement and consistent within the uncertainties associated with our observations. The final measurements used for these objects (and recorded in our final spectroscopic object catalogue) are the weighted average of the individual measurements. These repeated observations show that the errors in our radial velocity measurements are ≤15 km s−1. Our final spectroscopic catalogue (see Table 1) contains 105 unique GCs with redshift-corrected radial velocities, alongside Galactic stars and background galaxies.
In Fig. 1 we show the radial velocity distribution of GCs as a function of galactocentric radius. We have used the friendless algorithm of Merrett et al. (2003) to identify possible outliers from our spectroscopic GC catalogue. We implemented the algorithm to identify objects with radial velocities outside the 3σ envelope of their 20 nearest neighbours. The algorithm returned no outliers. We note here the apparent asymmetry in the velocity distribution in the inner 2 arcmin, especially in the red GCs. This can be viewed as a signature of rotation, an issue we explore in details later in this paper.
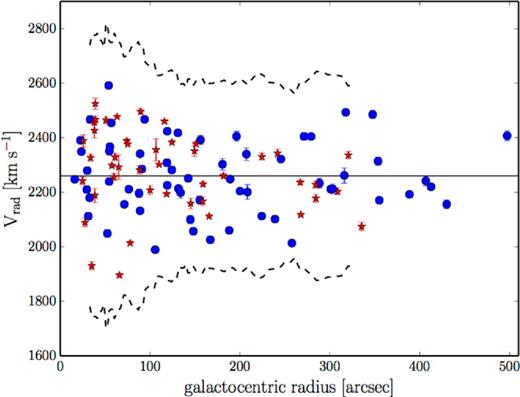
GC radial velocity distribution as a function of galactocentric radius. The solid line and dashed curves show the recession velocity of NGC 4473 and the 3σ envelope of GC velocities, respectively. Blue circles and red stars are spectroscopically confirmed blue and red GCs, respectively.
Spectroscopically confirmed GCs, stars and galaxies. Column (1): object identifier, written as galaxy name and object type (GC, stars and galaxies). Columns (2) and (3): object position (RA and Dec., respectively) in degrees (J2000.0). Columns (4) and (5): measured heliocentric radial velocities and uncertainties, respectively. Columns (6)–(11): Subaru gri photometry and corresponding uncertainties. The photometry has been corrected for Galactic extinction. The full version of this table is available in the online version.
| ID | RA | Dec. | V | ΔV | g | Δg | r | Δr | i | Δi |
|---|---|---|---|---|---|---|---|---|---|---|
| (°) | (°) | (km s−1) | (km s−1) | (mag) | (mag) | (mag) | (mag) | (mag) | (mag) | |
| (1) | (2) | (3) | (4) | (5) | (6) | (7) | (8) | (9) | (10) | (11) |
| NGC 4473_GC1 | 187.45086 | 13.42309 | 2112 | 14 | 22.492 | 0.016 | 21.905 | 0.016 | 21.640 | 0.017 |
| NGC 4473_GC2 | 187.45636 | 13.42486 | 2390 | 12 | 22.024 | 0.013 | 21.387 | 0.013 | 21.102 | 0.014 |
| NGC 4473_GC3 | 187.46807 | 13.42744 | 2524 | 20 | 21.715 | 0.009 | 20.953 | 0.009 | 20.569 | 0.008 |
| NGC 4473_GC4 | 187.46594 | 13.42724 | 2327 | 12 | 23.364 | 0.022 | 22.679 | 0.022 | 22.309 | 0.024 |
| NGC 4473_GC5 | 187.46444 | 13.43094 | 2279 | 12 | 22.251 | 0.011 | 22.682 | 0.012 | 21.442 | 0.013 |
| … | … | … | … | … | … | … | … | … | … | … |
| NGC 4473_star1 | 187.47899 | 13.52667 | −206 | 12 | 22.992 | 0.011 | 22.391 | 0.011 | 22.196 | 0.011 |
| NGC 4473_star2 | 187.38470 | 13.53626 | −148 | 23 | 22.609 | 0.009 | 22.095 | 0.010 | 21.915 | 0.010 |
| … | … | … | … | … | … | … | … | … | … | … |
| NGC 4473_gal1 | 187.42701 | 13.48026 | z = 0.3 | – | 23.067 | 0.011 | 22.464 | 0.011 | 22.284 | 0.012 |
| NGC 4473_gal2 | 187.52558 | 13.36814 | – | – | 22.595 | 0.010 | 22.107 | 0.010 | 21.863 | 0.010 |
| … | … | … | … | … | … | … | … | … | … | … |
ANALYSIS
Photometric analysis
The final colour–magnitude diagram (CMD) of all unique GC candidates from the combined HST and Subaru data, brighter than i < 23.5 mag – 1 mag fainter than the GC turnover magnitude, MTOM, i = −8.4 mag, from Villegas et al. (2010) – is shown in the upper panel of Fig. 2. We use an upper magnitude cut of i ≥ 19.9 mag (using the integrated magnitude of ω-Cen, Mi ≈ −11.0 mag from Pota et al. 2013, and distance modulus from Villegas et al. 2010) to isolate likely ultracompact dwarf (UCD) candidates from our sample, since they may have different chemodynamical properties (see Strader et al. 2011). While this cut excludes the two brightest GCs in our sample (with i-band magnitudes of 19.8 and 19.85), we however chose to retain them after cross-matching them with the published catalogue of GCs in NGC 4473 from Jordan et al. (2009), where they have sizes consistent with being GCs.
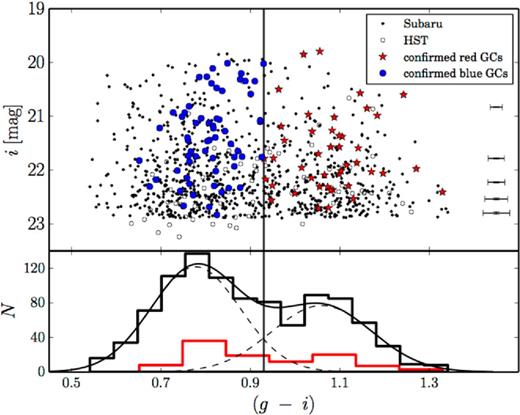
GC (g − i) colour distribution. Top panel: CMD of GC candidates from HST and Subaru photometric catalogues. Black, open and filled circles are HST and Subaru GC candidates, respectively. The vertical line (in both panels) shows the fiducial colour cut (g − i) = 0.93 mag used to separate blue and red GCs in our spectroscopically confirmed sample. Mean photometric uncertainties are shown on the right as error bars. Bottom panel: black histogram is the distribution of GC colour from combined HST and Subaru photometric catalogues, while the red histogram is the colour distribution of spectroscopically confirmed GCs. Gaussian fits from gmm are overplotted on the histogram. The GC colour distribution is bimodal at a 99.99 per cent significance level.
Using the Gaussian Mixture Modelling (gmm) code by Muratov & Gnedin (2010), we determine that the GC colour distribution of NGC 4473 is best described by a bimodal, heteroscedastic distribution at a 99.99 per cent significance level. This is shown in the histogram in the bottom panel of Fig. 2, where the modes are clearly well separated. The (g − i) peaks for the Gaussian modes are 0.78 and 1.06 with dispersions of 0.08 and 0.09, respectively. We group our GC candidates into blue and red GC subpopulations, using a fiducial colour split of (g − i) = 0.93 mag, and find that the fractions of blue and red GCs in our photometric sample are 0.58 and 0.42, respectively.
Mean velocity and velocity dispersion 2D maps
In equations (1) and (2), (i, j) and (α, δ) are grid and sky coordinates, respectively, |$\Delta {\bar{v}}(i,j)$| is obtained as in equation (1) but using the estimated uncertainties and |$w=\sqrt{(\alpha -i)^2+(\delta -j)^2}$|. The 2D maps shown in Figs 3 and 4 have additionally been smoothed with Gaussian kernels that vary linearly with radius to recover the global kinematics. We produce mean velocity and velocity dispersion 2D maps for combined Spectrographic Areal Unit for Research on Optical Nebulae (SAURON; Emsellem et al. 2004) and SKiMS data (Foster et al. 2013) for comparison. Even though the data sets have different spatial extents and sampling, the maps agree well. In the left-hand panel of Fig. 3, where we have combined SAURON and SKiMS data, NGC 4473 shows an axisymmetric, disc-like structure that extends to the edges of the SAURON map. The dumb-bell feature in the velocity dispersion map (right-hand panel of Fig. 3) is typical of 2σ galaxies and the peaks are separated by ∼3Re. The kinematic position angle (PAkin), defined as the angle between the direction of maximum rotation and north, is aligned with the photometric major axis (92| $_{.}^{\circ}$|2). There is significant minor axis rotation beyond 50 arcsec as well as counter-rotation along the photometric major axis (as reported by Foster et al. 2013). Note that rotation along an axis, e.g. major axis, implies that the velocity signature would be seen around the perpendicular axis, i.e. the minor axis. In Fig. 4, the red GCs dominate the rotation of the GC system in the inner ∼7Re region, resulting in 2D maps akin to that of the galaxy stars, with counter-rotation evident along the photometric major axis (bottom left-hand panel of Fig. 4). The mean velocity map of the blue GCs (middle left-hand panel) shows a non-regular rotation pattern, especially in the outer region, with rotation along an axis intermediate to the photometric major and minor axes. The velocity dispersion maps for the blue and red GCs are similar, with the red GCs having higher velocity dispersion within the inner ∼7Re region. However, we see a 2σ-like feature in the velocity dispersion map when all the GCs are combined together (top right-hand panel). These elevated, offset bumps in the 2D velocity dispersion map are however not aligned along the photometric major axis.
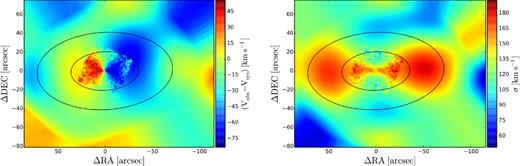
2D smoothed mean velocity (left-hand panel) and velocity dispersion (right-hand panel) maps for galaxy stars in NGC 4473, using data from SAURON (Emsellem et al. 2004) and SKiMS (Foster et al. 2013). In the left-hand panel, rapid disc-like rotation and counter-rotation beyond the footprint of the SAURON data (i.e. ≤1Re) can be seen along the photometric major axis. In the right-hand panel, the 2σ feature is prominent along the major axis. Stellar isophotes at 1 and 2Re have been overplotted in both panels.
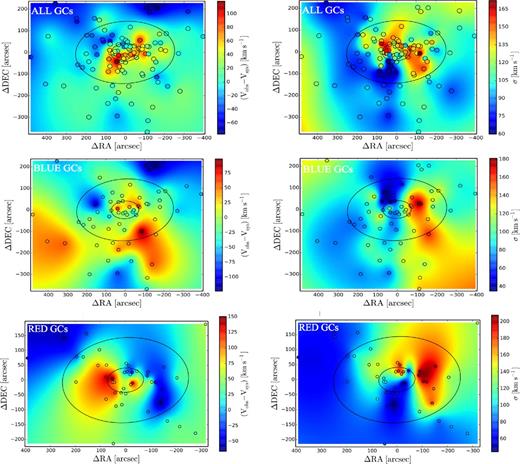
2D smoothed mean velocity (left-hand panels) and velocity dispersion (right-hand panels) maps for GCs in NGC 4473. In the top, middle and bottom panels, we show all the GCs, the blue GCs and red GCs, respectively, using the method described in Section 3.2. The ellipses are 2 and 7Re stellar isophotes and the circles correspond to observed GC positions. In the top right-hand panel, there are signs of the 2σ feature in the velocity dispersion map for all GCs out to ∼3Re, although misaligned to the photometric major axis. In the middle left-hand panel, the blue GCs rotate intermediate between the photometric major and minor axes in the galaxy outskirts, while in the bottom panel, the red GCs counter-rotate along the photometric major axis, similar to the galaxy stars as shown in Fig. 3.
Significance of the extended 2|$\boldsymbol {\sigma }$| feature
To determine how far out the 2σ feature extends in the galaxy stars and GCs, we assume that our measured velocities (and their associated errors), at all positions on the sky, are drawn from the same distribution (see Walker et al. 2006). We then create mock catalogues (Nsim = 1000), using the same sky positions as in our real catalogue, but with velocities (and errors) drawn randomly, without replacement, from the measured values. This non-parametric approach ensures that each mock catalogue has the same velocity distribution as the measured data, but destroys any correlation between position and velocities. We use the method in Section 3.2 to then make velocity dispersion maps for each mock catalogue, and note the maximum velocity dispersion, σmock, per mock catalogue. The significance of the 2σ feature at every grid point p(i, j) is then quantified as the ratio N(σreal(i, j) > σmock)/Nsim. From Fig. 5, the 2σ feature is significant in both galaxy stars and GCs with p > 0.95. The symmetrical form of the 2σ feature is observed in the GCs as well, within ∼3Re, though it appears inclined at ∼ 30° to the photometric major axis. This misalignment needs to be studied in more detail to understand its true nature. However, from the mean velocity maps in Fig. 4, a large velocity difference is evident between the blue and red GCs in the spatial region corresponding to the 2σ feature. Also, these velocity offset regions are misaligned, with the blue GCs rotating along an axis intermediate to the photometric major and minor axis, coincident with the axis of the misaligned 2σ feature. We therefore conclude that the blue GCs drive the observed misalignment in the 2σ feature.
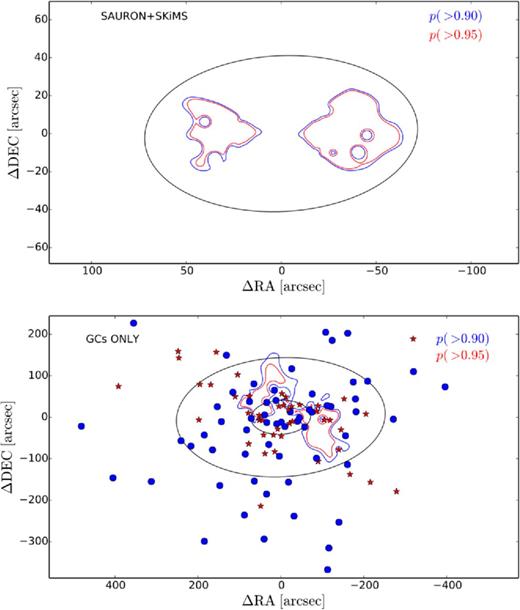
Contours of the 2σ velocity dispersion feature in galaxy stars (top panel) and GCs (bottom panel). Contour levels are taken from the fraction of mock catalogues with a maximum velocity dispersion less than the estimate from the observed velocity dispersion. Blue and red GCs are overplotted in the bottom panel as blue circles and red stars, respectively. The ellipse in the top panel is the 2Re stellar isophote. In the bottom panel, we show the 2 and 7Re stellar isophotes. The 2σ feature is significant in the GCs, along an axis inclined at ∼ 30° to the photometric major axis, out to ∼3Re.
Kinematic 1D radial profiles
to obtain the best-fitting amplitude of rotation Vrot, velocity dispersion σ and PAkin. In equations (4) and (5), Vsys is the recession velocity of the galaxy, while Vi, ΔVi and PAi are the radial velocities, uncertainties in measured radial velocities and position angle for the ith GC, respectively. We do not fit for qkin, the flattening due to rotation, since it is not easily constrained with sparse data. We therefore consider two cases: (i) where we fix qkin = qphot and (ii) qkin = 1. Both cases result in similar GC kinematics, hence we adopt profiles where qkin = qphot, as done by Foster et al. (2013). We fit kinematic parameters by minimizing the function in equation (5) in rolling bins of fixed bin size (N = 20), starting with the innermost GCs. This choice of bin size ensures that Vrot is not artificially inflated,2 especially when rotation is small. To obtain the 68 per cent confidence interval on our kinematic parameters, we randomly sample 1000 times (with replacement) from each bin and minimize the function in equation (5). The bin is continuously updated by deleting the innermost object and adding the next further out GC until we get to the outer radial boundary.
In Fig. 6, we show radial profiles of the kinematic parameters for SAURON, SKiMS, blue and red GCs data for NGC 4473. The kinematic parameters for SAURON and SKiMS data were obtained using the method described in Foster et al. (2011). We fit for Vrot and PAkin together, and σ separately, keeping qkin = qphot for consistency. We have applied an offset of 20 km s−1 to the SAURON velocity dispersion as discussed in Arnold et al. (2014) and Foster et al. (2015). We constrained Vrot and σ to vary between 0 and 300 km s−1 while PAkin was allowed to vary freely in order to probe all possible kinematic components.
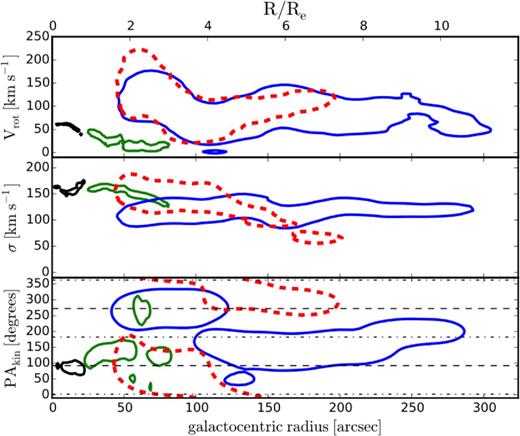
Kinematic radial profiles for blue and red GCs and stars in NGC 4473. Top, middle and bottom panels show the rotation velocity (Vrot), velocity dispersion (σ) and kinematic position angle (PAkin) from the kinematic fit, respectively. We show 68 per cent confidence interval contours in all panels. Blue (solid), red (dashed), green and black contours are for blue GCs, red GCs, SKiMS and SAURON data, respectively. Note the offset in rotation amplitude between galaxy stars and GCs in the top panel. In the middle panel, the blue GCs have a flat velocity dispersion profile. In the bottom panel, the dashed and dot–dashed lines are the photometric major and minor axes, respectively. The galaxy stars have major and minor axis rotation while the red GCs at <4Re rotate in the same sense as the galaxy stars. There is significant counter-rotation along the major axis between the inner blue and red GCs up to ∼4Re. Beyond this, the red GCs begin to wrap around the north direction, rotating along the major axis, but in opposite direction to the galaxy stars. The blue GCs can be seen to rotate predominantly along the minor axis in the outer regions.
The model we fit may not be sensitive to the radially superimposed components identified in the stellar kinematics study of Foster et al. (2013), since it fits a single component function at every radius. To unravel the likely degeneracy in the kinematics, we therefore study kinematics in the blue and red GCs, separately. While contamination from the overlapping tails of the blue and red GC distributions could introduce some uncertainty in our fit, we expect our fit to be robust enough to show dominant kinematic trends. As a further test of the robustness of our fit, we obtain kinematic profiles for the GC subpopulations, adopting only GCs with classification probability greater than 0.68. We recover profiles similar to those obtained when we applied a straight colour cut, confirming that our fitting is indeed robust against the overlap. We also tested the robustness of our fit against the choice of N, the number of GCs per bin. We varied N by 20 per cent (i.e. N = 16, 24) and found that our kinematic profiles are similar in all cases.
As seen in Fig. 6, the blue and red GCs show similar rotation amplitude profiles at all radii. However, there is a large and significant offset between their rotation amplitudes compared to that of the galaxy stars. This is strange and contrary to results from previous studies (e.g. Pota et al. 2013) of other GC systems where the stellar rotation profile usually matches with that of the red GCs, though a similar discrepancy was observed in NGC 4494 (Foster et al. 2011). We tentatively associate this offset with the counter-rotating stellar discs believed to be responsible for the 2σ feature – an issue we address later in Section 5. Here we investigate further by modelling the kinematics for all the GCs (i.e. combined blue and red GCs) in the region where we have very good azimuthal sampling and Vrot is significantly high (≤4Re), and show the result in Fig. 7. Vrot for all GCs is significantly reduced, and comparable to that of the galaxy stars, giving credence to our earlier hypothesis.
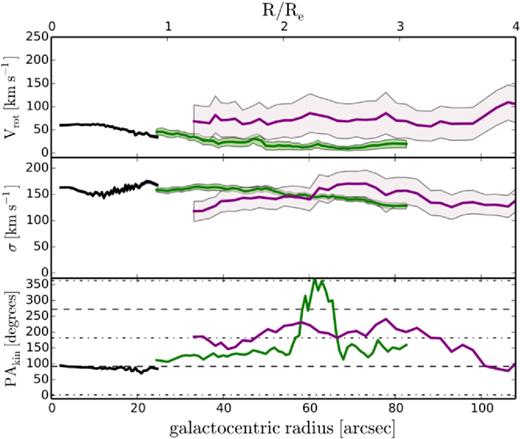
Same as in Fig. 6, but for stars and all GCs in the inner ≤4Re, with the purple lines now showing profiles for all the GCs, binned together in this region, regardless of their colour. We show the 1σ uncertainties for SAURON, SKiMS and all GCs. In the bottom panel, we do not show the uncertainties for clarity. The rotation amplitude, when the GCs are not separated by colour, is now significantly reduced with respect to that of the blue and red GCs, and now comparable to that of the stars.
The velocity dispersion profiles for both GC subpopulations are similar in the inner ∼4Re region. We see signs of decline in the velocity dispersion of the red GCs while the blue GCs maintain a flat profile. In the region of overlap (see Fig. 7), the velocity dispersion profiles of the red GCs and galaxy stars are similar. Both GC subpopulations, however, differ in their PAkin profiles. In the inner 4Re, the blue and red GCs counter-rotate along the photometric major axis, with the red GCs rotating in the same sense as the inner galaxy stars. The red GCs in the outer region (>4Re) also rotate along the photometric major axis but counter-rotate with respect to the inner red GCs. In the outer region, the blue GCs show rotation along the minor axis, with multiple components. Hence, we a see counter-rotation along the photometric major axis as well as a minor axis rotation in the GC kinematics, similar to the result of Foster et al. (2013) for the stellar component.
In the study of GC kinematics, it is possible to overestimate the rotation amplitude (Sharples et al. 1998; Romanowsky et al. 2009; Strader et al. 2011; Zhang et al. 2015), and we therefore perform statistical tests to ascertain that our rotation profile is real. We quantify possible bias using GCs in the inner (≤4Re) radial bin by generating artificial discrete velocities at the GC position angles using our kinematic model. In the model, we fix σ and PAkin to the best-fitting values for this region and vary Vrot over the range of possible values (from 0 to 300 km s−1). Vrot retrieved from the artificial data set reveals that our kinematic fitting only suffers from bias at extreme rotation amplitudes, i.e. we tend to overestimate Vrot at low intrinsic rotation amplitudes (e.g. at 30 km s−1, we overestimate Vrot by 30 km s−1) and underestimate at very high rotation amplitudes (e.g. at 270 km s−1, we underestimate Vrot by 20 km s−1). At the best-fitting values for the blue GCs, the bias in Vrot is negligible, while for the red GCs, it is ∼10 km s−1.
We also created artificial data sets by randomly shuffling the position angles of the GCs in the inner radial bin, and then fit for kinematic parameters. We constructed 1000 such data sets. The random shuffling serves to destroy any intrinsic correlation between GC position angle that could be driving the rotation amplitude. From the fit, we determined the probabilities that the GC rotation is non-zero for the blue and red GC in the inner radial bin are 95 and 89 per cent, respectively.
We show the rotation dominance parameter (Vrot/σ) in the top panel of Fig. 8. This parameter quantifies how ‘discy’ a system is, such that when Vrot/σ > 1, the system is described as rotation dominated. Though the blue and red GCs show high rotation within the inner ∼4Re, the GC system is overall not rotation dominated. The Vrot/σ profile has a negative gradient, at least within the inner ∼4Re and we note the spike in the profile for the blue GCs at ∼6Re. This may be a substructure signature.
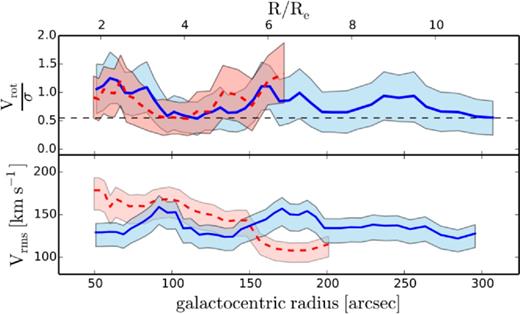
Rotation dominance, Vrot/σ (top panel) and Vrms (bottom panel) profiles for blue GCs and red GCs. Colour scheme is the same as in Fig. 6. Below the dashed horizontal line, Vrot would be artificially inflated for our bin size choice (see Section 3.4 for details). The Vrot/σ profiles suggest that both blue and red GCs have high rotation. The Vrms profile for the red GCs declines more rapidly than that of the blue GCs, which stays relatively flat at all radii.
Kinematics as a function of GC colour
The sharp twist in PAkin for both blue and red GCs at ∼4Re (Section 3.4) suggests that this could be a radial boundary between the inner and outer GC subpopulations. We therefore use this fiducial radial limit to define inner and outer GC subsamples and study their kinematics as a function of colour. For both cases, we use the model and method in Section 3.4, binning by GC colour and fitting for the kinematic parameters while fixing qkin = qphot. We show the results in Fig. 9 and note the similar Vrot profiles for GCs with (g − i) < 1.05 mag. For GC colours redder than this in the inner radial bin (i.e. <4Re), Vrot and σ are significantly higher than the average for the entire GC system and PAkin is aligned along the photometric major axis. Again, the inner blue and red GCs counter-rotate along the photometric major axis. In the outer region, for the blue GCs, the dominant rotation mode is along the minor axis.
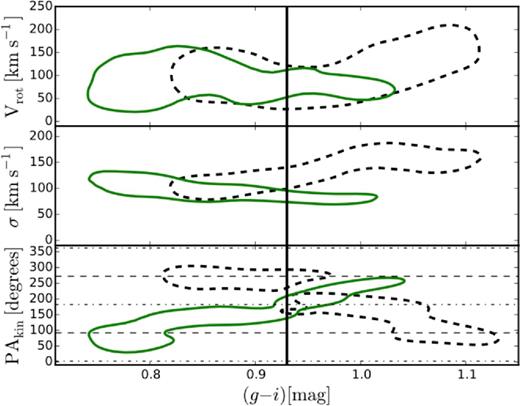
GC kinematics as a function of (g − i) colour in the inner <4Re (black-dashed contours) and outer >4Re (green-solid contours) regions. Dashed and dot–dashed lines are the same as Fig. 6 and contours show the 68 per cent confidence interval. The black vertical line is the colour cut, (g − i) = 0.93 mag used in our analysis. GCs in the inner bin show counter-rotation along the photometric major axis while the outer bin is dominated by minor axis rotation. The inner region has a population of very red GCs, i.e. (g − i) > 1.05 mag with high velocity dispersion that are rotating along the major axis.
Line-of-sight velocity distribution
To better understand the variations of GC kinematics with radius and colour, as well as the sharp transition at ∼4Re, we construct LOSVDs for our spectroscopic GC data set. We consider three samples: all GCs in a single bin, GCs within ∼4Re in a single bin and GCs beyond ∼4Re from the galaxy centre in a single bin. We make LOSVDs for the blue and red GC subpopulations using the bins defined above and present the results in Fig. 10. The LOSVDs have been smoothed with optimal bandwidth Gaussian kernels (Silverman 1986) and normalized for easy comparison.
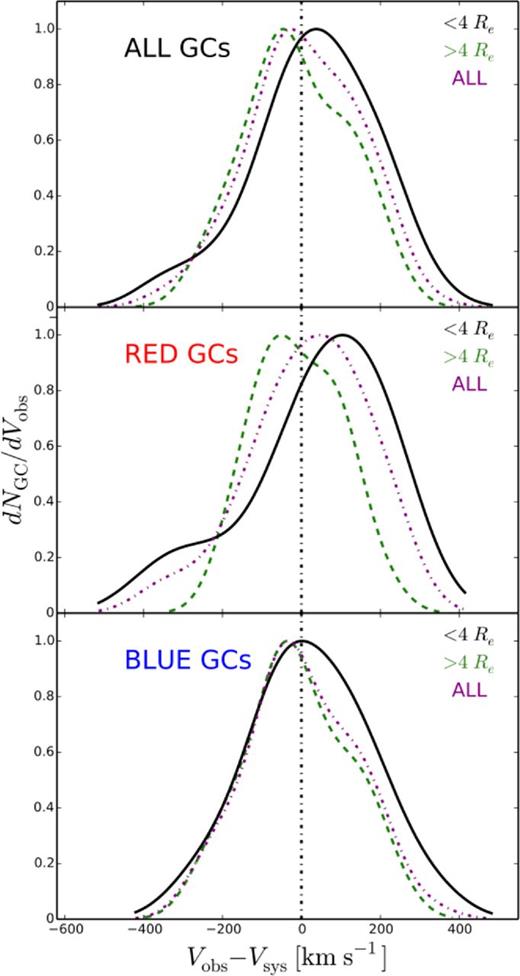
LOSVD for GCs in radial bins, and by GC subpopulation. Panels from top to bottom show all the GCs, red GCs and blue GCs, respectively. Different colours correspond to different radial bins. The middle panel reveals a kinematic difference between the inner and outer bin red GCs. In the bottom panel, the blue GCs have ‘peaked’, symmetrical LOSVDs suggesting radially biased orbits.
From the top panel, all our three samples have LOSVDs that are approximately Gaussian with peaks consistent with the galaxy recession velocity. This can be interpreted as overall dynamic equilibrium. The middle panel, however, shows that the red GCs in the inner radial bin have an asymmetric LOSVD with a significantly redshifted velocity peak and an excess of low-velocity GCs. The LOSVD is such that the prograde wing has a steeper gradient than the retrograde wing. In the outer bin, the LOSVD has a flattened shape, which might be due to tangentially biased orbits. This suggests that the inner red GCs are dynamically different from those in the outer radial bin. In the bottom panel, the ‘peaked’ shape of the LOSVDs suggests that the blue GCs, especially in the outer bin, are likely to be on radially biased orbits.
MODEL PREDICTIONS FOR 2σ GALAXIES
Before discussing our results, we first briefly summarize models which produce 2σ galaxies. Bois et al. (2011) used idealized numerical simulations to study the mergers of Sb–Sc galaxy pairs with dissipation over a range of initial conditions. In the simulations, and in agreement with Crocker et al. (2009), 2σ galaxies are produced when the merging progenitor pair have opposite spin and are coplanar. Tsatsi et al. (2015) recently showed that major mergers of spiral galaxies on prograde orbits could also produce galaxies with 2σ features, although in their simulations, the remnant galaxy showed a centrally elevated velocity dispersion – a feature not normally associated with 2σ galaxies. In all cases, galaxies with 2σ features are flattened (ϵ > 0.4) but could be either fast or slow central rotators. The extent of the KDC depends on the initial orbits and mass ratio of the merging pair. Progenitors on antiparallel orbits produce counter-rotating cores usually within 1Re while those on parallel orbits produce more extended decoupled features. The KDC is usually illusory (van den Bosch et al. 2008), in the sense that it is formed by the superposition of a pair of counter-rotating stellar systems. The inclination of the merger remnant is important in observing the 2σ feature, especially for 1:1 mergers. Though the idealized binary mergers of Bois et al. (2011) produced 2σ-like remnants, the simulations were not cosmological. They did not include effects from disc regrowth through cold accretion flows, bulge growth through minor mergers or late major mergers. These could produce remnants that would be intermediate between fast and slow rotators.
Recently, Naab et al. (2014) used cosmological simulations to track the assembly history of present-day galaxies from z ∼ 2 within the ‘two-phase’ galaxy formation model. The only galaxy, out of 44 in the simulations (∼2 per cent), with a clear 2σ velocity dispersion feature (their M0209 in class E) is a slow rotator that experienced a late (z < 1) gas-poor major merger, and very little in situ star formation (since z ∼ 2). It is therefore dominated by old (∼10 Gyr) stars. We suspect that the shortfall in the reported number of remnant galaxies with a clear 2σ feature could be due to multiple late mergers which could conspire to wash away the 2σ feature.
The two simulations described above do not consider GCs. There is a dearth of simulation studies for GC kinematics in ETGs compared to stellar kinematics. Bekki et al. (2005) studied the kinematics of GCs in disspationless major mergers of Milky Way-like galaxies using numerical simulations; no new GCs were formed in these simulations. Even though the GCs in the progenitor spirals were not given any initial rotation, they were predicted to have significant rotation at large radii in binary major merger remnants. This was interpreted as conversion of orbital angular momentum to intrinsic angular momentum. Also, the blue GCs were predicted to have a higher central velocity dispersion than the red GCs with the rotational dominance parameter (Vm/σ) for GCs interior to 6Re greater than that of the galaxy stars within 2Re. Vm is the maximum rotation velocity, so we take the ratio Vm/σ as an upper limit to our Vrot/σ. The velocity dispersion is expected to decrease with radius in binary mergers, unlike in multiple mergers, where it is expected to have a more flattened profile.
We therefore compare our results with these model predictions, in an attempt to unravel the unique assembly history of NGC 4473.
DISCUSSION
It has been shown from stellar kinematics within 1Re that NGC 4473 has two embedded, counter-rotating stellar discs, with mass ratio 3:1 (Cappellari & McDermid 2005; Cappellari et al. 2007). Counter-rotation beyond 60 arcsec along the photometric major axis, as well as multiple kinematic components up to 3Re, have also been reported from the SLUGGS survey (Foster et al. 2013, 2015; Arnold et al. 2014). Koleva et al. (2011) showed that NGC 4473 has a younger and more metal-rich stellar population in the central parts compared to the average for the galaxy. This agrees with the results of Kuntschner et al. (2006, 2010) and Pastorello et al. (2014), who found an extended, metallicity-enhanced region along the photometric major axis. These studies, along with the central extralight from Kormendy et al. (2009) and Dullo & Graham (2013), suggest that a gas-rich event can be linked to the complex features we see in the kinematics of NGC 4473.
Our results show that the GC system kinematics of NGC 4473 is equally as complex as that of the galaxy stars, suggesting co-evolution between the GCs and galaxy stars. Within the GC system, the blue and red GCs independently show distinct and complex kinematics suggesting different formation processes and/or epochs. This again reinforces the conclusion that GC colour bimodality is real (Brodie et al. 2012; Usher et al. 2012) reflecting some more fundamental, underlying galaxy property, i.e. metallicity, as well as the complex formation and assembly history of galaxies (Tonini 2013). The velocity dispersion and the PAkin profiles of the red GCs trace those of the galaxy stars in the region of overlap, unlike the blue GCs (see Figs 4 and 6). Similar features are seen in some other galaxies (e.g. Schuberth et al. 2010; Coccato et al. 2013; Pota et al. 2013), where the red GCs and galaxy stars are believed to share a common formation history.
Both GC subpopulations however show a large offset between their rotation amplitudes and that of the galaxy stars. This is odd, as studies of GC system kinematics usually find a match between the rotation profiles of stars and the red GCs (e.g. Coccato et al. 2013; Pota et al. 2013). Here, contrary to the norm, we find that the rotation profiles only match when all the GCs, i.e. the blue and red GC subpopulations, are used together in our analysis. Having shown that our Vrot profiles are not biased, we suggest that this offset is due to the presence of the two counter-rotating, flattened stellar structures at the galaxy centre. When galaxy starlight from the radially overlapping stellar components is integrated along the line of sight, as in the case of the stellar kinematics from SAURON and SKiMS, the net effect is to lower the recovered rotation amplitude, since the components are counter-rotating. When we combined all the GCs, i.e. without separating them into blue and red GC subpopulations (see Fig. 7), we observe that the rotation amplitude is significantly reduced, comparable to what is obtained for the galaxy stars. Here, separating the GCs into subpopulations by colour also separates them into counter-rotating components and reveals the true rotation amplitude. We therefore predict that similar offsets would be obtained between the rotation profiles of galaxy stars and discrete tracers for all 2σ galaxies, depending on the luminosity contributions from the cospatial stellar components.
We have also found counter-rotation in the GCs, with a sharp transition in both blue and red GCs, at ∼4Re. This adds to the kinematic complexity of the GC system. In the inner ∼4Re, blue and red GCs counter-rotate along the photometric major axis, while beyond this, the blue and red GCs show a sharp ∼ 180° kinematic twist, with the blue GCs rotating intermediate to the major and minor axes in the GC system outskirts. This transition radius and counter-rotation, unambiguously show that the galaxy mass assembly occurred in phases from materials that had decoupled angular momenta. This is in agreement with the ‘two-phase’ galaxy formation paradigm and predictions from Crocker et al. (2009) and Bois et al. (2011). We find further evidence for distinct kinematics on either side of this transition radius from the colour profiles of kinematic parameters and the LOSVD (see Figs 9 and 10). We note that this strong internal transition is however not seen in photometry, underscoring the importance of kinematics in obtaining a complete picture of galaxy assembly.
Gas-rich major mergers have been shown to produce sharp radial kinematic transitions, similar to what we have observed, between 1 and 5Re (Hoffman et al. 2010). Kormendy et al. (2009) suggested that the counter-rotating component in NGC 4473 might have formed in a late gas accretion or gas-rich minor merger event, due to the small region (∼0.8Re) associated with the extralight. However, gas-rich minor mergers do not form 2σ galaxies (Bois et al. 2011) and the radial extent of the counter-rotating region with coherent GC kinematics we observe here argues against a minor merger origin. While counter-rotating stellar components can be formed from gas accreted on retrograde orbits, this channel is unlikely to be responsible for the large-scale counter-rotation observed in the GCs, unless the accretion event was early (Algorry et al. 2014; Danovich et al. 2015; Lagos et al. 2015). Explaining the sharp radial kinematic transition and counter-rotation of the blue and red GCs in a 2σ galaxy in terms of minor mergers is difficult. We therefore link the large-scale stellar and GC counter-rotation to the gas-rich major merger event that formed the 2σ feature.
The classic gas-rich major merger scenario for GC formation (Ashman & Zepf 1992) suggests that the merger remnant, apart from acquiring GCs from the progenitor spirals, can also form metal-rich stars and GCs (Bournaud, Duc & Emsellem 2008; Kruijssen et al. 2011). The group of dynamically ‘hot’, very red GCs in the inner 4Re radial region (see Fig. 9) could have been formed in such a merger event. Their rotation direction suggests that they are kinematically coupled to the galaxy stars. They could be the GC counterpart of the younger stars reported in Koleva et al. (2011). Measuring their age, metallicity and α abundance could reveal a younger GC population that matches the ∼6 Gyr age measured by Koleva et al. (2011) in the galaxy core.
The central velocity dispersion of the blue GCs is lower than that of the red GCs, contrary to the prediction of the major merger simulation of Bekki et al. (2005) (see middle panel of Fig. 6). We do not see signs of increasing rotation amplitude or rotation dominance with radius, for both blue and red GC subpopulations as predicted. However, our rotation profiles agree with the prediction of fast rotation at large radii from Bekki et al. (2005), with comparable Vrot/σ for blue and red GCs at all radii. It should, however, be noted that the predictions from Bekki et al. (2005) are for a dry major merger, where no new stars are formed. It has been shown from simulations (e.g. Barnes & Hernquist 1996; Jesseit et al. 2007; Hoffman et al. 2010) that the presence of gas significantly alters the kinematics of merger remnants, especially in the central parts, alongside the formation of new GCs.
In the inner region, where PAkin is aligned with the photometric major axis (see Figs 6 and 9), the kinematic misalignment is negligible, i.e. ∼ 0°. However, in the outer region, where the blue GCs dominate, the average PAkin is intermediate between the photometric major and minor axes, implying a non-zero kinematic misalignment. This suggests that the GC system of NGC 4473 is triaxial, closely following the galaxy (see also Foster et al. 2013). Orbital structures from the merging progenitors are predicted to be preserved in the galaxy outer regions, where the effect of dissipation is negligible. In the galaxy outskirts, the ‘peaked’ shape of the LOSVD of the blue GCs suggests that they are preferentially on radial orbits. This agrees with the predicted multiple minor merger or accretion origin for the blue GCs (Côté, Marzke & West 1998; Hilker et al. 1999; Dekel et al. 2005; Bekki et al. 2008). Incidentally, the same argument can be made entirely from the Vrms profiles (see Fig. 8), where the flat profile for the blue GCs indicates a multiple minor merger origin (Bekki et al. 2005; Pota et al. 2013). This, therefore, suggests that the outer envelope of the galaxy was assembled through minor mergers.
CONCLUSIONS
Here we present mean velocity and velocity dispersion 2D maps from GCs and stars in NGC 4473 to reveal complex kinematic features which extend up to 10Re. We show that the double sigma feature of the stellar velocity dispersion map extends to the GC system, reaching out to 3Re, but is misaligned with respect to the photometric major axis.
By fitting an inclined disc model to our GC data, we find that the blue and red GCs have different kinematics, with a sharp transition in the kinematics at ∼4Re in both GC subpopulations. In the inner (<4Re) region, the blue and red GCs counter-rotate along the photometric major axis while in the outer (>4Re) region, the blue GCs rotate intermediate to the photometric major and minor axes. The red GCs in the outer region rotate along the major axis, but in opposite sense compared to the inner red GCs. The large-scale GC counter-rotation, sharp kinematic transition, both as a function of galactocentric radius and GC colour, and the discovery of a group of centrally located, kinematically hot, very red GCs provide additional evidence that NGC 4473 could have been formed in a gas-rich major merger event. In the future, stellar population analysis of this hot GC subsample would help to determine the merger history of the galaxy. We find that the outer region is dominated by GCs on radial orbits with a flat Vrms profile – which suggests that multiple minor mergers may have contributed to the build up of the outer regions of NGC 4473.
We conclude that the GCs in NGC 4473 share a common assembly history with the stars, based on the similarities in their radially decoupled, complex kinematics. Our results differ significantly, in some aspects, from the predictions of GC kinematics in simulated mergers of spiral galaxies. We attribute this to the assumptions made in the simulations. A detailed simulation of GC kinematics in galaxies formed via gas-rich mergers with dissipation is needed to better understand rare but interesting galaxies like NGC 4473.
We thank the anonymous referee for careful review and very useful comments on our paper. We thank all members of the SLUGGS team for helpful comments. The data presented herein were obtained at the W.M. Keck Observatory, which is operated as a scientific partnership among the California Institute of Technology, the University of California and the National Aeronautics and Space Administration. The Observatory was made possible by the generous financial support of the W.M. Keck Foundation. The authors wish to recognize and acknowledge the very significant cultural role and reverence that the summit of Mauna Kea has always had within the indigenous Hawaiian community. The analysis pipeline used to reduce the DEIMOS data was developed at UC Berkeley with support from NSF grant AST–0071048. DAF thanks the ARC for support via DP130100388. JPB acknowledges support from AST-1211995.
The amplitude of velocity rotation is artificially inflated when |$V_{\rm rot}/\sigma \le 0.55\sqrt{\frac{20}{N}}$| (Strader et al. 2011).
REFERENCES
SUPPORTING INFORMATION
Additional Supporting Information may be found in the online version of this article:
Table 1. Spectroscopically confirmed globular clusters, stars and galaxies. (Supplementary Data).
Please note: Oxford University Press are not responsible for the content or functionality of any supporting materials supplied by the authors. Any queries (other than missing material) should be directed to the corresponding author for the article.
