


Abstract
346 new CCD observations during the years 2011–2014 have been reduced to derive the precise positions of Phoebe, the ninth satellite of Saturn. The observations were made by the 2.4 m telescope at Yunnan Observatory over nine nights. Due to the use of a focal-reducer on the telescope, its significant geometric distortion is solved for and removed for each CCD field of view. The positions of Phoebe are measured with respect to the stars in UCAC2 catalogue. The theoretical position of Phoebe was retrieved from the Institute de Méchanique Céleste et de Calcul des Éphémérides ephemeris which includes the latest theory PH12 by Desmars et al., while the position of Saturn was obtained from the Jet Propulsion Laboratory ephemeris DE431. Our results show that the mean O−Cs (observed minus computed) are −0.02 and −0.07 arcsec in right ascension and declination, respectively. The dispersions of our observations are estimated at about 0.04 arcsec in each direction.
1 INTRODUCTION
Phoebe – the irregular outer satellite of Saturn has a quite lower precision ephemeris when compared with the major satellites of Saturn. The main explanation for this comes from its astrometry (Desmars et al. 2013). Specifically, the reference star catalogue often makes a direct and significant contribution to the positional measurement errors of Phoebe. For example, even for the modern stellar catalogues (such as USNO B1.0, USNO A1.0 and USNO A2.0), significant zonal errors have been detected by Chesley, Baer & Monet (2010) from the residuals of numbered asteroid observations. The systematic errors from reference star catalogues also include the proper motion errors and these sometimes make a greater contribution to the measured residuals of Phoebe. From the experiment conducted by Desmars et al. (2013) in their fig. 5 we can see that the positional errors from different catalogues can reach more than 1 arcsec during 100 yr. On the other hand, Phoebe itself is very faint (∼magnitude 16.5). Lower SNR (signal-to-noise ratio) images often result in poor positional measurements of Phoebe, especially when a modest telescope is used. However, some serious problems possibly come from astrometric calibration. Though a big-aperture telescope is expected to have the advantage of providing a better SNR image of Phoebe, its correspondingly small CCD field of view often will not always be ideal. An obvious example can be seen from the INT 2.5 m telescope at its prime focus which is heavily affected by the field distortion (Vaduvescu et al. 2011). Our previous work (Peng et al. 2012) has shown that there exists an obvious geometric distortion (called GD hereafter) in the small CCD field of view (about 7 arcmin × 7 arcmin) of the 1 m telescope at Yunnan Observatory. Furthermore, different filters (Johnson I- and R-types) are revealed to have completely different GD patterns for this telescope. Another illustration (Zhang, Peng & Zhu 2012) is based on observations from the new 2.4 m telescope at Yunnan Observatory, showing that the GD pattern is more serious than that of the 1 m telescope due to the focal-reducer attached to the new telescope. There is no doubt that a telescope should be carefully calibrated whenever high-precision astrometry is the main objective.
The contents of this paper are arranged as follows. In Section 2, the observations are described. Section 3 presents the method of reduction. In Section 4, we make comparisons and analysis of the residuals. Finally, in Section 5, we draw our conclusions.
2 OBSERVATIONS
Since 2011, we have been engaged in a systematic observation of the Saturnine satellite, Phoebe. All the observations were made with the 2.4 m telescope at Yunnan Observatory. The site (i.e. IAU code O44) is at longitude E100° 01′ 51′′, latitude N26° 42′ 32′′ and height 3193 m above sea level. A total of 346 frames of CCD images have been obtained for the satellite as well as 331 frames of CCD calibration images. The exposure time for each CCD frame ranged from 20 to 60 s, depending on the meteorological conditions. For more instrumental details for the reflector and the CCD detector, see Table 1. During observations Phoebe and a dense stellar field were often observed in each night and with the same filter, but at different pointings. In Table 2, the observational sets for Phoebe and calibration fields are given for each night. Due to the poor weather conditions on 2013 February 4 and 2014 April 25, no calibration fields could be used to derive the GD patterns of the field of view and we used the same GD patterns as those on 2013 February 5 and 2014 April 26, respectively.
Specifications of the 2.4 m telescope and CCD detector.
| Approximate focal length | 1920 cm |
|---|---|
| F-Ratio | 8 |
| Diameter of primary mirror | 240 cm |
| CCD field of view (effective) | 9 arcmin × 9 arcmin |
| Size of CCD array (effective) | 1900 × 1900 |
| Size of pixel | 13.5μm × 13.5μm |
| Approximate angular extent per pixel | 0.285 arcsec pixel−1 |
Observations for Phoebe and calibration fields. Columns 3 and 4 list the number for a dense star field and Phoebe, respectively. Column 5 lists the filter.
| Obs Date | Calibration fields | Phoebe | Filter | |
|---|---|---|---|---|
| Dense star fields | No. | No. | ||
| 2011-01-03 | NGC2324 | 45 | 24 | I |
| 2012-02-18 | NGC2324 | 49 | 99 | I |
| 2012-02-19 | NGC2324 | 49 | 85 | I |
| 2013-02-04 | No data available | 20 | B | |
| 2013-02-05 | Dense field in the Galaxy | 48 | 19 | B |
| 2013-02-06 | Dense field in the Galaxy | 46 | 20 | B |
| 2013-02-07 | Dense field in the Galaxy | 46 | 15 | B |
| 2014-04-25 | No data available | 24 | R | |
| 2014-04-26 | NGC6494 | 48 | 40 | R |
| Total | 331 | 346 |
3 ASTROMETRIC REDUCTION
The reduction procedures were carried out according to Peng et al. (2012). First, the calibration fields were processed, then the GD patterns were derived from the observations of a dense stellar field. Next the derived GD was applied to correct the pixel positions of the stars and Phoebe. Lastly, the observational positions of Phoebe could be obtained with respect to the reference stars in the same field of view using the UCAC2 star catalogue. More description follows.
3.1 The calibration
In order to derive the GD patterns of the field of view, a dense overlapping star field was observed. Then the pre-processing such as dark-frame and flat-field corrections, removal of cosmic rays and clipping of the edges were made for each CCD frame. The edge of the frame was clipped as the 2.4 m telescope has ineffective boundaries which have non-exposure pixels, and this left an effective area of about 1900 × 1900 square pixels. Next the matches between the stars in each frame and those in some stellar catalogue were performed. Here, PPMXL (Roeser, Demleitner & Schilbach 2010) is chosen as the reference star catalogue because of its large number of reference stars available. More information on the calibration process can be found in Peng et al. (2012) and Zhang et al. (2012).
3.2 The deriving of the GD and iteration
The result of matches for each CCD frame is a list. Each row of the list includes catalogue star identification, pixel position, equatorial coordinate, magnitude and the proper motion. Then an accurate reduction is done including the computations of topocentric apparent position for each star in each CCD frame. Atmospheric refraction is also added in the computations. Next by using a four-parameter linear transformation, we get a positional difference between the measured pixel location of a star and the indirectly calculated one of the same star. Theoretically, the difference consists of GD, the catalogue error and the measured error. As a star appears in many CCD frames with different offsets, the GD can be derived by cancelling out the catalogue errors and compressing the measured errors.
The initial GD is imprecise and an iterative procedure is done after a bilinear interpolation is made for all star pixel positions. Usually five to eight iterations are required to have a converged GD. Fig. 1 shows major GD patterns over nine nights for the 2.4 m telescope. We can see the telescope suffers a serious GD and the GD pattern in 2011 is completely different from others. In fact, we were notified that a new focal-reducer was adopted in 2012. In addition, differing from the 1 m telescope at Yunnan Observatory, where different filters are revealed to have different GD patterns (Peng et al. 2012), the GD patterns for the 2.4 m telescope are similar after 2012. Although different filters such as Johnson I, B and R are used during the observational campaigns, the GD patterns seem to be unaffected by the filters. Most of the GD patterns are smooth, except the GD patterns on 2013 February 7 and 2014 April 25. We speculate that these might be caused by poor weather conditions. Besides, the maximum GD changes from 1.86 pixels (∼530 mas) to 2.71 pixels (∼775 mas) and the median from 0.19 pixels (∼54 mas) to 0.32 pixels (∼91 mas).
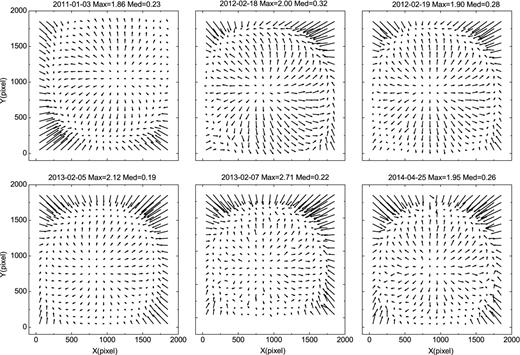
GDs for the 2.4 m telescope. The upper three panels show the GD derived from a Johnson I filter from observations of NGC2324. The bottom-left two panels show the GD from a Johnson B filter from observations of a dense field in the Galaxy, the bottom-right panel shows the GD from a Johnson R filter from observations of NGC6494. In each panel, the maximum GD (Max) and the median GD (Med) are also listed in units of pixels and a factor of 200 is used to exaggerate the magnitude of each GD vector.
3.3 GD correction and positional measurement of Phoebe
Phoebe was observed with the same filter as the calibration fields but at different pointings. Usually only a few stars appear in a CCD frame for Phoebe and deriving the GD pattern directly by using the reference stars is impractical. Therefore we make an assumption that the GD pattern for Phoebe is consistent with the GD of calibration field derived on the same night. Actually, as the GD pattern was similar on different nights, we believe that the difference is subtle. After matching the reference stars which appeared in the same frame as Phoebe with the positions in UCAC2 (Zacharias et al. 2004) star catalogue, the pixel positions of the stars and Phoebe were both corrected by using the derived GD. Here, the UCAC2 star catalogue was chosen as the reference star catalogue, following the advice of Arlot et al. (2003). This practice is also in agreement with other observers (Peng & Zhang 2006; Qiao et al. 2006, 2011). Afterwards, a four-parameter model was applied between the corrected pixel positions and the standard coordinates for each reference star. The observed position of Phoebe was easily obtained by the calibration of the four parameters.
To compare the observations with the theoretical ones, the modern ephemeris PH12 developed by the Institute de Méchanique Céleste et de Calcul des Éphémérides (IMCCE; Desmars et al. 2013) via their website http://www.imcce.fr/ is used. DE431, developed by Jet Propulsion Laboratory (JPL), is adopted for the primary planet Saturn. In order to display the effect of GD corrections, we also display the results without GD corrections. Table 3 shows the statistics of (O−C) residuals of Phoebe before and after GD correction. Fig. 2 shows the (O−C) residuals of Phoebe with respect to the observational epochs and Fig. 3 shows the (O−C) residuals of Phoebe with respect to the pixel coordinates in the CCD frame before and after GD correction over four years. It can be seen the internal agreement or precision has improved significantly after GD correction for the 2.4 m telescope.
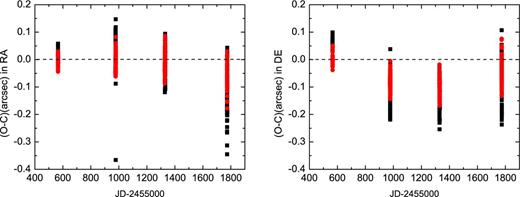
(O−C) residuals of the positions of Phoebe in four years. The hollow diamonds (dark points online) represent the (O−C) before GD correction and the solid diamonds (red ones online) represent the (O−C) after GD correction. The ephemerides used are PH12 and DE431.
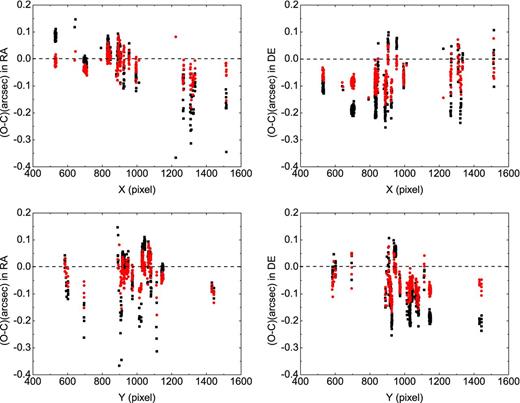
(O–C) residuals of positions of Phoebe. The upper two panels show the (O–C) residuals with respect to the x-coordinate of the CCD chip. The bottom two panels are the (O–C) residuals with respect to the y-coordinate of the CCD chip. The hollow diamonds (dark points online) represent the (O–C) before GD correction and the solid diamonds (red ones online) represent the (O–C) after GD correction. The ephemerides used are PH12 and DE431.
Statistics of (O−C) residuals for Phoebe before and after GD correction for each data set. Column 1 is the date. The second column (‘Before GDC’ or ‘After GDC’) shows the statistics in both directions before or after GD correction. The following columns list the mean (O−C) and its standard deviation (SD) in right ascension and declination, respectively. All units are in arcseconds.
| Date | 〈O − C〉 | SD | 〈O − C〉 | SD | |
|---|---|---|---|---|---|
| RA | DE | ||||
| 2011-01-03 | Before GDC | 0.013 | 0.018 | 0.060 | 0.016 |
| After GDC | −0.004 | 0.018 | 0.004 | 0.024 | |
| 2012-02-18 | Before GDC | 0.021 | 0.047 | −0.162 | 0.038 |
| After GDC | −0.030 | 0.019 | −0.077 | 0.016 | |
| 2012-02-19 | Before GDC | 0.037 | 0.052 | −0.145 | 0.050 |
| After GDC | 0.018 | 0.018 | −0.085 | 0.031 | |
| 2013-02-04 | Before GDC | −0.065 | 0.022 | −0.077 | 0.021 |
| After GDC | −0.033 | 0.022 | −0.066 | 0.020 | |
| 2013-02-05 | Before GDC | 0.005 | 0.031 | −0.190 | 0.044 |
| After GDC | −0.046 | 0.020 | −0.127 | 0.023 | |
| 2013-02-06 | Before GDC | 0.044 | 0.024 | −0.112 | 0.029 |
| After GDC | 0.040 | 0.028 | −0.085 | 0.028 | |
| 2013-02-07 | Before GDC | −0.064 | 0.030 | −0.154 | 0.031 |
| After GDC | 0.008 | 0.028 | −0.111 | 0.024 | |
| 2014-04-25 | Before GDC | −0.188 | 0.064 | −0.004 | 0.049 |
| After GDC | −0.069 | 0.046 | −0.012 | 0.047 | |
| 2014-04-26 | Before GDC | −0.094 | 0.073 | −0.101 | 0.089 |
| After GDC | −0.058 | 0.041 | −0.063 | 0.034 | |
| Total | Before GDC | −0.012 | 0.082 | −0.118 | 0.081 |
| After GDC | −0.018 | 0.041 | −0.071 | 0.041 |
4 DISCUSSIONS
To check and analyse our observations, we make a comparison with an ephemeris. Two modern ephemerides are used to produce the theoretical positions of Phoebe: one, PH12, developed by the IMCCE (Desmars et al. 2013); another, SAT359, developed by JPL via the website http://ssd.jpl.nasa.gov/. Both ephemerides use DE431 to produce the position of Saturn. Table 4 shows the residuals for the telescope by using different ephemerides. We can see both ephemerides show a good agreement, especially in declination. The mean (O–C) is better than 0.1 arcsec in each direction and the dispersion is better than 0.07 arcsec in each direction. It seems that the ephemeris PH12 developed by Desmars et al. (2013) has a slightly better precision than the ephemeris SAT359 of JPL.
Statistics of (O–C) residuals for Phoebe by using different ephemerides. Columns 1 and 2 are the number of observations and the ephemeris (SAT359 from the JPL and PH12 from the IMCCE are the ephemerides for Phoebe, besides, DE431 from the JPL is adopted for the primary planet Saturn). The following columns list the mean (O–C) and its standard deviation (SD) in right ascension and in declination, respectively. All units are in arcseconds.
| N | Ephemerides | 〈O − C〉 | SD | 〈O − C〉 | SD |
|---|---|---|---|---|---|
| RA | DE | ||||
| 346 | SAT359 | 0.034 | 0.064 | −0.076 | 0.049 |
| PH12 | −0.018 | 0.041 | −0.071 | 0.041 |
| N | Ephemerides | 〈O − C〉 | SD | 〈O − C〉 | SD |
|---|---|---|---|---|---|
| RA | DE | ||||
| 346 | SAT359 | 0.034 | 0.064 | −0.076 | 0.049 |
| PH12 | −0.018 | 0.041 | −0.071 | 0.041 |
Compared with the previous observations. Columns 1 and 2 are the observers and the number of observations, respectively. The following columns list the mean (O–C) and its standard deviation (SD) in right ascension and declination, respectively. The ephemerides used in our work are PH12 and DE431. In column 1 P&Z 06 is a short form of Peng & Zhang (2006). All units are in arcseconds.
Compared with the previous observations. Columns 1 and 2 are the observers and the number of observations, respectively. The following columns list the mean (O–C) and its standard deviation (SD) in right ascension and declination, respectively. The ephemerides used in our work are PH12 and DE431. In column 1 P&Z 06 is a short form of Peng & Zhang (2006). All units are in arcseconds.
To compare our observations to previous ones, we provide some major observational statistics of Phoebe from Desmars et al. (2013, see Table 5). It can be seen that our new observations have a smaller dispersion than our previous ones (Peng & Zhang 2006).
From Fig. 2 we can see that our observations have a good dispersion in each year. But as a whole a somewhat systematic trend is apparent over four years, especially in declination. We suggest two possible explanations: first, the main issue may be the existence of zonal errors in the reference star catalogue. The star catalogue released by Gaia will provide better solutions (Mignard et al. 2007). Another reason might come from the ephemeris. More observations are needed to confirm this in future.
Table 6 lists an extract of the observed topocentric apparent positions of Phoebe. The data are presented in the following form: JD denotes the exposure middle time of each CCD frame in the form of Julian Date (UTC). RA, expressed in hours, minutes and seconds are the observed topocentric apparent positions of Phoebe in right ascension. DE, expressed in degrees, arcminutes and arcseconds are the observed topocentric apparent positions of Phoebe in declination. The complete data can be obtained in the data base of Natural Satellites of the IMCCE.
Extract of the observations. The first column lists the exposure middle time of each CCD frame in form of Julian Date (utc). RA and DE are the observed topocentric apparent positions in right ascension and declination, respectively. The whole table is available on the website http://www.imcce.fr/hosted_sites/saimirror/bsapooue.htm.
| Date | RA | DE |
|---|---|---|
| JD | h m s | ° ′ ′′ |
| 245 5565.342 257 | 13 3 23.9800 | −4 6 49.669 |
| 245 5565.344 884 | 13 3 24.0059 | −4 6 49.799 |
| 245 5565.346 331 | 13 3 24.0181 | −4 6 49.891 |
| …… | …… | …… |
| 245 6774.258 037 | 15 17 30.0638 | −15 40 2.078 |
| 245 6774.258 437 | 15 17 30.0590 | −15 40 2.026 |
| 245 6774.258 882 | 15 17 30.0491 | −15 40 2.012 |
5 CONCLUSIONS
In this paper, we present 346 CCD observations of the ninth Saturnian satellite, Phoebe, taken with the 2.4 m telescope at Yunnan Observatory. After GD correction, the positional precision for the satellite Phoebe is found to be improved significantly. Comparisons have been made between the observed positions and the computed ones. The result has shown that after GD correction the mean (O–C) are −0.02 and −0.07 arcsec in right ascension and in declination with respect to IMCCE ephemeris, respectively. The dispersions of our observations are estimated at about 0.04 arcsec in each direction.
This research is financially supported by the National Natural Science Foundation of China (grant nos. 11273014, U1431227, 11403008), by the Natural Science Foundation of Guangdong and partly by the Fundamental Research Funds for the Central Universities. The authors are grateful to the 2.4-m telescope research team for their great help during observations.
REFERENCES
SUPPORTING INFORMATION
Additional Supporting Information may be found in the online version of this article:
Table 6. Extract of the observations.
Please note: Oxford University Press is not responsible for the content or functionality of any supporting materials supplied by the authors. Any queries (other than missing material) should be directed to the corresponding author for the article.
