


1 ERRATUM
The paper ‘Diagnostic line ratios in the IC 1805 optical gas complex’ was published in MNRAS, 420, 2280 (2012). Its fig. 11 reveals a fundamental problem affecting the spectrophotometric properties of the data used in our investigation of the IC 1805 nebula. Regardless of the physical conditions prevailing in the targeted gas volume (e.g. density, temperature, pressure, shock excitation), the relative comparison of the [N ii] λλ6548, 6584 Å fluxes is always expected to approach the 2.94-to-1 ratio theoretically predicted (Osterbrock & Ferland 2006, chapter 5). A non-trivial combination of fluctuations of the interferometer's modulation efficiency, at data acquisition, and an erroneous phase correction, during data reduction, have been recently identified at the origin of the problem found in the original paper (hereafter referred as LJD12). This directly discredits the discussion presented in its Section 5.1. Considering that the [N ii]/[N ii] ratios are inaccurate by roughly 10 per cent, this legitimately raises doubts about the reliability of other line ratios explored in this work (i.e. Hα/[N ii], Hα/[S ii], [S ii]/[S ii]).
Accurate phase correction for pre-2011 SpIOMM (Spectromètre Imageur de l'Observatoire du Mont-Mégantic) observations can rarely be achieved.1 In order to appropriately correct the old 2008 data originally published, new observations of the [S ii] doublet were obtained for the central zone of interest in IC 1805. The new observations were gathered using the facilities of the Observatoire du Mont-Mégantic (OMM) on the night of 2014 November 14 and 15. We used the same device system described in the original work and the same observational parameters listed in the last column of table 1 in Lagrois et al. (2015). The time of exposure per channel was fixed at 70 s with an OMM-standard astronomical seeing slightly above 2 arcsec. The new tridimensional cube was spatially degraded to match the spatial sampling of the original data and both sets of observations were spatially aligned.
Simulations have shown that a fluctuating modulation efficiency combined with an inaccurate phase correction primarily result in an erroneous estimation of the continuum level for each spectrum of the corrupted data (Martin 2014). The amplitude A of each line i.e. the difference between its peak intensity and the continuum level, is therefore misestimated and, by definition, its corresponding flux F ( ∝ A). This led to a miscalculation of the line fluxes in LJD12. Series of simple procedures were closely followed in order to compensate for this effect.
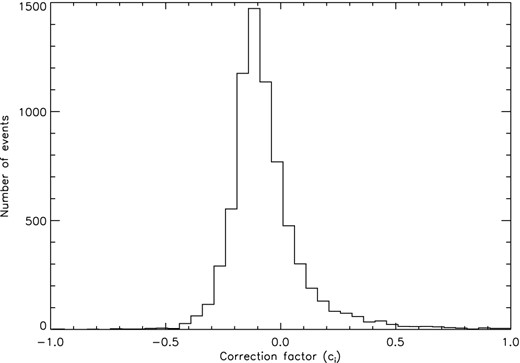
Distribution of the pixel-to-pixel ci values (see text).
![Distribution of the [N ii]/[N ii] ratio following the $\overline{c_{i}}$ correction (see text). To be compared with fig. 11 of LJD12.](https://oup.silverchair-cdn.com/oup/backfile/Content_public/Journal/mnras/448/4/10.1093/mnras/stv159/2/m_stv159fig2.jpeg?Expires=1749951372&Signature=kssUi1E1eKomipMm~Owg1K2MVlDWHBjCuzgjfHN-jKz2Sz4pIWV0HZKbR-p5T5PZCWT2TrrmLgLx6fai9ZuGO6TUXcB~iKfaW-J2vwzXfR4RUmi4Tu2bjRN8Pw-VPZAqEAEm8LhGJ2eIC9Gq4LFL6EZumLSwqdXWbVtCXQIE0H2nBSABsk1mSJ~Fukg1jBDVjYiWaI1HkdpE7gon1rOF555cmQyjrATVxsCrWMKpPm9DJHI55SrKsij9m0YCQSmcV7nR97M8wa1k1co41cOKzF1UeSB40gRIO44V2~W7woznGLM9pQB61Ylv~ej343YNmP6F7gT4NklJ8oSNewxJsg__&Key-Pair-Id=APKAIE5G5CRDK6RD3PGA)
Distribution of the [N ii]/[N ii] ratio following the |$\overline{c_{i}}$| correction (see text). To be compared with fig. 11 of LJD12.
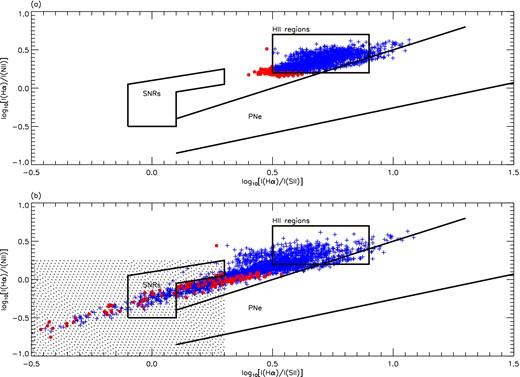
The |$\overline{c_{i}}$| correction was used to re-process all line fluxes investigated in the original work. Fig. 3 can be compared to fig. 12 of the first paper and reveals the impact of the |$\overline{c_{i}}$| correction on the computation of the Sabbadin–Minello–Bianchini diagrams (Sabbadin, Minello & Bianchini 1977). Sizeable differences are barely perceptible at first sight although the log–log display can be misleading. Points, both red and blue, sustained an average displacement of about 0.025 dex with respect to the first results, signifying that the original Hα/[S ii] and Hα/[N ii] ratios were off by approximately 5 per cent to 8 per cent. In the lower panel of Fig. 3, zones identified as candidates for shock-excitation spatially coincide almost perfectly with the original results. The subtraction of the foreground/background contribution is illustrated in Fig. 4 and can be compared to fig. 16 of the original paper. Again, the similarities are striking, indicating that the |$\overline{c_{i}}$| correction does not lead to substantial modifications of the diagnostic diagrams used in the first paper.
To be compared with fig. 12 of LJD12. See the original paper for details.
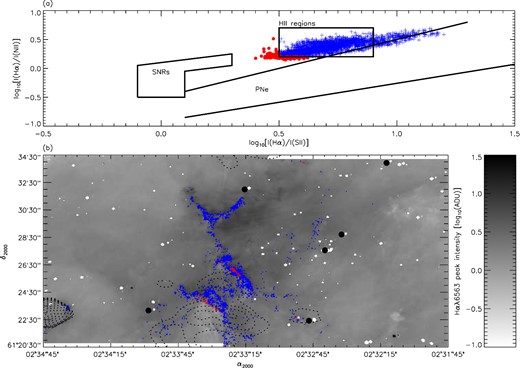
To be compared with fig. 16 of LJD12. See the original paper for details.
On the other hand, the |$\overline{c_{i}}$| correction has a more significant impact on the determination of the density measurements retrieved from the [S ii]/[S ii] ratio. Similarly to [N ii]/[N ii], the [S ii]/[S ii] ratio also sustained variations, on average, fairly close to 10 per cent when compared to the original results. However, the relation between the flux ratio of the [S ii] doublet and the corresponding density being not linear (Osterbrock & Ferland 2006, chapter 5), the impact of the correction on the density measurements largely exceeds 10 per cent. Fig. 5 displays the histogram and spatial distribution of the density measurements following the correction on the continuum level. When compared to fig. 10 of the original paper, one can see that the relative behaviour is approximately preserved in a sense that areas originally characterized by the highest densities remain in a high-density regime following the correction. Same goes for zones of lower densities. However, the |$\overline{c_{i}}$| correction resulted in a substantial shift of the density measurements towards higher values. While the original histogram has a mean of 155 cm−3, the new distribution's first moment now approaches 255 cm−3, an increase of roughly 65 per cent. It seems obvious that the original paper suffers from a sizeable underestimation of the densities retrieved from the [S ii]/[S ii] ratio. At first, we were not concerned about the density measurements retrieved in LJD12 since those were perfectly in agreement with the low-density regime typically found in evolved nebulae. After a closer look however, the points (lines of sight) preserved in our density investigation of the IC 1805 nebula are all spatially coincident with the brightest optical gas located near the centre of our field of view. This material likely corresponds to the photoeroded, undispersed residuals of the molecular fragments that gave birth to the most massive stars of the current Melotte 15 cluster. Hence, measured densities up to a few hundreds of particles per cm3 are totally reconcilable with this scenario and reinforce the legitimity of the |$\overline{c_{i}}$| correction used here.
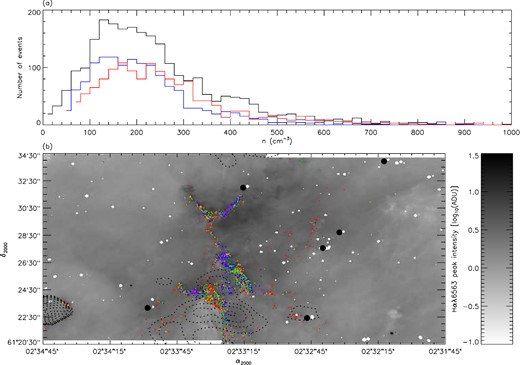
To be compared with fig. 10 of LJD12. See the original paper for details. In the lower panel, densities between 10 and 100 cm−3 (purple dots), 100 and 175 cm−3 (blue dots), 175 and 245 cm−3 (green dots), 245 and 350 cm−3 (orange dots), and 350+ cm−3 (red dots) are displayed.
In the upper panel of Fig. 5, the blue and red distributions again suggest that the subtraction of the foreground/background material is required in order to perceive any signs of gas compression. These subdistributions have means of 210 and 290 cm−3, respectively, compared to 125 and 175 cm−3 in the original work. Fig. 6 provides new results regarding the compression sustained by the ionized material. A quick comparison with fig. 18 of the original paper suggests a slight increase of the compression factor especially attributed to a peak near |$M_{0}^{2}$| ∼ 5 [as opposed to 3–4 in the first paper] and an additional ‘bump’ near |$M_{0}^{2}$| ∼ 15. The mean compression now reaches 10.2, roughly 20 per cent greater than what was obtained previously. The fact that the compression factor does not follow the 65 per cent increase obtained for the density measurements is simply explained by values extracted for |$n_{{diffuse}}$| being also increased by the |$\overline{c_{i}}$| correction. The distinction of compressive regimes between the green and red subdistributions, in Fig. 6, is slightly more clearer when compared to the first results with means now estimated at 8.4 and 12.8, respectively. Means estimated at 7.5 and ∼10, respectively, were obtained in the original paper. The red subdistribution could suggest isothermal shocks with velocities spreading on a relatively wide range between 15 and nearly 45 km s−1. Those velocities are slightly greater than what was originally found (i.e. between 15 and 30 km s−1). Considering the age of the most massive star in the Melotte 15 cluster and assuming a coplanar distance with the zone of interest, it is expected that such shocks would have already collide with the molecular envelopes found in the low central sector of our field of view (Lagrois, Joncas & Drissen 2012, see section 5.2.1). This gives credence to the shock-excitation scenario. We reiterate, from the original paper, that the values extracted here for the compression and shock velocities are higher limits since the density of the pre-shocked gas cannot be accurately determined.
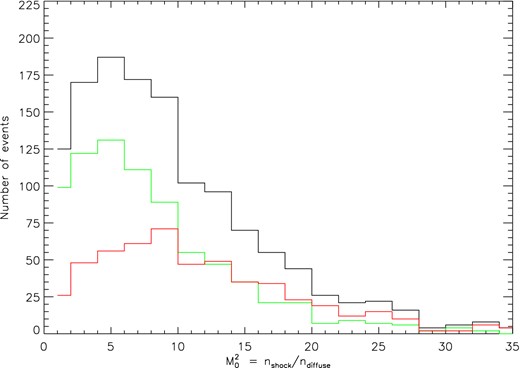
To be compared with fig. 18 of LJD12. See the original paper for details.
We thank Professor Gary J. Ferland for pointing out the issue on fig. 11 of the original paper. We are also very grateful to Thomas Martin whose help and genius largely contributed to the refinement of SpIOMM over the years.
Note that the addition of a second detector to SpIOMM's secondary port in 2011 now largely favours an adequate characterization of the phase parameter (Martin, Drissen & Joncas 2012).
