-
PDF
- Split View
-
Views
-
Cite
Cite
I. M. McHardy, D. T. Cameron, T. Dwelly, S. Connolly, P. Lira, D. Emmanoulopoulos, J. Gelbord, E. Breedt, P. Arevalo, P. Uttley, Swift monitoring of NGC 5548: X-ray reprocessing and short-term UV/optical variability, Monthly Notices of the Royal Astronomical Society, Volume 444, Issue 2, 21 October 2014, Pages 1469–1474, https://doi.org/10.1093/mnras/stu1636
Close - Share Icon Share
Lags measured from correlated X-ray/UV/optical monitoring of AGN allow us to determine whether UV/optical variability is driven by reprocessing of X-rays or X-ray variability is driven by UV/optical seed photon variations. We present the results of the largest study to date of the relationship between the X-ray, UV and optical variability in an AGN with 554 observations, over a 750 d period, of the Seyfert 1 galaxy NGC 5548 with Swift. There is a good overall correlation between the X-ray and UV/optical bands, particularly on short time-scales (tens of days). The UV/optical bands lag the X-ray band with lags which are proportional to wavelength raised to the power 1.23 ± 0.31. This power is very close to the power (4/3) expected if short time-scale UV/optical variability is driven by reprocessing of X-rays by a surrounding accretion disc. The observed lags, however, are longer than expected from a standard Shakura–Sunyaev accretion disc with X-ray heating, given the currently accepted black hole mass and accretion rate values, but can be explained with a slightly larger mass and accretion rate, and a generally hotter disc. Some long-term UV/optical variations are not paralleled exactly in the X-rays, suggesting an additional component to the UV/optical variability arising perhaps from accretion rate perturbations propagating inwards through the disc.
1 INTRODUCTION
The origin of the UV and optical variability in AGN, and its relationship to the X-ray variability, is still a subject of considerable debate. A number of studies (e.g. Uttley et al. 2003; Suganuma et al. 2006; Arévalo et al. 2008, 2009; Breedt 2009; Breedt et al. 2009, 2010; Lira et al. 2011; Cameron et al. 2012; Cameron 2014; Shappee et al. 2014) have shown strong X-ray/UV or X-ray/optical correlations on short time-scales (weeks–months), with lags close to zero days, but poorer correlations on longer time-scales (months–years), usually due to long-term UV/optical trends which are not mirrored in the X-ray variability. These observations suggest that different processes dominate the UV/optical variability on different time-scales. An X-ray/UV correlation on short time-scales could result if the UV/optical emission is produced by reprocessing of X-rays by the nearby accretion disc. The UV/optical would then lag the X-rays by the short light travel time between the X-ray source and the disc. Alternatively, if the X-ray variations are produced by variations in the UV seed photon flux, produced by accretion variations in the disc at very small radii, then the X-rays should lag the UV–optical by that same short light travel time. Thus determining the precise lag between the X-ray and UV–optical emission is a strong diagnostic of the origin of the UV–optical variability.
Almost all previous studies, based mainly on a combination of X-ray monitoring with RXTE and ground based optical monitoring, show short (∼1 d) lags of the X-rays by the optical. However, in no individual case is the lag measured well enough to rule out, unambiguously, that the optical might lead. Ground-based optical monitoring suffers from interruptions by bad weather but the Swift observatory can provide regular simultaneous X-ray, UV (UVW2, UVM2, UVW1) and optical (U,B,V) monitoring, allowing measurement of wavelength-dependent lags Based on Swift observations, Cameron et al. (2012) were able to show B band lagging the X-rays by less than 45 min in NGC 4395 and Shappee et al. (2014), using Swift and ground-based observations, were able to measure interband lags in NGC 2617 which were in good agreement with a reprocessing model. Purely within the optical bands Sergeev et al. (2005) and Cackett, Horne & Winkler (2007) measured lags consistent with a reprocessing origin.
Shappee et al. (2014) observed for 50 d with almost daily sampling following NGC 2617 in outburst. Here, we report on 554 observations of the Seyfert 1 galaxy NGC 5548 over a 750 d period. These observations were largely made as a result of our own proposals but also contain some archival data from other programmes (e.g. Kaastra et al. 2014). Our observations were not scheduled to follow particular flares and so are typical of the long-term behaviour of NGC 5548. This AGN is already known to show a strong X-ray/V-band correlation (Uttley et al. 2003) with an estimated V-band lag of 1-2 days (Suganuma et al. 2006; Breedt 2009). However no simultaneous monitoring of the X-rays with any other optical or UV band has yet been reported.
In Section 2, we discuss the Swift observations and light curves and in Section 3, we discuss the interband correlations and lags on both long and short time-scales. In Section 4, we compare our lag measurements to those expected from reprocessing from a standard Shakura & Sunyaev (1973) accretion disc model, and in Section 5, we discuss the implications of our results for the origin of the variability in the optical, UV and X-ray bands in Seyfert galaxies.
2 Swift OBSERVATIONS
The Swift X-ray observations are made by the X-ray Telescope (XRT; Burrows et al. 2005) and UV and optical observations are made by the UV and Optical Telescope (UVOT; Roming et al. 2005). The XRT observations were carried out in photon-counting mode and UVOT observations were carried out in image mode. These data were analysed using our own pipeline which is based upon the standard Swift analysis tasks as described in Cameron et al. (2012). X-ray data are corrected for the effects of vignetting and aperture losses and data obtained when the source was located on known bad pixels, or with large flux error (>0.15 count s−1) are rejected. Unless otherwise stated, we use the 0.5–10 keV X-ray band. Occasional UVOT data points were seen to lie 15 per cent or more below the local mean, usually as a result of extremely rapid drops. All such data points were examined individually and some were found to be the result of bad tracking and were rejected. The rest occur when the image falls on particular areas of the detector, suggesting one or more bad pixels. All such data were removed.
Here, we consider the long, well-sampled, period from MJD−50000 of 5960 to 6709, although there are a small number of earlier observations. Dates hereafter are in these units. Observations, mostly of 1 ks though sometimes of 2 ks, typically occurred every 2 d although periods of less frequent (4 d) or more frequent (1 d) sampling occurred. Each observation was usually split into two or more individual visits, improving time sampling. In total 554 visits were made. After rejection of bad data 465 X-ray measurements remain, with 300 occurring between day 6383 and 6547. Initially, we restricted our UVOT observations to UVW2, following guidelines to reduce filter wheel rotations. Later, we relaxed the rotation constraint and additional filters were used.
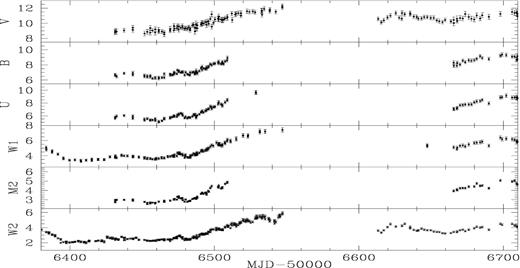
The UVW2 band was sampled in almost all visits and the resultant X-ray count rate and hardness ratio (H = 2–10 keV; S = 0.5–2 keV), and UVW2 flux light curves, at the highest available time resolution, are shown in Fig. 1 (Kaastra et al. 2014, S4, show a 1 d binned version of this figure). The gaps centred on 6220 and 6580 result from Swift sun-angle constraints. We see a generally close correspondence between the X-ray and UVW2 flux light curves as noted previously between the X-ray and V bands by Uttley et al. (2003). The correspondence on short time-scales (∼10 d) is strong but the amplitudes of variability on longer time-scales are not always identical, e.g. from day 6470 to 6550 when UVW2 shows a strong upward trend but with a much weaker trend in the X-rays. From day 6380, observations were made in additional UVOT filters and the resultant light curves are shown in Fig. 2. We see a close correspondence between all UVOT bands.
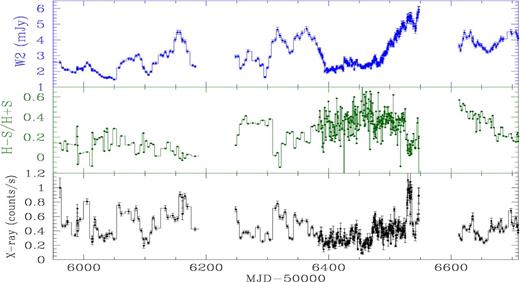
Bottom panel: long-term Swift 0.5–10 keV X-ray count rate; middle panel: X-ray hardness ratio, where H = 2–10 keV count rate and S = 0.5–2 keV count rate; and top panel: UVW2 flux.
3 X-RAY/UV–OPTICAL CORRELATIONS
3.1 X-ray/UVW2 correlation
The UVW2 band is the best sampled of the UVOT bands and in Figs 3 and 4 we show the discrete (DCF; Edelson & Krolik 1988) and interpolation (ICCF; Gaskell & Sparke 1986) cross-correlation functions (CCFs; see also White & Peterson 1994) for the complete X-ray and UVW2 data sets from day 5960 to 6710. Only the more slowly varying UVW2 band is interpolated. We do not interpolate over the two large gaps but take the weighted mean ICCF of the three sections seen in Fig. 1. The N per cent confidence levels are defined such that if correlations are performed between the observed UVW2 data and randomly simulated X-ray light curves with the same variability properties as the observed data (e.g. Summons 2007), only (100 − N) per cent of the correlations would exceed those levels (e.g. see Breedt et al. 2009, for more details). The confidence levels are appropriate to a single trial, i.e. a search at zero lag, approximately what we are investigating here. Both functions show a broad, but highly significant correlation, peaking near zero lag, with the DCF favouring UVW2 lagging the X-rays by about a day.
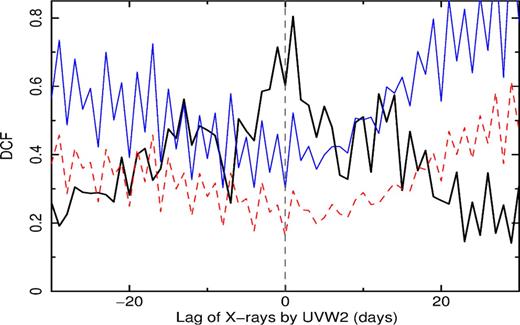
Discrete cross-correlation function between the X-ray and UVW2 light curves shown in Fig. 1. The 95 per cent (dashed red) and 99.99 per cent (solid thin blue) confidence levels are also shown.
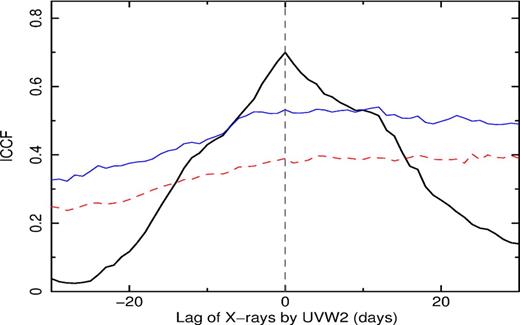
Interpolation cross-correlation function between the X-ray and UVW2 light curves shown in Fig. 1. The 95 per cent (dashed red) and 99 per cent (thin blue) confidence levels are also shown.
CCFs can be distorted when there is a long-term variation in the mean level in one light curve which is not present in the other and so it is recommended practice to subtract a running mean (Welsh 1999). We therefore subtracted a mean based on a running boxcar of width 20 d from both UVW2 and X-ray light curves. As 300 of the 465 good X-ray data points lie within the intensively sampled period from 6383 to 6547 whose data dominate the measurement of short time-scale lags, we concentrate on this period where ∼2 visits per day are made. As the separation between visits is not uniform, good sampling of sub-daily variations is provided. The resulting 20 d mean-subtracted UVW2 and X-ray light curves for the intensive period are shown in Fig. 5.
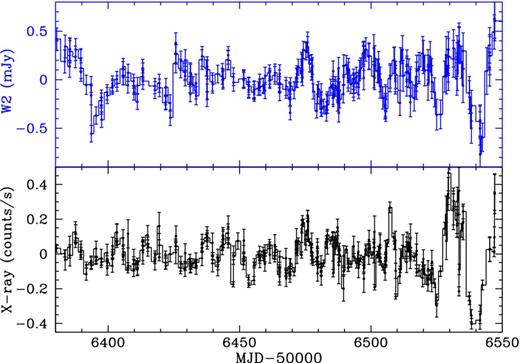
Swift 0.5–10 keV X-ray (bottom panel) and UVW2 (top panel) light curves for the intensively sampled period. The mean level from a 20 d running boxcar has been subtracted from both light curves.
We have calculated a variety of DCFs, ICCFs and ZDCFs (Alexander 2013, Fig. 6), and all show a UVW2 lag of ∼1 d. Subtracting a 40 d running mean gives a similar result.
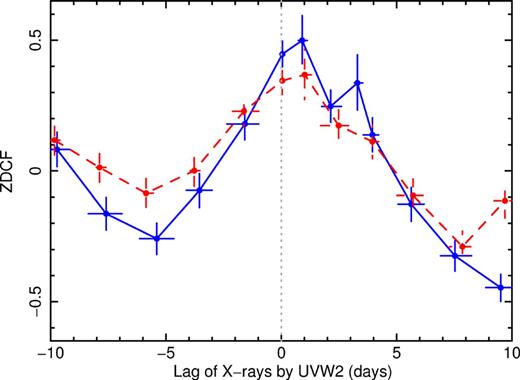
ZDCF between the X-ray and UVW2 light curves from day 6383 to 6547. The blue line is the result when both X-rays and UVW2 have been mean subtracted using a 20 d running boxcar (Fig. 5) and the dashed red line is the result when only the UVW2 has been mean subtracted.
To refine the lag measurement, we followed Shappee et al. (2014), and the recommendation of Pancoast, Brewer & Treu (2014), and calculated the distribution of likely lags from 10 000 simulations for the data from day 6383–6547 using the javelin cross-correlation program (Zu, Kochanek & Peterson 2011; Zu et al. 2013). We allowed a search range of ±10 d. javelin assumes a similar pattern of variability in both bands. Although the X-ray and UVW2 variability properties will be slightly different, the lag measurement should not be noticeably affected (Shappee et al. 2014). The resulting lag distribution is shown in Fig. 7 (left-hand panel). The median UVW2 lag is +0.70| $^{+0.24}_ {-0.27}$ | d where the errors are the standard javelin 16 and 84 per cent probability levels. Changing the observation period does not noticeably change the result; e.g. for the period 6248–6547 the derived lag is +0.79| $^{+0.21}_ {-0.32}$ | d and if we use the whole data set from 5960 to 6710, the lag is 0.62 ± 0.35 d. When applied to the non-mean-subtracted light curves, javelin does not converge to the single distribution of Fig. 7 but produces a wide, multimodal distribution, presumably due to the presence of uncorrelated long time-scale variations. We have also calculated separately the UVW2 hard band and UVW2 soft band lags. There is no measurable difference.
3.2 X-ray spectral and UVW2 variations
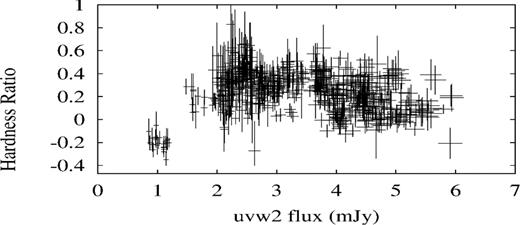
The X-ray spectral variations of NGC 5548 have been studied extensively, e.g. Sobolewska & Papadakis (2009) and Kaastra et al. (2014), with the latter showing absorption variability on different time-scales, together with intrinsic luminosity variations. In Fig. 1, there is a general trend for NGC 5548 to become softer with increasing UVW2 and X-ray flux (as noted by Kaastra et al. 2014). In Fig. 8, we plot hardness ratio versus UVW2 flux. There is a great deal of scatter in this relationship but the source is generally brighter in the UVW2 band when it is softer. However, the very softest observations occur at the very lowest fluxes. Broadly similar behaviour within the X-ray band is seen by Connolly, McHardy & Dwelly (2014) in NGC 1365. They explain the spectral variations with a combination of intrinsic luminosity variations and luminosity-dependent obscuration in the context of a wind model, similar to Kaastra et al. (2014). At the lowest fluxes only, the soft unabsorbed component, scattered from the wind, is visible. The lack of dependence of X-ray/UVW2 lag on X-ray energy suggests that changing absorption does not change the relative paths taken by the various bands, although it may change the relative amplitudes, and so is not the main cause of the lags. These spectral variations will be discussed in a future paper (Connolly et al., in preparation).
3.3 UVOT interband lags
All the UVOT bands show the same long-term trends and so it is not necessary to mean subtract the light curves. We therefore simply use all available data, as shown in Fig. 2, and calculate the lag distributions between UVW2 and the other UVOT bands with javelin. Some distributions, such as the example shown (Fig. 7, right-hand panel), are slightly asymmetric. Use of the mode rather than the median would slightly reduce the lags in some cases but the differences are small. The X-ray, W1 and V bands have the best overlap with W2 but we show the lags from all bands. The lags, relative to the UVW2 band, of the UVM2, UVW1, U, B and V bands are | $-0.01^{+0.09}_{-0.13}$ |, | $0.18^{+0.28}_{-0.23}$ |, | $0.87^{+0.36}_{-0.33}$ |, | $0.57^{+0.39}_{-0.35}$ | and | $1.35^{+0.33}_{-0.35}$ | days, respectively.
3.4 Lags and X-ray reprocessing
All UVOT bands lag the X-rays with lags which broadly increase with wavelength (Fig. 9). We can compare the lags with the prediction of reprocessing from a simple accretion disc where the lag should vary as the 4/3 power of wavelength (e.g. Cackett et al. 2007; Lira et al. 2011). Fitting a simple model of the form lag = A + (B × λ)β, and assuming Gaussian distributed errors, we find that A = −0.70 ± 0.21, β = 1.23 ± 0.31 and B = 3.2 ± 0.6 × 10⁻³. The fit χ2 is 2.1 with 3 d.o.f. The fit goes straight through the X-ray point so if the lags are measured relative to the X-rays then, unlike Shappee et al. (2014), no additional unphysical offset to the X-ray point is required. The slope, β, is however similar to that derived by Shappee et al. (2014) for NGC 2617 (1.18 ± 0.33), when including a fit offset.
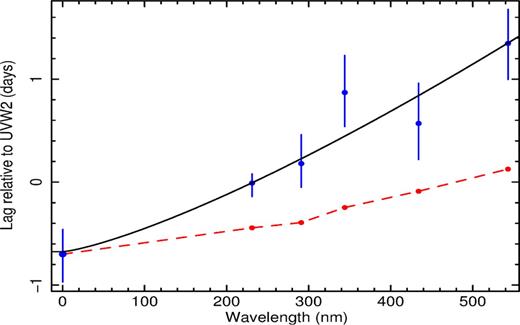
Lag of the X-ray and other UVOT bands relative to UVW2. Lag ∝ wavelengthβ, where β = 1.23 ± 0.31. The lower, dashed, red line is the prediction for a standard disc as described in the text.
This fit shows that reprocessing of X-ray emission from an accretion disc provides a very good explanation for the short-term UV/optical variability in NGC 5548.
4 ACCRETION DISC MODELLING
To determine whether a disc consistent with other observed properties of NGC 5548 can explain the lags, we model the disc following the prescription in Lira et al. 2011 (cf. Cameron 2014) which includes X-ray as well as gravitational heating. X-ray heating depends on extrapolation of the observed 2–10 keV luminosity (Lx2-10) to ∼0.01–500 keV, and on the disc albedo. The height, H, of the X-ray source above the disc, assuming a lamp-post geometry, and the inner disc radius, Rin, are also important parameters.
Assuming a black hole mass MBH (6.7 × 10⁷ M⊙; Bentz et al. 2007) and accretion rate | $\dot{m}_{{\rm E}}$ | (∼0.03–0.04 of Eddington; Pounds et al. 2003; Vasudevan et al. 2010), high X-ray heating luminosity corrected for albedo of 6 × Lx2-10, implying a low albedo of 20 per cent, H = 6 Rg, consistent with X-ray source sizes measured by other methods (Chartas et al. 2009, 2012; Emmanoulopoulos et al. 2014) and Rin = 6 Rg, the innermost stable circular orbit for a Schwarzchild black hole, we obtain the predicted lags shown as a dashed line in Fig. 9. These predicted lags for this standard disc, following impulse X-ray illumination, represent when half of the reprocessed light has been received. The peak response may be even faster.
To increase the predicted lags to agree with observation, in this homogeneous disc model, we have to change the geometry (e.g. H = 20 Rg, Rin = 20 Rg) and require a larger (MBH = 108 M⊙) and hotter (| $\dot{m}_{{\rm E}} = 0.06$ |) disc. Increased disc temperature is more important here than disc flaring. In Fig. 10, we compare the model flux distributions for the above parameters as a function of radius in the W2, W1 and V bands, which are the best sampled, with the radii estimated from the lags. There is reasonable agreement. These lags will be modelled in more detail in a future paper (Lira et al., in preparation).
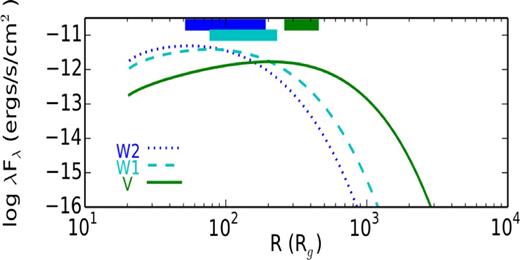
Disc emissivity profile in W2, W1 and V bands (lines) for the parameters given in the text, with measured lags, relative to the X-ray bands, as bars at the top. The W1 bar lies below the W2 and V band bars.
5 DISCUSSION
Longer than expected lags. Although the wavelength-dependent lags in Fig. 9 strongly support the hypothesis that reprocessing of X-rays is the major cause of short time-scale UV/optical variability in AGN, our observations imply that the reprocessed emission comes further from the black hole than expected for a ‘standard’ accretion disc. By pushing the parameter limits, we can reconcile prediction and observation but we note that Morgan et al. (2010) also require a larger than expected disc to explain their microlensing observations. They suggest a low radiative efficiency, which is consistent with our requirement for Rin ≥ 20 Rg. An alternative solution is provided by Dexter & Agol (2011) who propose inhomogeneous discs where the outer portions will contribute more flux than for a uniform disc, causing the disc to appear larger.
Long time-scale UVOT variability. Short time-scale X-ray/UVW2 correspondence is very good, and also generally good on long time-scales, but from day ∼6470 to 6547 the rise in the UV/optical is significantly more pronounced than in X-rays, until ∼6525 when a large X-ray outburst starts. The UV/optical rise might be associated with an inwardly propagating increase in accretion rate which eventually hits the X-ray emission region. However, unless the ratio of disc scaleheight to radius is larger than the normally assumed value of 0.1, or the accretion rate increase propagates not through the disc but through a corona over the disc, or the perturbation starts at small radius (∼20舁Rg), this explanation is not viable as the viscous time-scales from 100 Rg are too long (∼10 years; cf. Breedt et al. 2009).
The relevance of seed photon variations. Although it is possible, by eye, to suggest periods when the UV–optical might lead on short time-scales (e.g. day 6150), such periods are rare and may just be statistical fluctuations. On average, the X-rays lead. Although this observation is simply explained by assuming that all X-ray variability is generated within the corona, one might ask why variations in seed photon flux, where we would expect the UV–optical emission to lead, appear to have little effect on the measured lags. We suggest that the answer is provided by a combination of relative solid angles and conservation of photons during the X-ray scattering process. Compton scattered X-ray photons have energies 10–100 times greater than the seed photon energy. As the disc fills a large fraction of half the sky as seen by the X-ray source, a large fraction of the Compton scattered photons will hit the disc, out to radii beyond the source of most of the seed photons. If these photons are absorbed by the disc, leading to blackbody emission without conservation of photon number, the resultant number of lower energy UV–optical photons produced may exceed the initial seed photon fluctuation. This process could also add a further delay to the optical light curves, aiding agreement with observation.
This work was supported by STFC grant ST/J001600/1. PL acknowledges grant Fondecyt 1120328. JG gratefully acknowledges the support from NASA under award NNH13CH61C.
REFERENCES


