


Abstract
We report the results from a 19-h integration with the Spectral and Photometric Imaging REceiver (SPIRE) Fourier Transform Spectrometer aboard the Herschel Space Observatory which has revealed the presence of a molecular outflow from the Cosmic Eyelash (SMM J2135−0102) via the detection of blueshifted OH absorption. Detections of several fine-structure emission lines indicate low-excitation H ii regions contribute strongly to the [C ii] luminosity in this z = 2.3 ultra-luminous infrared galaxy (ULIRG). The OH feature suggests a maximum wind velocity of 700 km s− 1, which is lower than the expected escape velocity of the host dark matter halo, ≈ 1000 km s− 1. A large fraction of the available molecular gas could thus be converted into stars via a burst protracted by the resulting gas fountain, until an active galactic nucleus (AGN)-driven outflow can eject the remaining gas.
1 INTRODUCTION
With only 10–30 per cent of the gas of a giant molecular cloud (GMC) undergoing conversion into stars, and another 40 per cent of that returning to the interstellar medium (ISM) through supernovae and stellar winds, star formation is an inefficient process (Murray 2011). The rapid dispersal of GMCs by the combined radiation and mechanical pressure exerted by newly formed massive stars is responsible for this inefficiency, lowering the intensity but extending the duration of the star formation resulting from an initial quantity of molecular material. This is visible in the relatively small observed reduction in the gas available for star formation since z ∼ 2 (of the order of 10×; e.g. Carilli & Walter 2013), and in the similar decrease in the cosmic star formation rate (SFR) in galaxies over the same period (e.g. Behroozi, Wechsler & Conroy 2013; Sobral et al. 2014). Conversion to stars is not the only fate of molecular gas; stellar feedback, along with that from active galactic nucleus (AGN), is also capable of expelling interstellar material from a galaxy entirely (Veilleux, Cecil & Bland-Hawthorn 2005).
Occurring as galaxy-scale superwinds, these outflows are observed locally to be primarily powered by star formation, excluding those generated in late-stage galaxy mergers, which are typically driven by AGN (Veilleux et al. 2013). Superwinds seem to be more common and powerful at high redshift (e.g. Weiner et al. 2009; Banerji et al. 2011) where the majority of outflowing gas arises from strongly star-forming, high-mass galaxies and the outflow strength increases with SFR surface density ΣSFR (Newman et al. 2012). Supernovae (Strickland & Heckman 2009), stellar winds (Murray, Quataert & Thompson 2005), radiation pressure (Murray, Ménard & Thompson 2011) and cosmic rays (Uhlig et al. 2012) may all contribute to the driving pressure. While star formation is expected to produce wind velocities as high as 700 km s−1 (Martin 2005), this may be insufficient for the material to escape the global potential well, leading to a ‘fountain’: material subsequently falls back, leading to star formation over a time-scale much greater than that of the original burst (Hopkins et al. 2013a). AGN may be required for complete expulsion of gas to the surrounding medium, since some seem able to drive outflow velocities of over 1000 km s−1 (Rupke, Veilleux & Sanders 2005; Spoon et al. 2013).
As with the ISM from which it originates, a superwind is expected to comprise multiple gas phases moving with different velocities (e.g. Rupke et al. 2005; Feruglio et al. 2010). Whilst observations of X-ray and UV absorption lines have indicated ionized and neutral atomic components (e.g. Kornei et al. 2012), the presence of molecular gas may also be required (depending on the time-scale for material to cycle from atomic to molecular) if future star formation is to be reduced. CO and OH are the most common non-H2 molecules at the temperatures and densities involved, with outflows inferred from observations of both species towards local galaxies and QSOs (e.g. Sakamoto et al. 2009; Fischer et al. 2010), indicating a correlation between AGN luminosity and maximum outflow velocity (Spoon et al. 2013; Veilleux et al. 2013), and showing that outflows are prevalent among local ultra-luminous infrared galaxies (ULIRGs).
OH is particularly well suited for tracing molecular gas in galactic winds. It possesses a dipole moment ∼15× that of CO. Due to the high densities required to thermalize OH rotational transitions ( ∼ 109 cm− 3; Storey, Watson & Townes 1981), the strongest OH line is typically the ground-state absorption |$^{16}{\rm OH} \; ^2\Pi _{3/2} J \; \!= \! {\frac{3}{2}} \! \rightarrow \! {\frac{5}{2}}$|, split by lambda-doubling into rest-frame 119.233 and 119.441 μm transitions. Back-lit molecular gas provides a prime opportunity to observe these transitions, with a blueshift expected from the radial movement of an outflow.
Despite the likely higher prevalence of superwinds at high redshift, and the potential advantages of observing OH, the far-infrared (FIR) rest-frame wavelengths of these transitions necessitate the use of space-based facilities. The consequential small apertures have meant that observations have been restricted to local galaxies (e.g. Spoon et al. 2013; Veilleux et al. 2013). Previous studies of high-redshift outflows have generally utilized UV lines (e.g. Steidel et al. 2010; Martin et al. 2012), which are generated within ionized material and thus insensitive to any molecular phase, critical to determination of whether superwinds or in situ star formation dominates the reduction in interstellar molecular gas and SFR density at early epochs.
Gravitational lensing provides a means to circumvent these limitations. The galaxy, SMM J2135−0102, hereafter SMM J2135, was identified in the field of a massive, lensing cluster via ground-based 870 μm imaging (Swinbank et al. 2010). Subsequent imaging with high spatial resolution constrained the lensing model, showing that SMM J2135 is resolved into an ∼ 5 arcsec long arc, mirrored about the critical curve, with a total magnification μ = 37.5 ± 4.5 (Swinbank et al. 2011). CO measurements of its velocity field reveal a disc with rotation speed 320 km s− 1, dominated by several star-forming clumps, each of radius 100–200 pc, distributed across a radius of ∼ 2 kpc.
Here, we describe the discovery of a molecular outflow from SMM J2135, as betrayed by the detection of the 119 μm OH transition in absorption during a number of long integrations with the Herschel Space Observatory. Throughout, we use Planck 2013 cosmology (Planck Collaboration et al. 2013) with H0 = 67.8 km s− 1 Mpc− 1, Ωm = 0.307 and |$\Omega _\Lambda = 0.693$|.
2 OBSERVATIONS
Due to its high magnification, correspondingly high FIR flux densities and previous in-depth studies (e.g. Ivison et al. 2010; Danielson et al. 2011, 2013), SMM J2135 was included in our programme of deep Herschel (Pilbratt et al. 2010) Spectral and Photometric Imaging REceiver (SPIRE) FTS (Griffin et al. 2010) observations (e.g. Valtchanov et al. 2011; George et al. 2013, George et al., in preparation).
We initially observed SMM J2135 as part of ot1_rivison_1: a 3.8-h integration using the central detectors of the SPIRE arrays, comprising 200 scans with the FTS mirror. The data were processed using the Herschel data processing pipeline (Fulton et al. 2010) within the Herschel Interactive Processing Environment (Ott 2010) v11. The local background was estimated as the mean spectrum observed by the rings of detectors surrounding the central detector.
The resulting spectrum covering |$\lambda _{\rm obs} = {\rm 194-671\,\mu {\rm m}}$| provided strong detections of several fine-structure lines, along with a tentative indication of OH absorption. We then obtained five additional 3.8-h integrations as part of ot2_rivison_2, processing these using the same method as the first observation, in order that the spectra may be co-added. We rejected one of these, due to inconsistencies across several wavelength ranges likely caused by poor background estimation as a result of one of the surrounding detectors producing corrupt data. The combined integration time of the useful data is therefore 19 h.
3 RESULTS AND DISCUSSION
The continuum-subtracted rest-frame stack of our observations provides a significant detection of [C ii], as previously identified by Ivison et al. (2010), alongside new detections of [N ii] 122 μm, [O iii] 88 μm and [O i] 63 μm. The previous, tentative indication of OH absorption is confirmed.
The low angular resolution of the SPIRE FTS is unable to spatially resolve individual kinematic components within SMM J2135, instead producing a galaxy-integrated spectrum. The velocity separation of the clumps partially alleviates this complication, however, allowing a comparison of the detected lines with the previous CO measurements. The stack at 119.233 μm is displayed in Fig. 1, along with a comparison of the OH absorption with the rest-frame fine-structure emission lines.
![Left: rest-frame stack centred on the OH 119.233 μm line at z = 2.325 91, the low-J luminosity-weighted redshift derived in Swinbank et al. (2011). The continuum flux level is normalized to that from the spectral energy distribution (SED; Ivison et al. 2010). The vertical black dashed lines demarcate the region displayed in the right-hand plot. Right: zoom-in on the OH absorption line with the rest-frame primary atomic and ionic fine-structure emission lines in the SPIRE FTS spectral range overplotted. The lensing amplification as a function of velocity is shown as a dotted black line, suggesting a higher amplification for [C ii] relative to the other emission lines. Note that the SPIRE FTS produces a sinc line profile, with a width constant in frequency, and that all of the atomic and ionic lines are spectrally unresolved. Vertical dashed lines are displayed at the velocities of the CO bright clumps identified in Danielson et al. (2013). The vertical shaded region corresponds to the derived median and 1σ velocity of the OH feature assuming two identical components and corresponds to a shift of − 240 ± 110 km s− 1 relative to the CO clump ‘X’, which contains the densest molecular gas, and which we associate with the primary source of the [N ii], [O iii] and [O i] emission (see Section 3.1).](https://oup.silverchair-cdn.com/oup/backfile/Content_public/Journal/mnras/442/2/10.1093_mnras_stu967/1/m_stu967fig1.jpeg?Expires=1749978533&Signature=KBPQgzqi2cHHierNcGd6HMidXLxwP-8Pbd7v0IT3SJfiFA4t4TOkzWdcXBrrB0qdoXctnkRawyIZ~cnxzaB5mJUjQZsCpGDcw3RoxBD5fCS01TL5X3uA5twwMzEoVfkJMx7~Ie1Kvs-kn03HPyaEJgoBeVu~rCdGOePv8nLb0MRFHko-B6flzvBTdHMNYtqvtlukQubzswfLnC6eONZg1M2dVN~VtCnp9dKwVCmLuJgQWBVaV~7y2-eGTrzpxDriIak2M9dGjEe3KSrll3A8FC2jESRsDzRfVP0xf9cGUJ6ZQAPDHdUdx2-r559DdEIwQm3lZcj2-nMI3eFphhNing__&Key-Pair-Id=APKAIE5G5CRDK6RD3PGA)
Left: rest-frame stack centred on the OH 119.233 μm line at z = 2.325 91, the low-J luminosity-weighted redshift derived in Swinbank et al. (2011). The continuum flux level is normalized to that from the spectral energy distribution (SED; Ivison et al. 2010). The vertical black dashed lines demarcate the region displayed in the right-hand plot. Right: zoom-in on the OH absorption line with the rest-frame primary atomic and ionic fine-structure emission lines in the SPIRE FTS spectral range overplotted. The lensing amplification as a function of velocity is shown as a dotted black line, suggesting a higher amplification for [C ii] relative to the other emission lines. Note that the SPIRE FTS produces a sinc line profile, with a width constant in frequency, and that all of the atomic and ionic lines are spectrally unresolved. Vertical dashed lines are displayed at the velocities of the CO bright clumps identified in Danielson et al. (2013). The vertical shaded region corresponds to the derived median and 1σ velocity of the OH feature assuming two identical components and corresponds to a shift of − 240 ± 110 km s− 1 relative to the CO clump ‘X’, which contains the densest molecular gas, and which we associate with the primary source of the [N ii], [O iii] and [O i] emission (see Section 3.1).
3.1 Atomic and ionic fine-structure lines
To determine the properties of the observed FIR lines, we fitted each with a sinc profile, as appropriate for an FTS spectrum (Swinyard et al. 2014). The resulting line measurements are detailed in Table 1, with errors conservatively estimated as the maximum obtained via the use of two methods.
FIR line properties from fitting sinc profiles (as appropriate for an FTS), with errors determined via jackknife data sets. All fine-structure lines are unresolved (1.44 GHz FWHM), with luminosities calculated using the lensing amplification factors derived for their observed velocities (Swinbank et al. 2011). The OH properties were derived by integrating over all flux less than the continuum level and assuming two identical components, and assume an amplification corresponding to a source velocity of 400 ± 50 km s− 1.
| Transition | Velocitya | Flux | Amplification | Luminosity | |
|---|---|---|---|---|---|
| (μm) | (km s−1) | (Jy km s−1) | (109 L⊙) | ||
| Low-J CO | 0 | 37.5 ± 4.5 | |||
| [C ii] | 158 | 100 ± 140 | 280 ± 80 | 50 ± 20 | 1.2 ± 0.6 |
| [N ii] | 122 | 290 ± 100 | 60 ± 30 | 36 ± 12 | 0.5 ± 0.3 |
| [O iii] | 88 | 330 ± 130 | 50 ± 40 | 35 ± 17 | 0.6 ± 0.5 |
| [O i] | 63 | 400 ± 90 | 50 ± 30 | 33 ± 12 | 0.8 ± 0.6 |
| OH | 119 | 160 ± 110 | −180 ± 60 | 33 ± 5 | −1.6 ± 0.6 |
aVelocities are relative to the low-J CO luminosity-weighted redshift of z = 2.325 91 (Swinbank et al. 2011).
The first method involves applying the jackknife technique to the individual FTS scans (200 for each observation). We generate 20 subsets of 190 scans, neglecting 10 consecutive scans at a time, fit a sinc profile to each line and determine the variance of the fit parameters from the 20 subsets. The second method requires cutting a region around each spectral line, estimating the variance and standard deviation of the variance of that region. Best-fitting and 1σ line parameters are then calculated such that subtracting a sinc profile with those values returns residuals with the estimated and 1σ variances.
Intriguingly, several of the fine-structure line velocities appear to be offset from the literature redshift, derived from intensity-weighted low-J CO emission, used to define the zero velocity in Fig. 1 and Table 1, with the H ii region lines at higher velocities than [C ii] 158 μm, a photo-dissociation region (PDR) line. We observe the peak [O i] 63 μm emission at 400 ± 90 km s− 1, an unexpected value given the status of this transition as a primary coolant of dense PDRs, and hence typically colocated with [C ii]. The CO component, ‘X’, was identified in Danielson et al. (2011, 2013) to be the most active site of massive star formation in SMM J2135, with a velocity of ∼ 400 km s− 1. The [N ii] and [O iii] transitions require the presence of an ionizing source, and considering the large uncertainties on the velocity offsets, we associate these lines with this CO component, acknowledging that the molecular and ionized gas may not be completely cospatial. The material traced by these lines appears to be very different from that observed in CO and with the Submillimeter Array (SMA), with individual line profiles displaying no structure, although the spectral resolution of the FTS may smear out finer details.
In contrast to several other high-redshift starbursts (e.g. Ferkinhoff et al. 2011; Valtchanov et al. 2011), we observe a line-to-continuum flux deficit similar to that seen in local ULIRGs (Luhman et al. 2003). Most of the FIR lines have luminosity-to-LFIR ratios slightly below the mean of those of the local Brauher et al. (2008) sample (Fig. 2), consisting of low-redshift normal star-forming galaxies, starbursts and AGN, compared to which SMM J2135 possesses an order-of-magnitude higher FIR luminosity. A comparison (Fig. 2) to the z ∼ 0.1 ULIRG sample of Farrah et al. (2013) reveals comparable line luminosities and Lline-to-LIR ratios in SMM J2135, with the exception of [N ii] which is stronger in SMM J2135 than for any galaxy in that study.
![Properties of the atomic and ionic fine-structure lines. Upper left: comparison of line luminosities in SMM J2135 (filled square) with local ULIRGs (coloured open circles, colour map as in lower-left plot; Farrah et al. 2013) and local galaxies of various types (black open triangles; Brauher, Dale & Helou 2008). The line $L_{\rm [N\,\small {ii}]}= 0.1 L_{\rm [C\,\small {ii}]}$ is shown in grey. Upper right: mean line-to-FIR luminosity ratios for several lines in the Brauher et al. (2008) sample. SMM J2135 values are denoted by squares. Lower left: line-to-IR luminosity ratios in Farrah et al. (2013) and SMM J2135 (square). Colour map displays the fractional contribution of AGN to Lbol, with marker area proportional to Lbol. Lower right: estimated χ2 contours for CO clump, ‘X’ (Danielson et al. 2011), of SMM J2135 (red) overlaid on the PDR surface temperature model from Kaufman, Wolfire & Hollenbach (2006), suggesting n and G0 values of 102-3 (see text for caveats).](https://oup.silverchair-cdn.com/oup/backfile/Content_public/Journal/mnras/442/2/10.1093_mnras_stu967/1/m_stu967fig2.jpeg?Expires=1749978533&Signature=4duBn0sMqvx5BBiOZSs0BtzgbsVQ0dRYhBgG2yL~9uCZS6DjWXyzfl3RN6FrHykF1~LcsydM5yUmbHjbZgsEpluIyBfSep7GhHWmzAcz2OFa5yoN9kgfvpzx2j0RlcpDKT68hSoBNiVK6-i~5pb3VmFAwAn-~o1U20rPxwvBzq-jh8sLoyp6Lp8Ez7fNEsoT2-HzjxPOAEpb17MpdvdtWtfsON0rOS0uz594sRyiGMyzcn32EjI26gKbuOPfWwIeSgC6r7eZQaY1z6mPMu7EkwDdcmLaiFXRGhulis~NCmspuJMtby82om6sx~jSDCIb7651Ccg226ieuWPal70Axw__&Key-Pair-Id=APKAIE5G5CRDK6RD3PGA)
Properties of the atomic and ionic fine-structure lines. Upper left: comparison of line luminosities in SMM J2135 (filled square) with local ULIRGs (coloured open circles, colour map as in lower-left plot; Farrah et al. 2013) and local galaxies of various types (black open triangles; Brauher, Dale & Helou 2008). The line |$L_{\rm [N\,\small {ii}]}= 0.1 L_{\rm [C\,\small {ii}]}$| is shown in grey. Upper right: mean line-to-FIR luminosity ratios for several lines in the Brauher et al. (2008) sample. SMM J2135 values are denoted by squares. Lower left: line-to-IR luminosity ratios in Farrah et al. (2013) and SMM J2135 (square). Colour map displays the fractional contribution of AGN to Lbol, with marker area proportional to Lbol. Lower right: estimated χ2 contours for CO clump, ‘X’ (Danielson et al. 2011), of SMM J2135 (red) overlaid on the PDR surface temperature model from Kaufman, Wolfire & Hollenbach (2006), suggesting n and G0 values of 102-3 (see text for caveats).
The [C ii] results in particular are interesting, with the derived luminosity a factor of 4 lower than estimated in Ivison et al. (2010). The earlier value was derived assuming a smaller lensing amplification (32.5) and using a Gaussian rather than a sinc fit, from a much shallower spectrum calibrated with the asteroid Vesta (Uranus is now used). Our estimate gives a line luminosity-to-LIR ratio of 0.06 per cent. With a [C ii]/[N ii] ratio of 2.5, similar to that tentatively observed in LAE-2 by Decarli et al. (2014, and much lower than its companion submillimetre galaxy (SMG) in that paper), H ii regions may make a major contribution to the [C ii] luminosity. An intriguing, if perhaps unlikely scenario is a strong contribution to the [C ii] emission from the outflow itself, which would suggest a lower amplification (due to increased source velocity) and hence higher luminosity.
With the [O i] emission appearing to arise from within CO clump, ‘X’, we fit several observed parameters for this clump to the PDR models presented in Kaufman et al. (2006). We assume an FIR luminosity for this clump, |$L ^{\rm X} _{\rm FIR} = L ^{\rm tot} _{\rm FIR} \times \ {\rm SFR}^{\rm X} / {\rm SFR}^{\rm tot}$|, and that 50 per cent of [C ii] emission arises from the [O i]-producing PDRs within this clump (a value likely overestimated should the observed [C ii]–[O i] velocity offset prove genuine and H ii regions contribute strongly to the [C ii] luminosity).
The [C i] 370 μm/[C i] 609 μm ratio from Danielson et al. (2011) should additionally probe the deeper regions (AV ∼ 2-4; Kaufman et al. 2006). As indicated in the lower-right panel of Fig. 2, these parameters indicate a gas density n ∼ 102-3 cm− 3 and incident FUV flux G0 ∼ 102-3 Habing fields (Fig. 2) within CO clump ‘X’, consistent with Danielson et al. (2013). The above values both increase as the [C ii]/[O i] ratio drops, with Danielson et al. (2013) estimating n ∼ 103 cm− 3 for the molecular gas within clump ‘X’.
With dissimilar photon energies required for production of the species involved, but comparable critical densities, the relative luminosity |$L_{\rm [O\,\small {iii}]}/ L_{\rm [N\,\small {ii}]}$| is a sensitive diagnostic of the interstellar radiation field hardness, little affected by gas density. We observe |$L_{\rm [O\,\small {iii}]}/ L_{\rm [N\,\small {ii}]}= 1.2 \pm 1.2$| in SMM J2135, with the models presented in Ferkinhoff et al. (2011) thus indicating production within an H ii region surrounding a starburst with an effective temperature of 35 000 K or within a narrow-line region with ionization parameter ∼− 3.5 (both models assume solar metallicity). To investigate the likelihood of an AGN-associated narrow-line region, we estimate the maximum possible AGN luminosity from the SED. We use the IR SED fitting method introduced in Mullaney et al. (2011), and extended in Del Moro et al. (2013) to fit to the available photometry from MIR to sub-mm wavelengths. This SED fitting method allows the decomposition of the AGN and host contribution to the galaxy's IR emission. The best-fitting result requires no AGN contribution, attributing the whole of the IR emission to the host galaxy. To place a constraint on the AGN IR emission, we assume an upper limit that corresponds to 10 per cent of the resulting total emission from the best fit. This, along with the higher total |$L_{\rm [N\,\small {ii}]}$| and |$L_{\rm [C\,\small {ii}]}$| and low G0 inferred above, is consistent with a situation in which SMGs possess more extended star formation than local ULIRGs, generated by large, low-ionization H ii regions (e.g. Biggs & Ivison 2008; Hainline et al. 2009; Menéndez-Delmestre et al. 2009; Ivison et al. 2011; Swinbank et al. 2011).
3.2 OH absorption
Due to the relatively poor spectral resolution of the SPIRE FTS, we do not see a readily identifiable P-Cygni profile in the 119 μm OH feature and as such we fitted it with two identical components constrained to have the rest-frame frequency separation of the line doublet, suggesting a velocity offset of 160 ± 110 km s− 1 (see Fig. 1 and Table 1) with respect to the low-J CO luminosity-weighted redshift of z = 2.325 91 (Swinbank et al. 2011). Requiring strong active star formation from dense material as the primary driver, as with the [N ii], [O iii] and [O i] lines, we associate the OH source with CO clump, ‘X’ (Danielson et al. 2013), at v ∼ 400 km s− 1 corresponding to a mean velocity of the OH of − 240 ± 110 km s− 1. Rupke et al. (2005) require v < −50 km s− 1 for classification as an outflowing wind. As such, this − 180 ± 40 Jy km s− 1 feature represents the highest redshift observation of outflowing molecular gas.
No other OH transitions are observed, consistent with the faint 79 μm cross-ladder transition observations in Spoon et al. (2013). Multiple transitions have been detected in the nearby quasar, Mrk 231 (González-Alfonso et al. 2014), with several showing absorption fluxes comparable to that of the 119 μm doublet, suggesting that the 119 μm lines are optically thick in that system, or that the radiatively excited upper levels are more highly populated. The large full width at half-maximum (FWHM) of the FTS spectral profile makes it difficult to determine the underlying line structure; however, a comparison to the velocities of the four clumps indicates that it is likely that the outflow does not have a covering factor of unity.
In Fig. 3, we compare the 119 μm OH absorption feature of our stacked spectra, to that of starburst-dominated sources from the Spoon et al. (2013) sample. The normalized, integrated, absorbed flux, − 380 Jy km s− 1, is at the high end of those in that sample, including both starburst- and AGN-dominated sources.
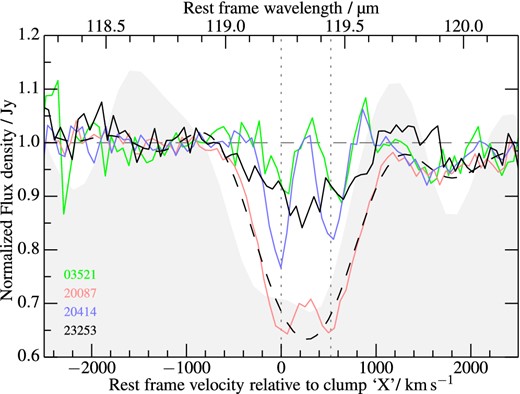
Normalized OH profile of SMM J2135 compared to those of the four starburst-dominated (AGN contribution <25 per cent of LIR) sources in the local sample of Spoon et al. (2013), observed with Herschel/PACS (Poglitsch et al. 2010). The low maximum and median blueshift velocities of these (including SMM J2135) are typical of systems with low AGN contributions (see Fig. 4). Vertical dotted lines denote the rest-frame velocities of the OH doublet. The velocity scale in this figure is set relative to that of the assumed driving source (such that the luminosity-weighted low-J CO redshift for the system as a whole corresponds to − 400 km s− 1). Note that the SPIRE FTS produces an FWHM of ∼ 570 km s− 1 at this observed frequency, with the PACS spectrometer producing an FWHM of < 290 km s− 1 for the displayed observations. Shown as a black dashed line is the 20087 spectrum deconvolved with the PACS spectral profile and then convolved with the SPIRE spectral profile, producing a very similar profile to that observed in SMM J2135.
Following Spoon et al. (2013), we define |$v^{\rm obs} _{\rm max}$| as the velocity at which a B-spline fitted to the blue absorption wing crosses the continuum flux density. Correcting for turbulence (100 km s−1; as used in Spoon et al. 2013), and instrumental spectral resolution (1.2 GHz) in quadrature, we obtain an estimate for the maximum velocity of outflowing molecular gas: |$v ^{\rm mol} _{\rm max} = -670 \, {\rm km\,s^{-1}}$| for vsource = 400 km s− 1, with Spoon et al. (2013) estimating the uncertainty on |$v^{\rm mol}_{\rm max}$| obtained in this method as ± 200 km s− 1. This similarity to the maximum predicted for starburst-driven outflows ( ∼ 700 km s− 1; Martin 2005) suggests highly efficient momentum transfer within SMM J2135.
It is additionally instructive to compare this result with outflows from high-redshift galaxies determined from UV absorption lines. Winds from SMGs should likely possess qualities of both these, and of outflows from local ULIRGs. Fig. 4 shows our detection in relation to those presented in Spoon et al. (2013) and Veilleux et al. (2013), with SMM J2135 occupying the lower-right corner of the |$v ^{\rm mol} _{\rm max}$|–SFR plot, typical of the sources with low fractional AGN contributions to Lbol. A correlation of |$v^{\rm UV}_{\rm max}$| with SFR surface density ΣSFR in such high-redshift galaxies has been identified (Chen et al. 2010; Kornei et al. 2012; Newman et al. 2012). ΣSFR is typically found in high-redshift SMGs to be between that in low-redshift ULIRGs and high-redshift ‘normal’ galaxies, suggesting comparatively high expected |$v ^{\rm UV} _{\rm max}$| within SMM J2135 and other SMGs; however, the observed ionized components may have velocities systematically different from that of the molecular phases, with Banerji et al. (2011), Kornei et al. (2012) and Martin et al. (2012) finding |$v ^{\rm UV} _{\rm max}$| similar to |$v^{\rm mol}_{\rm max}$| for SMM J2135 within galaxies of substantially lower ΣSFR.
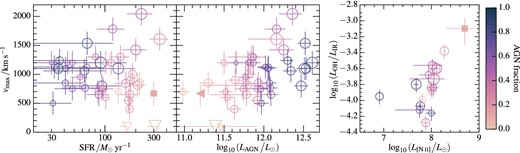
Left: comparison of SMM J2135 to local ULIRGs from Spoon et al. (2013) and Veilleux et al. (2013). Marker colour denotes the fractional AGN contribution to Lbol (see left-hand colour bar), with enclosed marker area proportional to Lbol. SMM J2135 is displayed with a filled marker, and appears typical of sources with little AGN contribution within that sample, with LAGN the primary determinant of vmax. The AGN luminosity indicated for SMM J2135 is derived from the estimated maximum 10 per cent contribution to LIR (see Section 3.1). Right: comparison with the Spoon et al. (2013) and Farrah et al. (2013) sample. The much lower OH-to-IR luminosity ratios of the ULIRGs of that sample likely indicates higher OH optical thickness or larger OH covering fractions.
With an inclination, 60° ± 8°, determined by Swinbank et al. (2011) for SMM J2135, we now consider the solid angle into which molecular gas may be ejected. An angle of 140° perpendicular to the disc is suggested by the ULIRG samples of Rupke et al. (2005), Spoon et al. (2013) and Veilleux et al. (2013) in which 2/3 of the OH detections show outflows, consistent with the OH detection in SMM J2135. More collimated winds are however advocated by the lower detection rates of blueshifted optical or UV absorption-line features in sources of lower SFR at both low (Rupke et al. 2005) and high redshift (Kornei et al. 2012; Martin et al. 2012). Such a disparity could exist, should there be a difference in wind structure between those driven by AGN and starbursts, or those generated in the disturbed morphologies of late-stage mergers. Our measurements for SMM J2135 are consistent with the above literature, suggesting that in starburst-dominated sources it is likely that the SFR or ΣSFR are primary determinants of the opening angle, with AGN contributing particularly to vmax (Fig. 4). A systematic difference in opening angle may however be difficult to disentangle from both the wind velocity and occurrence rate as a function of various host galaxy properties, in particular ΣSFR, particularly if observational constraints restrict classification to those of the highest absorbed flux or vmax.
Recent simulations have shown starburst-powered outflow rates of up to 1000 M⊙ yr− 1 (Hopkins et al. 2013b), consistent with mass-loading factors, |$\eta = \dot{M}_{\rm outflow} / {\rm SFR}$|, which locally are of the order of a few and – as with vmax – exhibit a positive correlation with AGN luminosity (Feruglio et al. 2010; Cicone et al. 2014; González-Alfonso et al. 2014). At higher redshift, high-mass starbursting galaxies (of which SMGs are an important sub-population) may dominate the global gas mass returned to the IGM (Newman et al. 2012).
An estimate of the mass-outflow rate from SMM J2135 can be determined from the column density of ground-state OH molecules via a physical model, such as that presented in González-Alfonso et al. (2014), a modified version of which is now detailed.
For physically motivated model parameter values: XOH = 5 × 10− 6 (Goicoechea & Cernicharo 2002), |$\int w(\Omega ) \, {\rm d} \Omega = \frac{2}{3} \times 4 \pi$|, r = 100 pc (motivated by the size of components ‘X’ and ‘Y’; Swinbank et al. 2011), R = 200 pc, v(r) = v = 670 km s− 1, v(R) = V = 100 km s− 1, Tex = 200 K (Danielson et al. 2013), |$\int ^{-100} _{-670} \tau (v) \, {\rm d} v = 2000 \, {\rm km\,s^{-1}}$|, the 119 μm absorption suggests a mass-outflow rate of 120 M⊙ yr− 1 and hence a mass loading ≈2 for the 70 M⊙ yr− 1 SFR of CO clump ‘X’ (Swinbank et al. 2011). We note that the above parameters are determined only poorly and mass-outflow rates estimated from this single transition are likely to be extremely uncertain. Particularly insecure are the estimates of temperature, integrated optical depth and XOH, the latter determined from local GMCs, whereas this outflow may be launched from a region dominated by atomic gas, and the outflow likely contains multiple phases regardless.
The estimated mass-outflow rate contributes sub-dominantly to the total gas-reduction rate, which is primarily by star formation (300 M⊙ yr− 1, estimated from the rest-frame 8–1000 μm luminosity of Ivison et al. 2010, corrected for the more recent lensing amplification Swinbank et al. 2011 and using the relation of Murphy et al. 2011). This suggests that the 2.5 × 10¹⁰ M⊙ of molecular gas within SMM J2135 (Danielson et al. 2013), will be exhausted on a time-scale of ≈ 60 Myr, primarily through star formation, but as we note above, the calculated mass-outflow rate is extremely uncertain. High-redshift SMGs are conjectured to have duty cycles of ≈ 100 Myr (e.g. Hickox et al. 2012; Bothwell et al. 2013), comparable to that estimated here for molecular gas removal, suggesting little conversion of atomic to molecular gas, or gas input from the IGM.
The velocity required for outflowing gas to become unbound or to join the hot intracluster medium cannot be determined reliably without knowledge of the dark matter halo mass and the location of SMM J2135 within that halo. However, utilizing the estimated stellar mass, M⋆ = 3 × 10¹⁰ M⊙ (Swinbank et al. 2010), alongside table 7 from Moster et al. (2010), suggests MDM(rvir) = 2 × 10¹² M⊙. This value neglects potential SMG clustering (e.g. Hickox et al. 2012) so may underestimate the true halo mass. The escape velocity from a dark matter halo with a Navarro–Frenk–White profile (Navarro, Frenk & White 1997) with this virial mass, a virial radius of 100 kpc and a concentration parameter c = 10, is ∼ 1000 km s− 1, somewhat higher than the vmax calculated above for SMM J2135, supporting the suggestion that AGN are required for full expulsion of interstellar material from massive galaxies. Star-formation-powered outflows such as the one we have found in SMM J2135 are likely unable to escape the dark matter halo and may merely serve to maintain the elevated SFR of SMGs though a fountain mechanism.
4 CONCLUSIONS
We present the first detection of OH absorption in a high-redshift galaxy, exploiting the SPIRE FTS aboard Herschel, and interpret this as a starburst-driven molecular outflow.
We additionally detect emission lines of [C ii] 158 μm, [N ii] 122 μm, [O iii] 88 μm and [O i] 63 μm, finding line luminosities similar to local ULIRGs and indicative of a significant contribution to the [C ii] luminosity from H ii regions. PDR models indicate n and G0 values of 102-3 cm− 3 and 102-3 Habing fields, respectively.
The 119 μm OH absorption is blueshifted by 240 ± 110 km s− 1 relative to the star-forming clump, ‘X’, pinpointed previously by low-J CO observations, and which we associate with the observed [N ii] 122-μm and [O iii] 88-μm emission. This molecular component to a starburst-driven wind, possesses a maximum velocity of 700 ± 200 km s− 1, smaller than the escape velocity expected for the dark matter halo. A large fraction of the available molecular gas could thus be converted into stars via a burst protracted by the resulting gas fountain, until an AGN-driven outflow can eject the remaining gas.
RDG acknowledges support from the Science and Technology Facilities Council. RJI acknowledges support from the European Research Council (ERC) in the form of Advanced Grant, cosmicism. IRS acknowledges support from STFC (ST/I001573/1), the ERC Advanced Grant dustygal, and a Royal Society/Wolfson Merit Award. Herschel was an ESA space observatory with science instruments provided by European-led Principal Investigator consortia and with important participation from NASA.
