


Abstract
We present results from the largest Ca ii triplet line metallicity study of Small Magellanic Cloud (SMC) field red giant stars to date, involving 3037 objects spread across approximately 37.5 deg2, centred on this galaxy. We find a median metallicity of [Fe/H] = −0.99 ± 0.01, with clear evidence for an abundance gradient of −0.075 ± 0.011 dex deg−1 over the inner 5°. We interpret the abundance gradient to be the result of an increasing fraction of young stars with decreasing galactocentric radius, coupled with a uniform global age–metallicity relation. We also demonstrate that the age–metallicity relation for an intermediate-age population located 10 kpc in front of the north-east of the cloud is indistinguishable from that of the main body of the galaxy, supporting a prior conjecture that this is a stellar analogue of the Magellanic Bridge. The metal-poor and metal-rich quartiles of our red giant branch star sample (with complementary optical photometry from the Magellanic Clouds Photometric Survey) are predominantly older and younger than approximately 6 Gyr, respectively. Consequently, we draw a link between a kinematical signature, tentatively associated by us with a disc-like structure, and the upsurges in stellar genesis imprinted on the star formation history of the central regions of the SMC. We conclude that the increase in the star formation rate around 5–6 Gyr ago was most likely triggered by an interaction between the SMC and Large Magellanic Cloud.
1 INTRODUCTION
Low-mass dwarfs are the most numerous galaxy type in the Universe and are found both in relative isolation and as satellites of larger assemblies. In the prevailing theoretical framework for galaxy formation, Λ cold dark matter (ΛCDM; e.g. Peebles & Ratra 2003), these small systems are the building blocks of the haloes of larger galaxies (Searle & Zinn 1978), a prediction that appears to be borne out by observations (e.g. Frebel, Kirby & Simon 2010). Assemblies comparable in mass to M31 and the Milky Way are anticipated to have cannibalized dozens of small systems over the last 10 Gyr (Unavane, Wyse & Gilmore 1996), so it is important to develop a comprehensive picture of the chemical evolution of dwarf galaxies. This is intimately linked to the temporal and spatial progression of their star formation activity. In large assemblies like the Milky Way and M31, star formation appears to migrate outwards over time, in accord with ΛCDM simulations which predict galaxy discs to continue growing as gas with progressively higher specific angular momentum accretes from within their dark matter haloes. In contrast, star formation in many dwarfs appears to have contracted inwards over time (e.g. Wyder 2001; Hidalgo et al. 2009; Zhang et al. 2012) so these systems do not appear to behave merely as scaled down versions of large galaxies.
Several physical processes have been identified which could result in the contraction of dwarf galaxies’ star-forming discs. These include hydrodynamical effects where the more rapid consumption of the gas by star formation in the partially pressure supported central regions of these galaxies leads to the inflow of material from larger radii to re-establish the balance, in turn depleting these parts of the fuel necessary for further stellar genesis (e.g. Stinson et al. 2009; Pilkington et al. 2012; Shen et al. 2013). The torques between stellar and gaseous structures that are induced in galaxy–galaxy mergers can remove angular momentum from the latter which in turn fall into the central regions of galaxies, resulting in increases in the star formation rates here (Mihos & Hernquist 1994; Hopkins et al. 2009). Tidal interactions with neighbouring galaxies and ram pressure stripping are efficient at removing gas, particularly from the peripheral regions of low-mass galaxies (e.g. Mayer et al. 2006). For example, in their recent detailed cosmological simulation, Shen et al. (2013) highlighted a close encounter between two dwarfs which removed around 60 per cent of the gas from the lower mass system. Tidal forces can also promote the growth of bar instabilities (Mayer et al. 2001) which can lead to the radial inflow of gas and increases in the star formation rate in the inner regions of these galaxies.
Tidal and ram pressure stripping have also been invoked to explain, in part, the overprediction by ΛCDM of the numbers of dwarf galaxies in the Local Volume, including the number that are satellites to the Milky Way (Klypin et al. 1999). In the low-luminosity regime the mass function of galaxies is expected to have a M−1.9 form yet it is observed to be closer to M−1 (Cole et al. 2001). Together with supernovae feedback, these mechanisms are anticipated to quench star formation by disrupting and expelling the gas from galaxies that they require to form stars, transforming the lowest mass dwarfs into very faint and dormant systems. Moreover, the cycle of stellar genesis and supernovae feedback is predicted to lead to distinctive bursts in the global star formation activity of dwarf galaxies that can also help to resolve the disparity between the hypothetical centrally cusped dark matter profiles and the significantly flatter distributions inferred from empirical determinations of their rotation curves (e.g. de Blok & Bosma 2002; Governato et al. 2010).
The two Magellanic Clouds are amongst the closest dwarf galaxies to the Sun and present an opportunity to study in some detail the role these various mechanisms play in regulating star formation and thus the chemical evolution of lower luminosity systems. The Small Magellanic Cloud (SMC) is the smaller (M ≈ 2 × 10⁹ M⊙), the more distant (D ≈ 60 kpc) and the less studied of the pair. There is ample evidence that gas is being or has been relatively recently stripped from the SMC as a consequence of its interactions with the Large Magellanic Cloud (LMC) and/or the Galaxy. For example, both clouds are immersed within an extended body of diffuse H i gas that stretches out many tens of degrees across the sky, forming the Magellanic Stream and the Leading Arm (e.g. Wannier & Wrixon 1972; Mathewson, Cleary & Murray 1974; Putman et al. 2003; Nidever et al. 2010). Fox et al. (2013) have recently demonstrated this gas to have a composition consistent with that of the SMC 1.5–2.5 Gyr ago, corresponding to the epoch during which this structure is believed to have formed. However, considering the proximity of the SMC and LMC to the Galaxy, they are relatively unusual in that they are gas rich whereas many dwarf galaxies within a few hundred kpc of the Milky Way and Messier 31 appear to be gas poor (e.g. Grcevich & Putman 2009). Zaritsky et al. (2000) have proposed that the SMC has recently accreted a gas cloud, in view of the highly fragmented distribution of its younger stellar populations and the stark difference between the spatial distributions of these and the older generations of stars. Different stellar populations in a number of other dwarf irregular galaxies, such as NGC 6822 (e.g. Letarte et al. 2002) and IC 10 (Borissova et al. 2000), also appear to have distinctive distributions.
Within the last decade or so, there have been several detailed investigations of the star formation history of the SMC. For example, Dolphin et al. (2001) analysed a deep colour–magnitude diagram constructed from Hubble Space Telescope (HST) and Wide Field Planetary Camera (WFC) data for a field several degrees to the north-west of the bar. They found a generally low level of star formation here, that peaked around 5–8 Gyr ago and that has dropped off sharply in more recent times. Similarly, Chiosi & Vallenari (2007) analysed HST imaging of three fields located at the southern end of the bar. They unearthed a distinct peak in the star formation rate around 3–6 Gyr ago and concluded that only very inefficient star formation proceeded in these three fields prior to this time. Sabbi et al. (2009) and Cignoni et al. (2012, 2013) have examined deep HST imaging of six further fields across the SMC and their results are accordant with those of the previous space-based studies. This prominent rise in the star formation rate around 5 Gyr ago is also recovered in a ground-based imaging study of 12 fields widely distributed across the SMC (Noël et al. 2009). These investigators also find evidence of a global burst of star formation around 10 Gyr ago, which is not inferred from the HST observations. Harris & Zaritsky (2004) similarly found there to have been a burst of star formation in the cloud around this time based on their analysis of a much more spatially extensive but photometrically shallower data set. However, it has been suggested that their conclusion regarding this early burst of star formation activity is compromised by the lack of depth of their imaging data, which does not reach to below the oldest main-sequence turnoff (e.g. Subramanian & Subramaniam 2012).
There have also been a number of spectroscopic studies of the intermediate-age field star population of the SMC aimed at probing its star formation history. For example, Carrera et al. (2008b) observed 350 red giant branch (RGB) stars in 13 pointings scattered within 4°–5° of the centre of the cloud and detected a radial metallicity gradient in this population. Drawing from their analysis of the form of the age–metallicity relation, they attributed this to the younger, more metal-rich objects being the most centrally concentrated component of the RGB star population. The results from the deeper imaging studies and the Carrera et al. work are indicative of an outside to in migration of star formation activity in the SMC. Intriguingly though, in another, more recent, spectroscopic study of 360 field red giant stars drawn from 15 distinct pointings extending out to 7°–8°, Parisi et al. (2010) found no compelling evidence of a metallicity gradient in the intermediate-age stellar population. The most comprehensive study to date of the metallicities and the ages of the SMC open clusters reached a similar conclusion (Piatti 2012). Clearly, to build a better understanding of the progression of star formation activity throughout the SMC, it is first necessary to confirm or otherwise the existence of a radial variation in the metallicity of the intermediate-age population. Additionally, to gain greater insight into the drivers of star formation activity in the SMC, and dwarf galaxies in general, it is informative to search for and identify any associations between the ages and kinematics of the RGB population and variations in the cloud's historical star formation rate.
In the present work we describe the analysis and the interpretation of stellar metallicity measurements for 3037 red giant stars located across 37.5 deg2 of the SMC. Our study of the kinematics of these stars is presented elsewhere (Dobbie et al. 2014). In the following sections we discuss our measurements of the stellar abundances and our analysis of these values. After cross-matching our sources with the Magellanic Clouds Photometric Survey (MCPS; Zaritsky et al. 2002) to obtain optical photometry, we use a published relation between [Fe/H], V and V − I to derive their ages. We compare our age–metallicity relations for the main body of the SMC and a population of red giants 10 kpc in front of the north-east of the cloud recently proposed to be the stellar analogue of the Magellanic Bridge. Next, we examine the relative age distributions of the most metal-rich and metal-poor quartiles of the RGB population and examine their kinematics and relative ages in the context of the historical star formation rates of the SMC. We conclude the paper with a summary of our main findings.
2 SMC RGB STARS
2.1 Candidate selection and spectroscopic follow-up
Although the details of our selection and optical spectroscopic follow-up of SMC red giant stars are described in Dobbie et al. (2014), for completeness we provide a recap of the main points of this aspect of our work here. Candidate SMC red giants were selected from their location in a J, J–Ks colour–magnitude diagram, constructed for sources with photometric uncertainties of less than 0.5 mag in both bands, using the near-infrared (IR) photometry of the Two Micron All-Sky Survey (2MASS; Skrutskie et al. 2006) Point Source Catalogue (PSC). Our survey covered an area of approximately 37.5 deg2, centred on the cloud (Fig. 1). We selected sources to the red of a line defined by J = 26.5 − 20 × (J − Ks) and blueward of J − Ks = 2.0 or J − Ks = 1.25 for 12.0 ≤ J < 13.9 and 13.9 ≤ J ≤ 15.2, respectively. We eliminated from this initial list, sources that were flagged as possible blends, as having photometry contaminated by image artefacts or nearby bright objects and/or as lying within the boundaries of catalogued extended objects. The resulting preliminary catalogue of 92 893 objects includes both SMC RGB and asymptotic giant branch (AGB) stars.
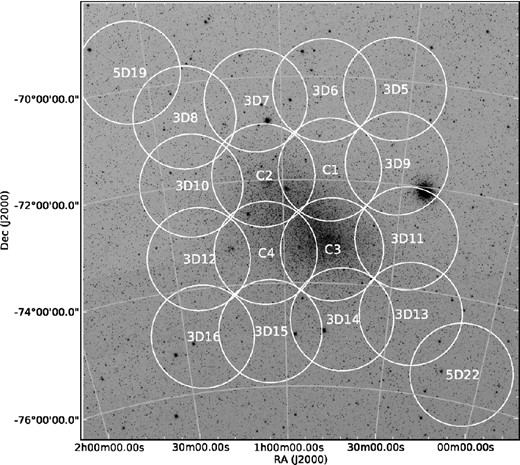
A 9° × 9° image of the sky centred on the SMC [3.4 μm Wide-field Infrared Survey Explorer (WISE) data; Wright et al. 2010. The circles, which each corresponds to an AAT+2dF/AAOmega pointing, highlight the areas included in our photometric and spectroscopic survey. Note that at least two distinct fibre configurations were observed for each of the four central fields.
Spectroscopic follow-up data for approximately 7000 of these targets were acquired during the period 2011 October 18–21, with the 2dF/AAOmega fibre-fed multi-object optical spectrograph (Saunders et al. 2004; Sharp et al. 2006) and the 4.2-m Anglo-Australian Telescope (AAT). The blue and red arms of AAOmega were configured with the 1500V (R ≈ 4000) and 1700D (R ≈ 10 000) gratings and tuned to central wavelengths of 5350 and 8670 Å, respectively. We utilized 23 different field configurations, the centres and the exposure times for which are reported in table 1 of Dobbie et al. (2014). The data were reduced using the Australian Astronomical Observatory's 2dfdr pipeline (Bailey, Heald & Croom 2005; Sharp & Birchall 2010). The final spectrum for each source was obtained by combining the data from the two to four individual exposures obtained per plate configuration.
Details of the 3037 SMC red giant stars, including our Ca ii triplet equivalent width measurements and abundance estimates.
| 2MASS J | RA | Dec. | J | δJ | Ks | δKs | ΣW | δΣW | [Fe/H] | δ[Fe/H] |
|---|---|---|---|---|---|---|---|---|---|---|
| (h:m:s) | (°:′:″) | (mag) | (mag) | (mag) | (mag) | (Å) | (Å) | |||
| 00:00:28.28 | −75:33:04.4 | 00002828–7533044 | 14.68 | 0.04 | 13.72 | 0.05 | 7.11 | 0.30 | −0.97 | 0.12 |
| 00:02:31.86 | −75:12:37.1 | 00023186–7512371 | 14.26 | 0.03 | 13.43 | 0.03 | 6.48 | 0.30 | −1.22 | 0.11 |
| 00:04:35.32 | −75:48:42.1 | 00043532–7548421 | 14.10 | 0.03 | 13.15 | 0.03 | 8.04 | 0.34 | −0.75 | 0.13 |
| 00:05:35.96 | −75:27:07.7 | 00053596–7527077 | 14.41 | 0.03 | 13.53 | 0.05 | 7.25 | 0.24 | −0.95 | 0.10 |
| 00:06:26.25 | −75:23:45.0 | 00062625–7523450 | 14.67 | 0.04 | 13.79 | 0.04 | 6.16 | 0.36 | −1.27 | 0.13 |
The red-arm spectra were normalized with low-order polynomials the forms of which were determined by matching the data to a multiplicative combination of these and normalized synthetic spectrum drawn from the library of Kirby (2011). Radial velocities for the sources, in most cases accurate to better than 5 km s−1, were obtained by cross-correlating the normalized spectra with AAOmega data sets for several RGB stars drawn from the clusters NGC 362, Melotte 66 and NGC 288, for which reliable radial velocities were available in the literature. This process was also undertaken for the C-stars in the sample, using AAOmega observations of six C-rich giants taken from the study of Kunkel, Irwin & Demers (1997) as the radial velocity templates. Subsequently, we utilized the blue-arm spectra to eliminate contaminating field dwarfs from the sample and to resolve the K-type from the C-rich giants. We constructed orthogonal basis vectors to describe a 50 Å wide section of these data centred on λ ≈ 5170 Å which covered the λλ5167, 5172 and 5183 Å Mg b lines and the distinctive C Swan band feature at 5165 Å. After first removing 449 C-rich stars from the spectroscopic sample, we selected 4172 objects, 4077 of which are unique, with radial velocities in the range 50 ≤ vr ≤ 250 km s−1 (and lying to the right of the line defined by PC1 = −0.013 vr + 1.0; see Dobbie et al. 2014 for details) as probable K-type red giant members of the SMC. Finally, as the RGB tip in the SMC is found to lie at J ≈ 13.7 (Cioni et al. 2000), we conservatively cut at J ≥ 14 to define a sample of 3037 sources we anticipate to be dominated by SMC RGB stars. Details of these objects, including metallicity estimates, are listed in Table 1.
2.2 RGB star metallicity measurements
To gauge the metallicities of the SMC RGB stars we have applied the widely documented technique involving the summation (ΣW) of the equivalent widths of the λλ8498, 8542 and 8662 Å Ca ii lines (Armandroff & Da Costa 1991; Olszewski et al. 1991; Cole, Smecker-Hane & Gallagher 2000). As the 2MASS survey (Cutri et al. 2003) currently represents the most uniform and reliable photometric data base for our spatially extensive sample, to obtain estimates on the scale of Carretta & Gratton (1997), we have followed the approach of Warren & Cole (2009). We adopted as proxies for the luminosities of the stars, the differences between their 2MASS Ks magnitudes and that of their host population's red clump. Importantly, Pietrzyński, Gieren & Udalski (2003) find that in the Ks band, the absolute magnitude of the red clump displays little dependence on a population's age and metallicity within relatively broad ranges, 2 ≲ τ (Gyr) ≲ 9 and −1.8 < y [Fe/H] < −0.5, respectively. Variations in the SMC population's age and metallicity slightly outwith these ranges (e.g. τ ≈ 1–2 Gyr) are also expected to have only a minor impact on this work, Δ[Fe/H] ≲ 0.03 (e.g. Grocholski & Sarajedini 2002; Warren & Cole 2009). The characteristics of the Ca ii lines have been determined by matching them to Voigt profiles at the stellar velocities as measured by the cross-correlation procedure. To assess the uncertainties in the line equivalent width measurements, we utilized a bootstrap with replacement approach, whereby for each spectrum, we generated several hundred resampled versions and refitted the line profiles in every one. The resulting uncertainty estimates have been examined with repeat observations of approximately 100 SMC stars and have been found to be approximately 30–40 per cent smaller than the scatter between the independent sets of measurements. There was no apparent correlation between the size of this disparity and object magnitude so the equivalent width uncertainties were simply scaled-up accordingly and adopted for the remainder of this work.
To appraise our techniques, the RGB members of four star clusters of known metallicity were also observed during our four night campaign at the AAT. These were drawn from the globular clusters M30, NGC 362 and NGC 104 and the open cluster Melotte 66 and collectively span a relatively broad range of metallicity, −2.0 ≲ [Fe/H] ≲ −0.5. The red clump magnitudes (|$K_{{\rm s}_{{\rm RC}}}$|) adopted for these populations were taken from the literature (e.g. Warren & Cole 2009) or from the median Ks magnitude of the fundamental-mode RR Lyrae members of their horizontal branches for which 2MASS measurements are available (Table 2). Subsequently, for each of these four populations a second-order polynomial has been fitted to the ΣW determinations as a function of luminosity. We have examined the behaviour of this relation and found no compelling evidence in any of these four data sets for significant departures from a simple linear trend. The weighted mean of the four function gradients, |$\beta _{K_{\rm S}}$| = 0.47 ± 0.05, appears to be in excellent agreement with the result from our prior study of 17 cluster populations (|$\beta _{K_{\rm S}}$| = 0.48 ± 0.01; Warren & Cole 2009). Indeed, adopting the gradient (|$\beta _{K_{\rm S}}$|) and the relation between ΣW′ and [Fe/H], [Fe/H] = (−2.738 ± 0.063) + (0.330 ± 0.009) ΣW′, from this earlier work, we determine metallicities for M30, NGC 362 and NGC 104 and the open cluster Melotte 66 of [Fe/H] = −1.91 ± 0.07, −1.13 ± 0.08, −0.75 ± 0.07 and −0.47 ± 0.09, respectively. These are in accord with estimates in the literature (e.g. [Fe/H] = −1.91 ± 0.00, −1.15, −0.70 ± 0.03 and −0.48 ± 0.06; Carretta & Gratton 1997; Cole et al. 2004) and suggest that the data reduction and analysis processes applied here do not introduce substantial systematic error in our abundances, at least with respect to our prior work.
Adopted Ks magnitudes for the red clumps in the four fiducial clusters.
| Cluster | |$K_{{\rm s}_{{\rm RC}}}$| | Reference |
|---|---|---|
| (mag) | ||
| M30 | 13.83 ± 0.03 | 1 |
| NGC 362 | 14.28 ± 0.16 | 1 |
| NGC 104 | 11.94 ± 0.12 | 2 |
| Melotte 66 | 11.74 ± 0.13 | 2 |
| Cluster | |$K_{{\rm s}_{{\rm RC}}}$| | Reference |
|---|---|---|
| (mag) | ||
| M30 | 13.83 ± 0.03 | 1 |
| NGC 362 | 14.28 ± 0.16 | 1 |
| NGC 104 | 11.94 ± 0.12 | 2 |
| Melotte 66 | 11.74 ± 0.13 | 2 |
Note. Reference: 1 – this work; 2 – Warren & Cole (2009).
3 METALLICITIES
3.1 The overall distribution of [Fe/H]
We have adopted a singular value of |$K_{{\rm s}_{{\rm RC}}}$| = 17.35 ± 0.02 for the magnitude of the SMC red clump, since deep and uniform photometry of our extensive survey area, suitable for assessing its dependence on RA and Dec., is not yet available. This value is based on deep J and K imaging for 10 pointings (totalling an area of approximately 0.017 deg2) towards the cloud with the ESO/New Technology Telescope (NTT) and the Son of ISAAC (SOFI) instrument that was used to isolate the giant branch and locate the peak in the K-band luminosity function of this population (Pietrzyński et al. 2003). It should represent a fair estimate of the magnitude zero-point for our abundance analysis since the U, B, V and I band MCPS (Zaritsky et al. 2002) investigation of extinction in the direction of the central 4|$_{.}^{\circ}$|5 × 4° of the SMC has found no evidence of strong differential reddening towards the intermediate and older age populations. This conclusion has been corroborated by more recent studies of these stellar generations of the SMC, although three small regions of somewhat higher extinction have been identified within the bar and the wing (e.g. E(V − I) = 0.16; Haschke, Grebel & Duffau 2011; Subramanian & Subramaniam 2012). As AK/E(B − V) = 0.36 (for R = 3.1; Fitzpatrick 1999), these comparably subtle variations should have a negligible impact on our metallicity estimates. However, we take them into account in estimating the ages of our RGB stars in Section 4.1 since this step is reliant on V- and I-band photometry.
Cioni et al. (2000) determined the tip of the RGB in the SMC to lie at J ≈ 13.7 so, conservatively, the 3037 stars with J ≥ 14, which were not flagged as C-rich in Section 2.1 have been selected for further scrutiny. For all these objects, we have calculated |$K_{{\rm s}} - K_{{\rm s}_{{\rm RC}}}$| and their reduced equivalent widths, ΣW′, assuming |$\beta _{K_{\rm S}}$| = 0.48 ± 0.01 (Warren & Cole 2009). Subsequently, relying again on results from our earlier work, we have calculated their metallicities, [Fe/H]. A histogram of the results of this process is shown in Fig. 2. The overall shape of this distribution is comparable to that seen in previous metallicity studies of SMC RGB field stars (e.g. Parisi et al. 2010). There is a relatively rapid decline in the number of objects towards higher metallicities, with a negligible number found to have [Fe/H] ≳ −0.4. However, there is a more gradual tailing off in the number of stars towards lower metallicities, −2.5 < [Fe/H] < −2.0. This is reflected by the negative skewness calculated for the observed distribution (γ1 = −1.819 ± 0.044). An estimate of this sample's kurtosis (γ2 = 7.900 ± 0.089) and the results of a Kolmogorov–Smirnov (K–S) test for normality (P = 3e-19) also indicate that a simple Gaussian is not a particularly good representation of the underlying metallicity distribution. The histogram resembles that derived for the RGB stars in the bar of the LMC (Cole et al. 2004), albeit shifted to lower metallicities. Recognizing the departure of this distribution from normality, rather than determining a mean metallicity, we have calculated the median value for these stars, [Fe/H] ≈ −0.993 ± 0.006. This is comparable to the median metallicity of the RGB stars investigated by Parisi et al. (2010) (Fe/H ≈ −0.985 ± 0.020).
![The histogram of our metallicity ([Fe/H]) estimates for the entire spectroscopically observed sample of SMC RGB stars.](https://oup.silverchair-cdn.com/oup/backfile/Content_public/Journal/mnras/442/2/10.1093_mnras_stu926/1/m_stu926fig2.jpeg?Expires=1749840947&Signature=cErZ6UZ6v8fa0hBN-lDmGSlkFeUeTY4mOMIWdpgVOMfc6Dtv~vxh1LOQpj7qLSDRhS34wOlx9h2m1V5bI7brBcYs8AM8GLf8te4gMxEgyjXP3mXYWY-eNcWomr03fla-22laXH1J8Nl2-1mJnO43nH6a6k3yoY6fs6kJ0eLt7KqNTdfbf9GpEZLArRP4T-u1l1HUY9SfQ537HozszoLSghF~xTg0374W1YqpaZ6akeChvVliqEmp~QpdZKMU9oCpbDqJpfwD6jyNeseRenRwBY2Rx9CSLBep2izgeMYd095K2xIXRxdkktWT60blauPYp-Vu6t0x7xtaQ5eJlZTz4Q__&Key-Pair-Id=APKAIE5G5CRDK6RD3PGA)
The histogram of our metallicity ([Fe/H]) estimates for the entire spectroscopically observed sample of SMC RGB stars.
3.2 Radial variation in [Fe/H]
To investigate how the metallicities of our stars depend (e.g. Carrera et al. 2008b), or otherwise (e.g. Parisi et al. 2010), on their projected location in the SMC, first we have split the sample of 3037 objects approximately in half at a galactocentric distance of around 1|$_{.}^{\circ}$|7. With both subsamples we have examined metallicity as a function of position angle and in each case found no evidence of an angular dependence. This is accordant with prior results on the low inclined orientation of the intermediate-age population in the SMC (e.g. Subramanian & Subramaniam 2012). Next, the 3093 RGB star metallicity measurements (i.e. including objects observed twice with different field configurations) have been split into 18 spatial subsamples, which correspond to our 2dF field pointings. The largest and the smallest of these contain 589 and 29 RGB stars, respectively. Basic parameters for the metallicity distribution of each subsample have been obtained by constructing a [Fe/H] histogram and calculating the median metallicity (Fig. 3). The output from this process is listed in Table 3. An examination of Fig. 3 reveals that, ostensibly, the spectroscopically observed stars located in the inner regions of our survey area tend to be more metal rich than those at larger radial distances (r > 2°) from the optical centre of the cloud.
![Histograms for the metallicities, [Fe/H], of the spatial subsamples of SMC RGB stars. The median metallicity of each subsample is highlighted (solid black line).](https://oup.silverchair-cdn.com/oup/backfile/Content_public/Journal/mnras/442/2/10.1093_mnras_stu926/1/m_stu926fig3.jpeg?Expires=1749840947&Signature=b4groI4X9h~wwaithdNZSJimkKHzmcCGKfnZXaBm3i~-ME1iqJF1wQAuZWpt3l-Zxuec0H9QuFsnE8vSWmaMER1L5lZngjfTeYkc3n1tM6VQq30MqhjJllcHt8ld1~XFJc6Wy2eutdy8K6v~YScak6fntHjmtF8d3g70DYn7QgtyyGex2f-YqW9Tjn2Sim3MUtZEzDJhm8HBmYO4jDQmPfeM9oVxRpYM5oXCN7J96X~nNZAMuwEnCidaGtxvR~vYnV3A5yVpp0SAdSv6urs1PxSB9ixJgau4EIVGczLkbD9gLqS-gKp~4oAwjbr6ZUqcKezA9-XXvAY~2WItGmIPEQ__&Key-Pair-Id=APKAIE5G5CRDK6RD3PGA)
Histograms for the metallicities, [Fe/H], of the spatial subsamples of SMC RGB stars. The median metallicity of each subsample is highlighted (solid black line).
A table summarizing the results from examining the metallicity histograms for our spatial subsamples of RGB stars. The median, the 25th and the 75th percentiles of the Ks magnitude distribution of each subsample are also listed.
| Field | Ntot | r | |$\tilde{\rm [Fe/H]}$| (Q1,Q3) | |$\tilde{K_{{\rm s}}}$| (Q1,Q3) |
|---|---|---|---|---|
| (°) | (mag) | |||
| C1 | 321 | 1.28 | −0.93 ± 0.02 (−0.81, −1.07) | 13.80 (13.48, 14.10) |
| C2 | 390 | 1.34 | −0.97 ± 0.02 (−0.86, −1.10) | 13.85 (13.53, 14.12) |
| C3 | 586 | 0.86 | −0.89 ± 0.01 (−0.77, −1.03) | 13.71 (13.41, 14.06) |
| C4 | 333 | 1.26 | −0.93 ± 0.02 (−0.82, −1.07) | 13.87 (13.51, 14.15) |
| 3D05 | 57 | 4.29 | −1.12 ± 0.05 (−0.96, −1.36) | 13.56 (13.32, 13.67) |
| 3D06 | 99 | 3.48 | −1.17 ± 0.03 (−1.06, −1.32) | 13.81 (13.57, 14.10) |
| 3D07 | 112 | 2.89 | −1.01 ± 0.03 (−0.87, −1.20) | 13.78 (13.48, 14.07) |
| 3D08 | 115 | 3.21 | −1.03 ± 0.03 (−0.94, −1.21) | 13.86 (13.53, 14.19) |
| 3D09 | 145 | 2.59 | −1.02 ± 0.03 (−0.90, −1.21) | 13.82 (13.44, 14.21) |
| 3D10 | 120 | 2.56 | −1.00 ± 0.03 (−0.88, −1.14) | 13.77 (13.45, 14.11) |
| 3D11 | 121 | 1.79 | −1.09 ± 0.03 (−0.93, −1.24) | 13.76 (13.50, 14.06) |
| 3D12 | 124 | 3.01 | −1.05 ± 0.04 (−0.92, −1.16) | 13.88 (13.53, 14.18) |
| 3D13 | 108 | 2.46 | −1.08 ± 0.03 (−0.93, −1.23) | 13.82 (13.49, 14.08) |
| 3D14 | 142 | 2.31 | −1.10 ± 0.03 (−0.97, −1.31) | 13.81 (13.53, 14.14) |
| 3D15 | 170 | 3.03 | −1.04 ± 0.04 (−0.93, −1.21) | 13.77 (13.45, 14.12) |
| 3D16 | 92 | 4.39 | −1.13 ± 0.04 (−0.95, −1.31) | 13.88 (13.65, 14.20) |
| 5D19 | 29 | 4.43 | −1.06 ± 0.08 (−0.95, −1.31) | 13.47 (13.25, 13.68) |
| 5D22 | 29 | 4.07 | −1.27 ± 0.07 (−1.10, −1.44) | 13.55 (13.37, 13.73) |
To assess the reality of the apparent radial variations in our measurements we have examined a number of potential sources of systematic error in these results. First, following the argument made above, it is improbable that differences of this magnitude can be attributed to differential reddening. Indeed, even the total neglect of much stronger, patchier extinction, as is associated with the early-type stellar population of the SMC (AV ≲ 2), would for R ≈ 3.1, only account for δ[Fe/H] ≈ 0.05 (Zaritsky et al. 2002). Secondly, we have explored the magnitude distributions of the stars in each of our subregions in case our spectroscopic follow-up was biased towards proportionally more bright or more faint stars depending on location in the cloud. It is conceivable that, coupled to a subtle systematic uncertainty in the ΣW, |$K_{{\rm s}} - K_{{\rm s}_{{\rm RC}}}$| relation which was applied to derive the reduced equivalent widths, this resulted in the observed field-to-field variations. However, the cumulative distributions of the Ks magnitudes of the targets in the subregions do not support this notion (Fig. 4). There are only relatively small differences in the median magnitude from field-to-field and the weighted Pearson product–moment correlation coefficient for the 18 measurement pairings of mean [Fe/H] and median Ks is only r = 0.35, consistent with the lack of a significant trend between these two variables. Thirdly, we have considered the impact of variations in the mean distance of the intermediate-age stellar population across the face of the SMC. A recent photometric analysis of the distance distribution of red clump stars 4° from the optical centre reveals a substantial population located about 10 kpc in front of the main body of the cloud, to the north and east. Other investigations of red clump and RR Lyrae stars have shown that in the central regions of our survey area, the SMC extends along a path length of up to 14 kpc (Subramanian & Subramaniam 2012). Potentially, we might have overestimated the luminosities of individual stars, at least around the northern and the eastern limits of our survey region, by 0.3–0.4 mag. However, this would lead to systematic errors in their metallicity determinations of only δ[Fe/H] ≈ 0.05. Moreover, as the lower RGB is more heavily populated than the upper RGB due to the different evolutionary time-scales, our initial photometric selection criteria in conjunction with the large line of sight depth should have resulted in the loss from our central survey region of more stars where the metallicity is overestimated as opposed to underestimated. Thus it is unlikely that varying distances or depths of the subsamples across the cloud are responsible for the observed variations in metallicity.
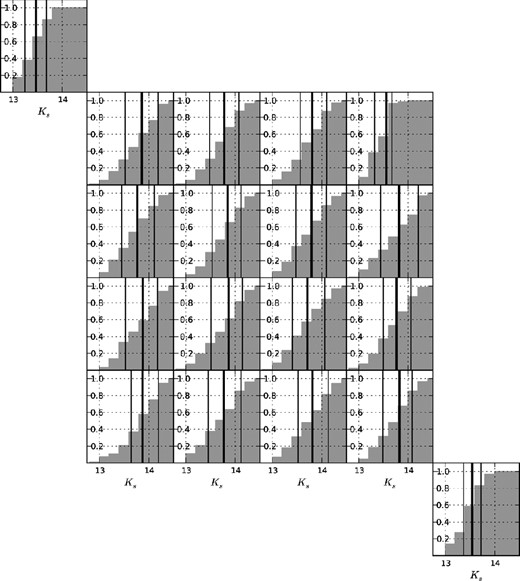
Cumulative Ks magnitude distributions for our spatial subsamples of SMC RGB stars. The median (thick black line) and lower and upper quartiles (black lines) of the distributions are overplotted.
Accepting that the field-to-field differences seen in the median metallicities of the SMC RGB stars are real, we have examined in more detail how [Fe/H] changes with galactocentric distance. For consistency with prior metallicity studies (e.g. Piatti et al. 2007; Parisi et al. 2010), the elongation of the structure of the cloud has been accounted for by working within an elliptical coordinate system. This has its origin at the optical centre of the SMC and has its major axis closely aligned with the SMC bar. We have accepted the semimajor axis of an ellipse on which a star lies as a proxy for its galactocentric distance. In lieu of the results of a recent detailed study of the three-dimensional distribution of the old and intermediate-age stellar populations of the SMC (Subramanian & Subramaniam 2012), we have adopted a major axis position angle of 55|$_{.}^{\circ}$|3, east of north, and have assumed the ratio of the semimajor (a) to semiminor (b) axes to be a/b = 1.5. The radial distances to our subsamples were taken to be the means of those of all RGB stars within the corresponding 2dF field pointings and are shown in Table 3. It can be seen that our measurements reach out to 4°–5°, comparable to the radial extent of the Carrera et al. (2008b) study.
Our new estimates of [Fe/H] for the SMC field RGB population convey a negative correlation between metallicity and distance from the optical centre of the cloud (Fig. 5, filled black circles). While there is greater scatter in the measurements at larger distances (this is likely at least partly due to the smaller numbers of stars in the outermost subsamples), a χ2-test resoundingly rejects the hypothesis that metallicity is constant with radius (χ2 = 225 for 17 degrees of freedom). A weighted linear fit to these data confirm a metallicity gradient of −0.075 ± 0.011 dex deg−1 (black dashed line). As is evident from an inspection of Fig. 5, this is less than the radial variation inferred from the [Fe/H] measurements of Carrera et al. (2008b) for field RGB stars, which drop to [Fe/H] < −1.5 beyond 4°–5°. However, the steeper gradient in that study might be related to the decrease in the mean magnitude of their RGB star subsamples as a function of increasing galactocentric distance. Having re-appraised the measurements of Parisi et al. (2010), by calculating the median metallicity of each of their subsamples (which is more appropriate given the departure of the distribution from a Gaussian), their metallicities appear to be in accord with our work. A weighted linear regression to their [Fe/H] data (Fig. 5, open squares), for the range of radii covered by our 2dF/AAOmega observations, can be also be regarded as consistent with the existence of a subtle abundance gradient (−0.046 ± 0.024 dex deg−1).
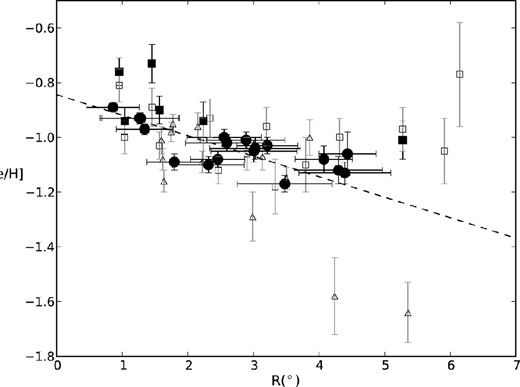
Our determinations of the median metallicity of RGB stars as a function of projected radius from the optical centre of the SMC (filled black circles). The results from two previous studies of smaller samples of RGB stars are overplotted: Carrera et al. (2008b, open triangles) and Parisi et al. (2010, open squares). Our improved measurements indicate that the metallicity decreases with increasing distance from the cloud centre, at least out to R ≈ 5°, but not as steeply as found by Carrera et al. (2008b). Revised metallicity estimates for a number of fields from Parisi et al. (2010) obtained using data from the IRSF Magellanic Clouds Point Source Catalogue (filled black squares; Kato et al. 2007) are overplotted and are largely consistent with the trend de-lineated by our new measurements.
We note that the three outermost (i.e. beyond 5°) RGB star metallicity data points of Parisi et al. (2010) sit somewhat above the trend delineated by the measurements at smaller radial distances. Since the luminosity corrections applied in their metallicity estimations were reliant on them determining VHB from rather sparsely populated optical colour–magnitude diagrams, it is conceivable that the abundances for these three fields are systematically in error. As a check, we have used the near-IR approach followed here to re-appraise the metallicities of the stars in HW 86, the only one of these fields for which sufficiently deep photometry [from Infrared Survey Facility (IRSF)] is available. Assuming |$K_{{\rm s}_{{\rm RC}}}$| = 17.35 ± 0.02, we obtain a slightly smaller estimate of the median metallicity but the difference from the optically derived value is not significant and does not shift [Fe/H] here on to the linear trend. Thus considering our data and that of Parisi et al. (2010) together, there is a suggestion that while the metallicity drops relatively rapidly with increasing radius between 0|$_{.}^{\circ}$|5 and 2°–3°, it appears to be almost constant beyond 3°–4°. Interestingly, this is comparable to the radial distance at which the RGB star radial velocities change sign along position angle, PA ≈ 120° (Dobbie et al. 2014).
4 INTERPRETATION AND DISCUSSION
4.1 Metallicity and age across the SMC
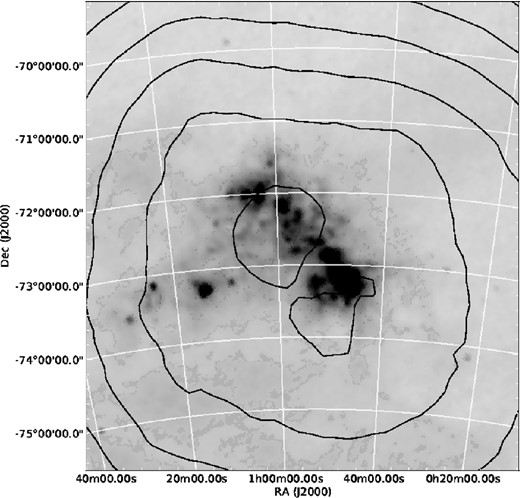
Intrigued by the trends identified above and in view of the large number of stars and the extensive area over which we have abundance measurements, we have constructed a metallicity surface for our survey area by estimating this parameter at a series of regularly spaced grid points in RA and Dec. (every 10 arcmin), using a bi-variate Gaussian smoothing kernel, with an adaptive width corresponding to one-third the distance to the 200th closest star, to weight the individual measurements (e.g. Walker et al. 2006). A contour plot of this surface is displayed in Fig. 6 and a map of the smoothing kernel width is shown in Fig. 7. To first order, these contours are circular and centred on the cloud, re-affirming the prevalence of lower metallicities at larger radial distances. The [Fe/H] = −1.0 contour neatly encapsulates the optically bright regions of the SMC and the metallicity appears to change most rapidly at around these radial distances. The plot suggests that the drop-off in metallicity with increasing distance from the centre is less pronounced towards the limits of our survey region, but the composition gradient also seems to be smaller within the inner degree. We do not believe these features are due merely to the smoothing kernel applied here since a similar plot constructed for a synthetic version of these data, where the decrease in metallicity with radius has been assumed to be perfectly linear, fails to reproduce them. This latter feature could be due to our survey being insensitive to the stellar populations formed within these central regions within the last 1 Gyr and which are likely to be the most metal-rich SMC stars (e.g. Hill, Barbuy & Spite 1997).
![A 6$_{.}^{\circ}$0 × 6$_{.}^{\circ}$5 contour map of the RGB star metallicities. The data around each grid point were smoothed using an adaptive Gaussian kernel with a width corresponding to one-third of the distance to the 200th closest star. The contours correspond to steps of 0.05 dex in [Fe/H] (heavy line [Fe/H] = −1.0 and the dashed lines have lower values).](https://oup.silverchair-cdn.com/oup/backfile/Content_public/Journal/mnras/442/2/10.1093_mnras_stu926/1/m_stu926fig6.jpeg?Expires=1749840947&Signature=unaCyNJlIgFCGnQxjFGxDM7N4Nd-Zzdoc2jCof1alGSRdPCBqO5vDD6ZIspNdFhH6KpWNDKFvn7dVShl1G8OPRuZm6Qc4KveZhdcNO892k-cS1plGgOP99rGflHNHZXlti1FMaEdOCG8UPX~kEViQHpZDIsfIf-YXjG-gdkfciHHkZcyHNRoYA5K1EdP2D3fWzazco0DcI-5bZLlknLGOQZztPZjz0IHnwcteLfWzDSBb9qmuctpPNN7B9ARlhMXwG~i9bzfSx5OZun7SMy3WOrUxGqDmfdXuD-HeyLT1YU3L7mhTX6GorvgBwEQd6pkp0KV58wBovFfaao1~CBQRg__&Key-Pair-Id=APKAIE5G5CRDK6RD3PGA)
A 6|$_{.}^{\circ}$|0 × 6|$_{.}^{\circ}$|5 contour map of the RGB star metallicities. The data around each grid point were smoothed using an adaptive Gaussian kernel with a width corresponding to one-third of the distance to the 200th closest star. The contours correspond to steps of 0.05 dex in [Fe/H] (heavy line [Fe/H] = −1.0 and the dashed lines have lower values).
A 6|$_{.}^{\circ}$|0 × 6|$_{.}^{\circ}$|5 map of smoothing kernel width used in producing Fig. 6. The contours correspond to steps of 10 arcmin with the innermost contour corresponding to 10 arcmin.
Subsequently, to explore the star formation history across the cloud, we have also estimated the ages of our red giant stars, taking advantage of our spectroscopic abundance measurements to break the degeneracy, with respect to age and [Fe/H], of their locations in colour–magnitude space. It is worth re-iterating here the point raised in Cole et al. (2005) that calculations of this nature are prone to substantial uncertainties and as a consequence do not provide a precise evaluation of the age of any given star. For example, a small number of our red giants are likely to be asymptotic giant branch stars (Cole et al. 2000). In these cases the assumption that the stars are on the RGB result in roughly a 30 per cent underestimation of their ages. Moreover, these estimates can be impaired by subtle variations in the reddening across the SMC and the three-dimensional structure of the cloud. Zaritsky et al. (2002) found the extinction distribution for the intermediate-age population has a long tail extending to AV ≈ 1, while the finite depth of the SMC amounts to Δm ≈ ±0.2 mag (Subramanian & Subramaniam 2012). Nevertheless, the generous size of our sample can help to mitigate the impact of these uncertainties.
Although moderately deep, uniform, near-IR photometry is available for our entire survey area from the 2MASS-6X survey (Skrutskie et al. 2006), we have sacrificed some of our extensive spatial coverage for accurate V- and I-band photometry from the MCPS (Zaritsky et al. 2002). The V − I colour provides a better handle (by a factor of approximately 3) on the effective temperatures, and thus masses and ages, of the stars than the J − K colour (e.g. Bessell, Castelli & Plez 1998). Additionally, with the optical photometry we can obtain an estimate of the age and its corresponding uncertainty by exploiting the relation Carrera et al. (2008a) have determined between log10 (age) and MV − MI, MV and [Fe/H]. From cross-correlating our red giant sample against the MCPS data set we have obtained V- and I-band photometry for 2362 observed sources. Subsequently, we have determined MV and MV − MI for 2185 of these, accounting for the effects of reddening using estimates of this from the extinction catalogue of Haschke et al. (2011). This work is based on photometry of red clump and RR Lyrae stars from the third data release from the Optical Gravitational Lensing Experiment (OGLE; Udalski 2003) and unfortunately does not cover the entire area of the MCPS. Additionally, we have assumed a distance modulus for the SMC of (m − M)0 = 18.90 (e.g. Cole 1998; Udalski et al. 1998; Twarog, Anthony-Twarog & Bricker 1999; Kapakos, Hatzidimitriou & Soszyński 2011; Haschke, Grebel & Duffau 2012). Our age estimates for the stars within the 16 innermost 2dF field pointing are shown plotted against [Fe/H] in Fig. 8. The uncertainties in age listed in Table 4 have been estimated following a Monte Carlo approach. We generated thousands of synthetic versions of each star, randomly drawing the magnitudes and the metallicity from normal distributions centred on the measured values of V, I and [Fe/H] and with widths corresponding to the estimated errors on these parameters. Subsequently, these synthetic values of V, I and [Fe/H] were propagated through the age–colour–magnitude–metallicity relation of Carrera et al. (2008a). We adopted values for the coefficients that were similarly drawn from normal distributions centred on their most likely values and with widths corresponding to the quoted coefficient errors. Where the uncertainties have scattered a calculated age to an unphysically large value (i.e. greater than that of the Universe), we have followed a similar approach to previous investigators (e.g. Carrera et al. 2008b) and reset this to 13.5 Gyr (i.e. based on a 13.7 Gyr old Universe; Spergel et al. 2003). Since RGB stars younger than 1 Gyr are not expected to lie near our initial colour–magnitude selection box, the proportion of objects which are determined to be less than 1 Gyr old likely suffer from significant measurement error or are potentially AGB or red supergiant (RSG) star interlopers. Consequently, for our subsequent analysis we have clipped the sample at an age of 1 Gyr, leaving us age/metallicity estimates for 1835 unique sources. We do not expect this approach to dramatically affect our conclusions since our comparison of ages and metallicities from field to field is not of a detailed nature. If required by other investigators, age estimates for all 2185 objects with V and I photometry and reddening data can be re-constructed from the information in Tables 1 and 4.
![A plot of [Fe/H] as a function of age for the 1865 RGB stars with V and I photometry as distributed across each of our inner 16 2dF field pointings.](https://oup.silverchair-cdn.com/oup/backfile/Content_public/Journal/mnras/442/2/10.1093_mnras_stu926/1/m_stu926fig8.jpeg?Expires=1749840947&Signature=tGudk403mSeOLWw05Kdk0Z8IHUg4USFCw0oVujJ3bViYEvSfn05CDC3wvH69Pn30d0Ve~0wySNeYn9BsPImYkBdZZq6qQRzq75KCgzkVs0FmZRsAB--EGgdWHIS4oq8b1hlHxz2Zt20YW2TO5LV1oMdpNAjgqWwjn5mkfUXFkGMG45XXULe7kp6qocJ5pQAPGv44pTFrYZflHRuaGnrigpwo0xq9bciwyRnXAiqV60Ks4m~wvVoQaMI8vqh986HEpdk0NblFSfEhel77Fwehz-AmBm7XlSvI0NLxBVaw0oj4M3eN~29EukbtEeIFOwRtv4mpjFl5eedu7RCfeU1VoA__&Key-Pair-Id=APKAIE5G5CRDK6RD3PGA)
A plot of [Fe/H] as a function of age for the 1865 RGB stars with V and I photometry as distributed across each of our inner 16 2dF field pointings.
Details derived from the 1865 RGB star sources (1835 of which are unique) for which both V- and I-band photometry is available in the MCPS and extinction levels can be estimated from the work of Haschke et al. (2011).
| RA | Dec. | 2MASS J | V | δV | AV | I | δI | AI | log Age/ | δlog Age/ |
|---|---|---|---|---|---|---|---|---|---|---|
| h:m:s | °:′:″ | (mag) | (mag) | (mag) | (mag) | (mag) | (mag) | log (Gyr) | log (Gyr) | |
| 00:23:56.14 | −73:59:26.3 | 00235613−7359263 | 16.51 | 0.03 | 0.07 | 15.03 | 0.03 | 0.04 | 10.13 | 0.00 |
| 00:24:11.97 | −74:54:29.9 | 00241196−7454299 | 16.94 | 0.23 | 0.07 | 15.46 | 0.07 | 0.04 | 9.81 | 0.68 |
| 00:24:13.44 | −74:30:06.3 | 00241344−7430063 | 17.24 | 0.04 | 0.07 | 15.84 | 0.04 | 0.04 | 9.93 | 0.32 |
| 00:24:40.09 | −73:43:46.0 | 00244009−7343460 | 17.10 | 0.03 | 0.05 | 15.74 | 0.02 | 0.03 | 10.13 | 0.00 |
| 00:24:42.47 | −73:45:31.2 | 00244247−7345312 | 16.77 | 0.22 | 0.05 | 15.53 | 0.02 | 0.03 | 9.53 | 0.80 |
The data shown in Fig. 8 affirm the previously identified trend between metallicity and age in the SMC whereby the most metal-rich stars tend to be the youngest (Da Costa & Hatzidimitriou 1998; Idiart, Maciel & Costa 2007; Carrera et al. 2008b; Cignoni et al. 2013). For example, in his analysis of the ages and metallicities of dozens of SMC star clusters, Piatti (2011) found a decrease from around [Fe/H] ≈ −0.5 to −1.0 for the 1–2 Gyr old populations down to typically [Fe/H] ≈ −1.0 to −1.5 for the populations older than 5–6 Gyr. Our data are also accordant with an age–metallicity relation that does not change form substantially across the region covered by our survey. In light of this, we concur with Carrera et al. (2008b) that the observed radial variations in the metallicity are attributable to differences in the proportions of stars of different ages across the SMC, with younger populations concentrated in the central regions. For example, stellar age distributions, constructed for the stars in each of the 16 innermost 2dF field pointings (Fig. 9), show a steady increase to τ ≲ 4 Gyr in the central regions of the cloud, whereas in the surrounding fields these tend to be flatter. This finding is also accordant with the results from recent deep optical imaging studies of the star formation history in several small fields distributed across the SMC (e.g. Dolphin et al. 2001; Cignoni et al. 2012). Based on their population synthesis analyses of colour–magnitude diagrams Cignoni et al. (2013) find that unlike the two fields in their sample located at comparatively large radial distances (greater than 2°) from the centre of the cloud, where initially rather modest rates of star formation appear to have ramped down further within the last 5 Gyr, the more central fields have experienced relatively strong bursts of star formation during this latter period of time.
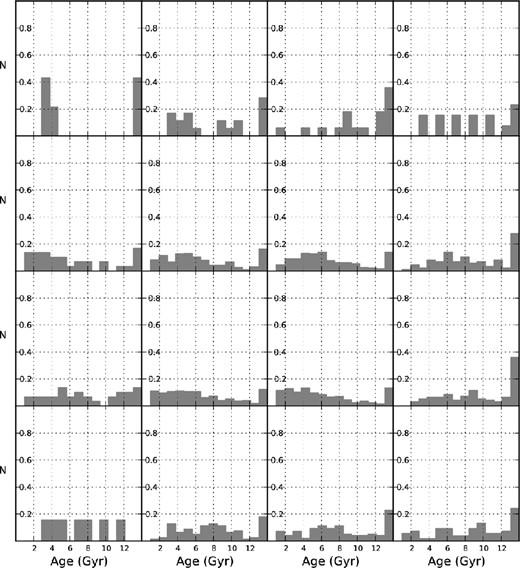
Age histograms for the 1865 RGB stars (including a small number observed with more than one field pointing) with V and I photometry as distributed across each of our inner 16 2dF field pointings.
Notably there are hints of a larger proportion of younger stars in the two fields 3D8 and 3D10, located in the north-east of our survey region and in which we see evidence of a bimodal velocity distribution (Dobbie et al. 2014). This bimodality appears to be associated with two enhancements in the space densities of intermediate-age stars located at around 55 and 65 kpc along these lines of sight (Hatzidimitriou, Cannon & Hawkins 1993; Nidever et al. 2013). It has been proposed by Nidever et al. that the former is a stellar analogue of the Magellanic Bridge. In view of this we have split the RGB star populations of each of these fields into two on the basis of their radial velocities (at 140 km s−1). After applying a small correction to the metallicity measurements of the lower velocity stars to account for their smaller distances (Δ[Fe/H] = +0.06), we have examined the metallicity and the age distribution for each velocity subsample. K–S tests of these age and metallicity data sets (P = 0.70 for metallicity and P = 0.64 for age) are unable to distinguish the two subsamples. Moreover, the age–metallicity relations for these subsamples (Fig. 10) appear to be very similar in form and thus support the proposal of Nidever et al. that the stellar population found around 10 kpc closer to the Sun originated from the SMC, having possibly been stripped off during the most recent encounter with the LMC. Indeed, our crude estimate that these structures separated around 300 Myr, which we derived from the relative position of the peaks in the radial velocity histograms for fields 3D8 and 3D10 (approximately 120 and 155 km s−1; see Dobbie et al. 2014) and the line-of-sight distance between them, is comparable to the time of the last close encounter predicted by back integration of the clouds’ orbits (200 Myr; e.g. Bekki & Chiba 2009).
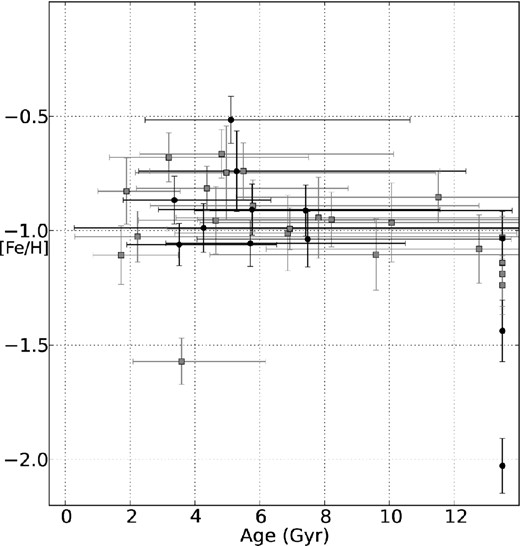
Age–metallicity data for the two subsamples of stars in the north-east region of our survey, vr ≤ 140 km s−1 (black dots) and vr > 140 km s−1 (grey squares).
While the substantial proportion of younger stars in the foreground structure could merely be down to low number statistics, it might also indicate that the most recent encounter between the two clouds has gouged out stars from the inner regions of the SMC and not merely stripped older metal-poor stars from the galaxy's periphery. Indeed, the removal of stars from the depths of the SMC's potential well is envisaged by a recent simulation where the last encounter between the Magellanic Clouds entailed their direct collision (Besla et al. 2012). This model, which naturally accounts for some of the more distinctive morphological characteristics of the LMC (e.g. the offset of the photometric and kinematic centres), also predicts that a significant population of stars torn from the SMC is accreted on to the LMC. Olsen et al. (2011) recently unearthed 30 AGB stars towards the LMC which, from consideration of their kinematics and metallicities, are believed to have originated in the SMC. While the differences we observe between the population densities of the bridge and the counter-bridge structures identified kinematically in Dobbie et al. (2014), also seem to concur with the predictions of the Besla et al. (2012) maximum interaction model, the median metallicity of the accreted SMC stars is only [Fe/H] = −1.25 ± 0.13. This is comparable to the values we observe in the outer parts of our study (e.g. [Fe/H] = −1.1 to −1.2, see Table 3), arguing that these objects are predominantly from the periphery of the cloud. This perhaps indicates that the most appropriate description of the interaction history of the Magellanic system lies somewhere between that defined by a close approach simulation (e.g. Besla et al. 2012; Diaz & Bekki 2012, model 1) and a direct collision model (e.g. Besla et al. 2012, model 2).
4.2 Star formation in the SMC
Our RGB star abundance and age determinations and those from other recent studies of the SMC are indicative of an outside-in progression of star formation activity in this galaxy (e.g. Carrera et al. 2008b; Noël et al. 2009). A similar pattern has been identified in a number of other low-luminosity galaxies, including dwarf irregulars, which have been subjected to analyses of their star formation histories as a function of galactocentric radius. For example, Gallart et al. (2008) studied deep colour–magnitude diagrams of four fields at a range of galactocentric radii (r ≈ 2°–7°) in the LMC and found the age of the youngest stellar population to increase progressively from presently active star formation to 1.5 Gyr, stepping further out from the centre. Additionally, a deep imaging investigation of four isolated dwarf spheroidal and transition galaxies finds that while a 13 Gyr old generation of stars is present throughout each, in three out of the four systems (Tucana, LGS-3 and Phoenix), the radial exponential scalelengths of the stellar distributions decrease with time (Hidalgo et al. 2013).
These low-luminosity dwarfs do not appear to behave merely as scaled down versions of large galaxies, like the Milky Way and M33, where, in accordance with the predictions of ΛCDM cosmology, it has been found that star formation activity is propagating outwards in their discs (Williams et al. 2009; Yuan et al. 2011). Nevertheless, in recent hydrodynamical simulations of the evolution of isolated dwarf galaxies with masses comparable to the Magellanic Clouds, stars form initially in both the central regions and in widely distributed local condensations, rapidly enriching the primordial gas with metals. As the gas is consumed faster in the denser inner parts of these galaxies where the initial star formation rates are higher, the reduction in pressure here draws newly enriched gas inwards and the star formation retreats towards their centres (Pilkington et al. 2012). It is also anticipated that as the result of shocks between colliding supernovae-driven outflows and inflowing gas, some stars still form at larger galactocentric distances (Stinson et al. 2009), but as a consequence of the overall inwards trend, the lower metallicity stars will have a more extended distribution at the present epoch, as is observed in the SMC.
The cycle of periods of increased star formation activity followed by supernovae outflows and stellar winds reducing the fuel available for further genesis of new stars by driving enriched gas out of the galaxies’ central regions (e.g. Governato et al. 2010) is envisaged to lead to 50 per cent of the stellar mass being in place after only 4 Gyr of evolution in a typical dwarf system (Shen et al. 2013). This rate of growth of stellar mass is consistent with empirical estimates for many of the irregulars in the ACS Nearby Galaxy Survey Treasury (ANGST) dwarf galaxy sample of Weisz et al. (2011). However, the SMC is somewhat atypical in that it appears to have experienced relatively modest rates of star formation within the first 6–7 Gyr, as evidenced, for example, by the relative rarity of horizontal branch stars (Noël et al. 2007). Deep colour–magnitude diagrams for the cloud confirm a fitful history of star formation but where the substantial increases in activity have occurred within the last 5–6 Gyr (e.g. 4–6 and 2–3 Gyr ago; Noël et al. 2009; Cignoni et al. 2012). Enhancements around 5–6 and 2 Gyr ago are also evident in the formation rate of SMC star clusters (Piatti 2011). The age distribution of the stars drawn from the most metal-rich quartile of our SMC red giants is largely restricted to values less than 6 Gyr, whereas the age distribution of the corresponding metal-poor stars indicates the bulk of these have formed prior to this period (Fig. 11). Interestingly, this suggests an association between the bursts of star formation activity within the last 5–6 Gyr which are confined to or at least significantly more intense in the inner regions of the SMC and the kinematical signature we observe in our metal-rich RGB stars, which we tentatively ascribed to a disc-like structure (Dobbie et al. 2014).
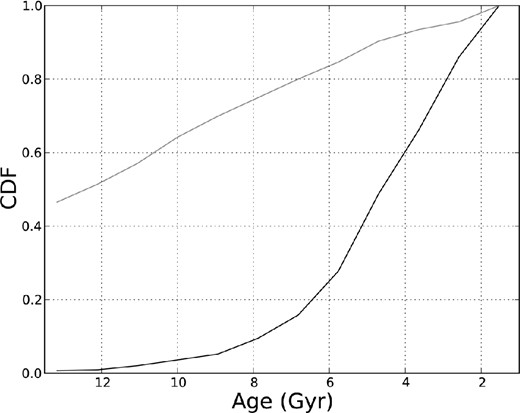
Cumulative distributions for the ages for those sources within the metal-rich (black line) and metal-poor (grey line) quartiles of our RGB star sample for which we have MCPS V- and I-band photometry and age estimates.
Although recent hydrodynamical simulations can reproduce outside-in progression of star formation in isolated low-mass galaxies, the slightly unusual star formation history of the SMC suggests another mechanism may have driven or at least be influencing the star formation rate here. Two mechanisms which can enhance this in galaxies and are relevant in the context of the SMC are mergers (e.g. Sanders et al. 1988; Mihos & Hernquist 1994) and tidal interactions (e.g. Bekki 2008). Hopkins et al. (2009) highlight that from both the theoretical and the empirical points of view, almost every galaxy has undergone a minor merger (mass ratio ≲0.1) within the last few billion years and that major mergers are also not uncommon. In the merging of two gas-rich galaxies, torques between stellar and gaseous structures arising from the non-axisymmetric potentials result in a proportion of the gas losing its angular momentum and falling into central regions. This leads to a substantial upturn in the star formation rate here and the pre-merger stars being transformed into a pressure-supported population (Hopkins et al. 2013). A number of investigators have attributed the quite different spatial and kinematic properties of the gas, the young stars and the red giants in the SMC to a merger several billion years ago (e.g. Rafelski & Zaritsky 2005; Bekki 2008; Subramanian & Subramaniam 2012). However, Stinson et al. (2009) have demonstrated that processes such as disc sloshing and simple disc shrinkage can lead to the formation of extensive halo-like stellar populations around dwarf galaxies, without the need to invoke galaxy–galaxy mergers (see also Nidever et al. 2011). A recent theoretical exploration of the chemical evolution of the SMC, which treats a galaxy–galaxy merger several Gyr ago with a mass ratio of between 1:1 and 1:4, anticipates a rather pronounced dip in the age–metallicity relation around this time (Tsujimoto & Bekki 2009). There seems to be little support for an event of this magnitude from recent empirical determinations based on both star clusters and field stars (Piatti 2011, 2012). Moreover, the lack of a large difference between the velocity dispersions of the metal-rich (|$\sigma _{v_{{\rm los}}}$| ≈ 22 km s−1) and the metal-poor (|$\sigma _{v_{{\rm los}}}$| ≈ 26 km s−1) quartiles of our RGB star sample, predominantly formed less than and more than 6 Gyr ago, respectively, also seems to disfavour the notion that a major merger occurred prior to 4–5 Gyr ago. It remains possible that systems with more extreme mass ratios have merged with the SMC. Indeed, the subtle positive correlation of the velocity dispersion of our RGB star population with age (Dobbie et al. 2014) is in accord with the overall trend predicted by recent cosmological dwarf galaxy simulations of Shen et al. (2013), which they attribute to the scattering of the stars that formed early-on by (presumably minor) mergers.
Cignoni et al. (2012) have proposed that tidal interactions between the Magellanic Clouds and the Galaxy about 5.5 Gyr ago might be responsible for the first substantial burst, which has also been associated with formation of the LMC bar (e.g. Smecker-Hane et al. 2002). Tidal interactions can precipitate the formation of dynamical structures which drive gas inwards and stimulate star formation, particularly within the central regions of galaxies through the compression of gas to critical densities necessary to ignite the process (Hopkins et al. 2009). In a recent theoretical investigation of the relationships amongst these three galaxies, where the proper motion of the SMC has been derived from a combination of ground-based (Vieira et al. 2010) and space-based measurements (Kallivayalil, van der Marel & Alcock 2006), Diaz & Bekki (2012) find that for at least the last 5 Gyr, the Magellanic Clouds have orbited within the virial radius of the Galaxy and have experienced three peri-Galactic passages of around 50 kpc, including one about 5 Gyr ago. Since the LMC and SMC were separated at this time by more than 100 kpc, it is unlikely, in this interpretation, that tidal interaction between the clouds triggered the burst of activity imprinted on the star formation histories of both galaxies 4–6 Gyr ago. However, cosmological studies of satellite populations of Milky-Way-like galaxies and a very recent assessment of the clouds proper motions have cast doubt on whether the SMC–LMC system has previously experienced a close encounter with the Galaxy (Tollerud 2012; Kallivayalil et al. 2013). The preferred ‘first orbit’ scenario, makes it difficult to attribute the increases in the SMC star formation activity at 4–6 and 2–3 Gyr ago to peri-Galactic passages. The Magellanic Stream is then explained as forming around 2 Gyr ago when the LMC and SMC first became a strongly coupled binary system (e.g. Diaz & Bekki 2012).
The coincidence between the times of major star formation episodes around 5 Gyr (and at 2–3 Gyr) in both Magellanic galaxies points towards a common trigger. If this was not a tidal encounter with the Milky Way then it seems likely to have been a mutual interaction. Indeed, in the orbital models of Besla et al. (2010), the LMC and SMC experienced a pericentre passage around 5 Gyr ago when they were separated by only 30–40 kpc. The subsequent LMC–SMC pericentre also appears to coincide with another Magellanic wide burst of star formation around 2–3 Gyr ago (e.g. Harris & Zaritsky 2009), when the stream is believed to have formed, although these models are unable to reproduce the current positions and velocities of the clouds. Nonetheless, considering the cosmological arguments for them being on their first orbit of the Galaxy and the results of recent theoretical and observational investigations, including the star formation histories of both galaxies, the results of our kinematical investigation of the SMC RGB star population (Dobbie et al. 2014) and the stellar abundance and age estimates, we are led to favour a model in which interactions between the SMC and the LMC, beginning 5–6 Gyr ago, led to an increase in the flow of gas into the central regions of the nascent disc of the former that promoted the development of giant molecular clouds and resulted in an upsurge in the star formation rate. However, until better constraints are available on the proper motions of both Magellanic Clouds it is unlikely that it will be possible to reach a definitive conclusion on this matter.
5 SUMMARY
We have obtained optical spectroscopy for 3037 SMC red giant stars distributed across 37.5 deg2 of the SMC. From these data we have measured their metallicities and have the following.
Affirmed that the median metallicity of stars at larger radial distances from the optical centre of the cloud is lower, at least out to r ≈ 5°. A linear model fit to [Fe/H] as a function of radial distance has a gradient of −0.075 ± 0.011 dex deg−1.
Exploited the MCPS data to estimate ages for 1835 RGB stars, confirming that the stellar age–metallicity relation has a similar form across our survey area and that there is a trend in the SMC for younger objects to have larger metallicities. The observed radial abundance gradient reflects that stars in the central regions of the SMC are generally younger than those at larger radial distances.
Demonstrated that the age–metallicity relation of the intermediate-age stellar population located around 10 kpc in front of the north-east of the cloud is similar to that of the main body of the SMC, in accord with the recent proposal by Nidever et al. (2013) that this is a stellar analogue of the Magellanic Bridge.
Found that the stars in the spatially extended most metal-poor quartile of our RGB sample are typically older than 6 Gyr.
Determined that the metal-rich quartile of our RGB stars predominantly have ages less than approximately 6 Gyr, and were probably formed during periods of substantial enhancements in the star formation rate of the SMC. These appear to be associated with bulk rotational motion which we have tentatively associated with disc-like structure.
After consideration of recent theoretical and observational investigations of the clouds and cosmological arguments, concluded that an interaction between the LMC and the SMC was the likely trigger for the upturn in stellar genesis that is imprinted on the star formation history of the central SMC around 5–6 Gyr ago.
This publication makes use of data products from the Two Micron All Sky Survey, which is a joint project of the University of Massachusetts and the Infrared Processing and Analysis Center/California Institute of Technology, funded by the National Aeronautics and Space Administration and the National Science Foundation. This research was supported under the Australian Goverment's Australia–India Strategic Research funding scheme (reference number ST040124). We thank Russell Cannon for his input during the planning phases of this project. We thank the referee for helpful and constructive reports on our two SMC papers.
REFERENCES
SUPPORTING INFORMATION
Additional Supporting Information may be found in the online version of this article:
Table 1. Details of the 3037 SMC red giant stars, including our Ca ii triplet equivalent width measurements and abundance estimates.
Table 4. Details derived from the 1865 RGB star sources (1835 of which are unique) for which both V- and I-band photometry is available in the MCPS and extinction levels can be estimated from the work of Haschke et al. (2011) (Supplementary Data).
Please note: Oxford University Press is not responsible for the content or functionality of any supporting materials supplied by the authors. Any queries (other than missing material) should be directed to the corresponding author for the article.
