


Abstract
We study dwarf satellite galaxy quenching using observations from the Geha et al. NASA-Sloan Atlas/SDSS catalogue together with Λ cold dark matter cosmological simulations to facilitate selection and interpretation. We show that fewer than 30 per cent of dwarfs (M⋆ ≃ 108.5 − 9.5 M⊙) identified as satellites within massive host haloes (Mhost ≃ 1012.5 − 14 M⊙) are quenched, in spite of the expectation from simulations that half of them should have been accreted more than 6 Gyr ago. We conclude that whatever the action triggering environmental quenching of dwarf satellites, the process must be highly inefficient. We investigate a series of simple, one-parameter quenching models in order to understand what is required to explain the low quenched fraction and conclude that either the quenching time-scale is very long ( > 9.5 Gyr, a ‘slow starvation’ scenario) or that the environmental trigger is not well matched to accretion within the virial volume. We discuss these results in light of the fact that most of the low-mass dwarf satellites in the Local Group are quenched, a seeming contradiction that could point to a characteristic mass scale for satellite quenching.
1 INTRODUCTION
The cessation of star formation in galaxies is a well-studied and yet poorly understood phenomenon. That galaxies, when placed on a colour–magnitude diagram, can roughly be divided into a red, non-star-forming sequence of mostly ellipticals and a blue, star-forming cloud of mostly spirals has been observed at least out to z ∼ 1 (Baldry et al. 2004; Bell et al. 2004; Borch et al. 2006; Cooper et al. 2007). It is also observed that while the number density of star-forming galaxies is relatively constant at z < 1, non-star-forming (or quenched) galaxies have roughly doubled in number density over the past 7–10 Gyr (Bell et al. 2004; Borch et al. 2006; Bundy et al. 2006; Brown et al. 2007; Faber et al. 2007).
Environment appears to play a significant role in star formation quenching, and it may be the dominant driver at the lowest mass scales (Cooper et al. 2006; Weinmann et al. 2006a; Capak et al. 2007; Peng et al. 2010; Geha et al. 2012; Woo et al. 2013). Studies comparing satellite galaxies to isolated field systems of similar stellar mass in the local Universe find that satellites tend to exhibit lower star formation rates, more bulge-dominated morphologies, as well as older and more metal-rich stellar populations (Baldry et al. 2006; Yang et al. 2007; van den Bosch et al. 2008; Cooper et al. 2010; Pasquali et al. 2010). This observed suppression of star formation in satellite galaxies is commonly referred to as ‘environmental quenching’.
Proposed quenching mechanisms that operate preferentially on satellite galaxies within dense environments (such as groups and clusters) range from ‘strangulation’ – when the larger potential well of the host dark matter halo accretes all of the gas that would have originally fuelled star formation in the satellite galaxy (Larson, Tinsley & Caldwell 1980; Kawata & Mulchaey 2008), to ‘harassment’ – by which close encounters between densely packed cluster or group members strip gas from around the interacting galaxies (Moore et al. 1996), to ‘ram-pressure stripping’ – where the cold dense gas at the centre of the satellite is violently removed from the galaxy as a result of a high-speed interaction with the hot gas halo of the host (Gunn & Gott 1972; Bekki 2009).
Determining exactly how environmental quenching proceeds is complicated by the fact that some galaxies in the field are quenched. For isolated galaxies, free of the influence of high-density environments (i.e. a more massive parent halo), the quenched fraction increases significantly with stellar mass (Weinmann et al. 2006a; Peng et al. 2010). This suggests that galaxies, at least massive galaxies, quench their own star formation independent of their environment. These observational results are supported by hydrodynamical simulations of isolated systems, in which star formation is suppressed owing to the formation of a merger-induced stellar spheroid that stabilizes the disc to the collapse of molecular clouds (Dekel, Sari & Ceverino 2009; Martig et al. 2009). This possible quenching mechanism is unique in that it depends on the mass of the stellar spheroid rather than that of the parent dark matter halo (i.e. environment). Owing to the fact that self- and environmental quenching primarily affect the quenched fraction at different mass scales (with environmental quenching playing a primary role in low stellar mass systems, and mass quenching primarily affecting galaxies with a higher stellar mass), several authors have argued for a separation of quenching at low redshift into two functions – one of environment and one of stellar mass (Peng et al. 2010; Kovač et al. 2014). Disentangling these two potential quenching regimes and identifying the associated physical mechanisms that operate within them remains a challenge for modern studies of galaxy evolution at low and intermediate redshift.
In overcoming these challenges, it is therefore desirable to model both of these quenching mechanisms. Several studies have attempted to model the effects of both self- and environmental quenching using semi-analytic prescriptions. The resulting models typically associate quenching with various properties of a galaxy, such as the time since it fell into its host, in order to match observed quenched fractions as a function of stellar mass while also reproducing the observed stellar mass function (Wetzel et al. 2013; Cohn & White 2014). However, this overlapping of effects at stellar masses greater than ∼ 1010 M⊙ continues to make a separate analysis of each mechanism difficult.
Dwarf galaxies offer a particularly useful avenue for disentangling the effects of environmental and self-quenching. As shown by Geha et al. (2012, hereafter G12), effectively all isolated dwarf galaxies are star forming, suggesting that self-quenching for these systems is negligible. Specifically, G12 found that non-star-forming (or passive) galaxies with stellar mass below ∼ 109 M⊙ are absent beyond ∼1–1.5 projected Mpc of a luminous neighbour in the local Universe (see also Wang et al. 2009). The observations suggest that dwarf galaxies at these low masses do not shut down their own star formation; instead quenching requires the presence of a more massive neighbour. These galaxies therefore provide an ideal experimental sample: they do not self-quench, so any observed quenching can be directly related to environmental influences.
In addition to isolating the impact of environment on low-mass galaxies, the analysis by G12 provides well-defined, quantitative observational constraints on potential quenching mechanisms. For example, G12 probe the physical extent of environmental quenching, finding that dwarf galaxies are only quenched within a projected distance of ∼1–1.5 Mpc of a luminous galaxy. They interpret this result by suggesting that dwarfs are being quenched at two–four times the virial radii of their Milky Way size hosts. Below, we use cosmological simulations to suggest an alternative scenario in which the |${\sim } 1\text{--}1.5 \, \rm \, Mpc$| scale more likely corresponds to the virial radius of galaxy groups or small clusters. Moreover, G12 also find that even within 250 kpc of a luminous neighbour, the fraction of quenched systems peaks at ∼25–30 per cent. The implication of these findings is that satellite quenching is remarkably inefficient at low stellar masses, and we can constrain quenching models through the requirement that they match this low efficiency.
In what follows, we compare mock observations of a large N-body simulation to the observed quenched fractions versus projected distance to a luminous neighbour from G12. We consider several one-parameter models for quenching, including a simple quenched-at-infall scenario as well as models where quenching depends on the host Vmax, satellite infall time, or the ratio of the satellite's current Vmax to the Vmax it had at infall. In Sections 2 and 3, we describe the G12 observational sample and our simulations, respectively. Section 4 presents our principal results. Finally, we summarize our findings in Section 5 and discuss them in light of past work in Section 6.
2 OBSERVATIONS
Our observational comparisons rely on the work of G12, who construct a dwarf galaxy sample selected from the NASA-Sloan Atlas (NSA) of the Sloan Digital Sky Survey (SDSS) Data Release 8 spectroscopic catalogue with an improved background subtraction technique (Aihara et al. 2011; Blanton et al. 2011). G12 investigate the fraction of quenched dwarf galaxies as a function of projected distance to a more luminous neighbouring galaxy with a velocity offset of 1000 km s−1 or less. The dwarfs in this sample have stellar masses that range from 7.5 < log ( M⋆/ M⊙) < 10. The luminous neighbouring galaxies are selected from the 2MASS Extended Source Catalog (Skrutskie et al. 2006) and have stellar masses of M⋆ > 2.5 × 10¹⁰ M⊙. We investigate a subset of the dwarf sample for simplicity, focusing on the stellar mass bins 8.25 ≤ log ( M⋆/ M⊙) < 8.75 and 9.25 ≤ log ( M⋆/ M⊙) < 9.625.
G12 define quenched galaxies as having both no Hα emission and |$D_n4000 > 0.6 + 0.1\, \text{log}_{10}( \, M_{\star }/\rm \, M_{{\odot }})$|, a criterion based on the light-weighted age of the stellar population. We adopt the same definition of quenched for the observations in this work. See G12 for more details on the observational sample.
3 SIMULATIONS
We use the Millennium II Simulation (MS-II; Boylan-Kolchin et al. 2009) to construct a mock galaxy catalogue with the goal of mimicking, via abundance matching, the sample used in G12. MS-II is a dark matter-only simulation of 21603 ≈ 10 billion particles in a box of size Lbox = 100 h−1 Mpc, with a particle mass of mp = 6.885 × 10⁶h−1 Mpc and a Plummer-equivalent force softening of ϵ = 1 h−1 kpc in comoving units. The cosmological parameters are Ωtot = 1.0, Ωm = 0.25, Ωb = 0.045, ΩΛ = 0.75, h = 0.73, σ8 = 0.9, and ns = 1, where σ8 is the rms amplitude of linear mass fluctuations in 8 h−1 Mpc spheres at z = 0 and ns is the spectral index of the primordial power spectrum. The simulation stores all gravitationally self-bound dark matter subhaloes down to 20 particles, which corresponds to a resolved mass of 1.38 × 10⁸ M⊙. Thus, MS-II is more than adequate to make realistic comparisons to our data, as it has the resolution required to resolve the subhaloes that would likely host the galaxies in the G12 sample.
In the figures that follow, the simulation data are constructed by selecting haloes that lie in two distinct Vmax (taken at infall for subhaloes) bins. The lower (upper) Vmax bin contains haloes with 80 km s−1 < Vmax < 90 km s−1 (100 km s−1 < Vmax < 110 km s−1) and roughly corresponds, via abundance matching (Boylan-Kolchin, Bullock & Kaplinghat 2012), to the G12 stellar mass bin centred at M⋆ = 108.5 M⊙ ( M⋆ = 109.5 M⊙). However, rather than making an explicit comparison between a single Vmax bin and a single bin in stellar mass in the plots, we attempt to encompass the uncertainty of abundance matching at low Vmax by comparing points from the G12 data to shaded bands that show results (for example, the fraction of the dwarf haloes that are subhaloes) as we vary Vmax between these two selection bins. In practice, our results are not strongly sensitive to the precise range of Vmax corresponding to the satellite stellar masses from the NSA. This is evidenced by the fact that these bands are relatively thin in the following figures.
In selecting subhaloes, we use the Vmax at infall, hereafter Vinfall, where infall is defined in MS-II as the time at which a halo most recently became a subhalo (see Section 4.2). This ensures that any tidal stripping that a subhalo has experienced will not introduce biases in the abundance matching for that halo. Behroozi et al. (2014) have recently shown that Vinfall is distinct from Vpeak (the largest value of Vmax in the subhalo's history), that Vpeak is typically set by a 1:5 merger, and that the time at which it occurs does not correspond to the time at which the halo mass peaks. However, Vinfall does correspond to the peak halo mass. Thus, we consider the Vmax/Vinfall ratio to be a better proxy for mass-loss of a subhalo than would be Vmax/Vpeak. We select only those haloes that have a Vmax/Vinfall > 3/8, ensuring that our sample is complete down to our lower Vinfall limit of 80 km s−1, as MS-II is complete down to a current Vmax of 40 km s−1.
For simplicity and without loss of generality, we mock-observe the simulation by placing the ‘observer’ at the origin. Then, following G12, we determine the projected distance, dNeighbour, from each halo in our dwarf mass range to the closest (in projected distance) halo that would be likely to host a more luminous galaxy. We use the term ‘luminous neighbour’, once again following G12, but will use quotation marks when we are actually referring to the dark matter halo of the luminous neighbour. We choose a minimum Vinfall of 150 km s−1 for the population of ‘luminous neighbours’ which corresponds – according to the abundance matching relation of Boylan-Kolchin et al. (2012) – to the stellar mass limit ( > 1010.4 M⊙) used to select luminous neighbours in G12. In our mock observations, there are instances where the ‘luminous neighbour’ of the dwarf is not the dwarf's actual host, but a subhalo of larger halo. Therefore, we use the Vinfall of the ‘luminous neighbours’ instead of their Vmax unless we are referring to a subsample of the ‘luminous neighbours’ for which all of the objects are actual host haloes in the simulation.
In order to match the observations of G12 so that we can make appropriate comparisons, we follow exactly their method of removing contaminants in the sample. We remove haloes that are close in projection but distant in velocity space by making sure that the velocity offset between the dwarf and the ‘luminous neighbour’ is less than 1000 km s−1. This cutoff will indeed remove some interlopers, but as Phillips et al. (2014) show, even with a more restrictive velocity offset maximum of 500 km s−1 and the imposition of a set of isolation criteria designed to remove groups and cluster haloes, false pairs are still quite common. For Large Magellanic Cloud (LMC)-sized satellites within 350 kpc of isolated Milky Way analogues, Phillips et al. (2014) show that the ‘host-satellite’ pairs are still false pairs 25 per cent of the time. This suggests that with our 1000 km s−1 cutoff and no isolation criteria, we will quite often identify a ‘luminous neighbour’ that is not the actual host of the dwarf, even when the pairs are close in projection. Nonetheless, we use the 1000 km s−1 velocity offset in order to exactly match what was done for the observations from G12 so that our comparisons to their data are meaningful.
Although Guo et al. (2011) and Moster, Naab & White (2013) have constructed mock catalogues of galaxies with star formation rates and colours derived from semi-analytic models applied to MS-II, we have independently confirmed results (Weinmann et al. 2006b; Kimm et al. 2009; Wang & White 2012; Wang et al. 2014) showing that the semi-analytic models overpredict the red fraction of satellites significantly. By relying instead on our simple models applied to subhaloes, we aim to gain insight into the basic prescriptions that will be required to match the data more effectively in the future.
4 RESULTS
4.1 Quenched fraction versus subhalo fraction
The symbols (circles and triangles) in Fig. 1 reproduce results from G12: the fraction of dwarfs that are quenched is plotted as a function of projected distance from their nearest luminous ( M⋆ > 2.5 × 10¹⁰ M⊙) neighbour. As emphasized in G12, the quenched fraction is effectively zero at large dNeighbour separation, rising to ∼25–30 per cent at the smallest separations. For comparison, the black band shows the fraction of dwarf haloes in the simulation – identified by mock observations that mirror exactly those used by G12 to produce the data points (see Section 3) – that are known subhaloes [i.e. that are subhaloes within a larger friends-of-friends (FOF) group].
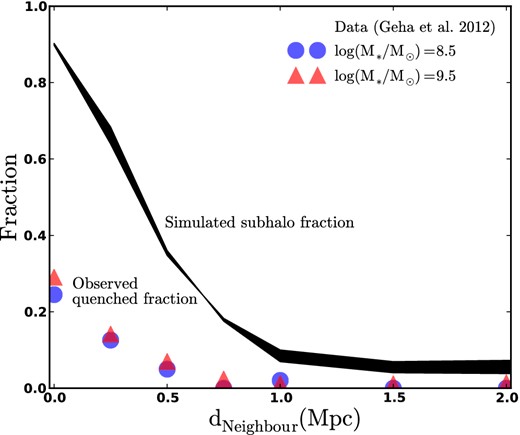
The fraction of quenched dwarf galaxies as a function of the projected distance from the nearest luminous neighbour (symbols, reproduced from G12). For comparison, the black band shows the fraction of those dwarf galaxies that are expected to reside within subhaloes of a larger host, plotted as a function of the same separation measure, as determined by mock observations of the MS-II cosmological simulation. The thickness of this band corresponds to a range of Vmax choices for identifying dwarf haloes, as discussed in Section 3. The subhalo fraction is always well above the quenched fraction, meaning that it is impossible for all subhaloes to be quenched; rather, satellite quenching at these mass scales must be fairly inefficient.
Fig. 1 reveals at least two interesting points for elaboration. First, the subhalo fraction remains non-zero even at very large dNeighbour separation, hovering just under 10 per cent in a region of the figure that is designed to target isolated galaxies. The reason for this is that galaxies at large separation from luminous neighbours can nevertheless be subhaloes of dimmer hosts that fall below the luminosity cut (for our purposes, haloes with Vmax < 150 km s−1; as demonstrated explicitly in Fig. 2 and discussed below). The fact that observed dwarfs at these large dNeighbour separations are all star forming, even though ∼5–10 per cent of them are identified as subhaloes of something, immediately demands that not all subhaloes are quenched. A second point of note in Fig. 1 is that the subhalo fraction rises to ∼90 per cent at small dNeighbour, while the quenched fraction remains relatively low by comparison (∼25–30 per cent). We see again that the mere act of being a subhalo cannot result in immediate quenching.
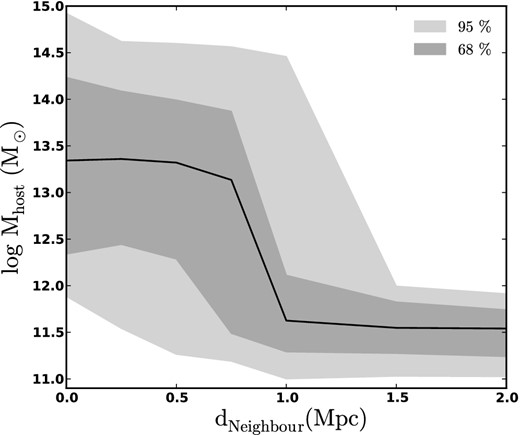
Range of virial masses (95 per cent, light grey; 68 per cent, dark grey) for the actual hosts of subhaloes identified in Fig. 1. Hosts of dwarfs found close to luminous neighbours have a range of viral masses spanning the group to cluster scale ∼ 1012.5 − 14 M⊙, while hosts of dwarfs found far from large neighbours are concentrated around a much lower mass, 1011.5 M⊙. The sharp decrease in the quenched fraction below |${\sim } 0.75\text{--}1$| Mpc seen in Fig. 1 is likely associated with the virial radius scale of groups or small clusters.
Fig. 2 provides a more detailed examination of the mock observations used in Fig. 1, concentrating on the subset of haloes in each dNeighbour bin that are identified as subhaloes. The shaded bands show the range of host virial masses inhabited by subhaloes for a given dNeighbour separation.1 The median halo mass is plotted as a solid black line, while the 68 and 95 per cent regions are shown in dark and light grey, respectively. As expected, dwarf haloes that are identified as subhaloes with dNeighbour ≳ 1 Mpc have much smaller host masses than the dwarfs with dNeighbour < 0.5 Mpc. Dwarfs within ∼0.5 Mpc are found preferentially in cluster size host haloes. Although we cannot rule out the hypothesis of G12 that the drop-off in the quenched fraction seen at ∼1 Mpc corresponds to 2–4 times the virial radius of a typical M⋆ ∼ 3 × 10¹⁰ M⊙ galaxy, we find this scenario unlikely as it would imply that satellites are being quenched at equal or greater efficiency where the ambient gas density is very low relative to satellites within the virial radius of clusters or large groups. Thus, we find that a natural alternative explanation for the quenched fraction drop-off at ∼1 Mpc is that it is set by the typical virial radius of a large group or a small cluster.
The preceding discussion has shown that satellite quenching is far too inefficient to be caused simply by a galaxy becoming a satellite (i.e. falling into another dark matter halo). The fraction of observed quenched dwarfs in the inner bin of Fig. 1 (within 250 kpc of a more luminous neighbour) is just over 25 per cent, while over 90 per cent of simulated dwarfs selected in the same manner and at the same projected distance are subhaloes (typically, of ∼ 1013.5 M⊙ hosts). This implies that at most ∼30 per cent of subhaloes are quenched. This disparity between subhalo fraction and observed quenched fraction is consistent with known problems faced by many models of galaxy formation in explaining observed satellite red fractions. In particular, models in which gas is instantaneously stripped from an infalling satellite upon entering into the host's virial radius overpredict satellite red fractions (e.g. Kimm et al. 2009). In the next section, we explore a few simple models in order to understand what is required to explain the relatively low fraction of quenched dwarf satellites seen in the G12 data.
4.2 Testing simple models for quenching
Fig. 2 shows that the host haloes of the star-forming dwarfs at large dNeighbour are systematically less massive than those of the dwarfs found within 1 Mpc of a luminous neighbour. Since dwarfs at these large distances are uniformly star forming, this suggests a simple model that limits quenching to hosts above a minimum halo mass. A model of this kind might be motivated by the transition mass at which a quasi-static gaseous corona forms (Kereš et al. 2005; Birnboim, Dekel & Neistein 2007; More et al. 2011). However, several authors have argued that trends between the quenched fraction and host mass could be strongly affected by ‘pre-processing’, whereby the satellites falling into massive hosts have previously fallen into less massive host haloes that are then accreted on to the more massive systems, and thus have been preferentially quenched by the first host that they fell into (van den Bosch et al. 2008; De Lucia et al. 2012; Wetzel et al. 2013).
To investigate the possibility that satellites are only quenched when falling into a host above a certain halo mass, we develop a ‘minimum mass’ quenching model for which the resulting dependence of quenched fraction on projected distance is shown in Fig. 3. In this model, we define a dwarf to be quenched once it joins the FOF group of a host more massive than a threshold Vmax, which we use as a proxy for host halo mass. If we set this minimum host Vmax to be the minimum Vinfall required for a halo to be considered a ‘luminous neighbour’, Vinfall > 150 km s−1 (shown as a cyan band), we can easily reconstruct the observed quenched fraction of 0 at |$d_{\rm Neighbour} > 1\text{--}1.5\ \text{Mpc}$|. This is a result of the fact that subhaloes this far from their ‘luminous neighbours’ have hosts that are not luminous enough to fall into the ‘luminous neighbours’ category. If the actual hosts were luminous enough, we would have identified them as the ‘luminous neighbour’, and the dNeighbour would reflect this shorter distance to the actual host. This model does, however, have significant trouble reproducing the observed quenched fraction at small dNeighbour, with the predicted quenched fraction exceeding 90 per cent for dwarfs with dNeighbour < 250 kpc, even when we require the host to have Vmax > 150 km s−1.
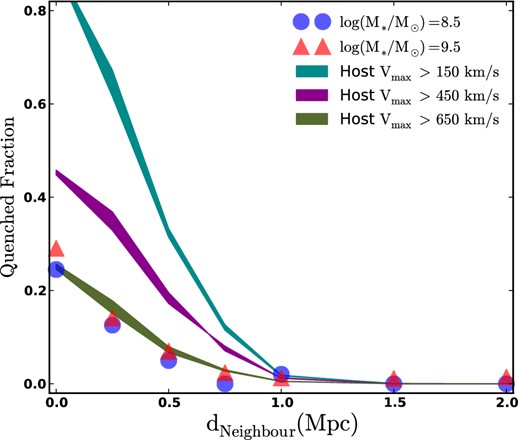
The relationship between quenching and host halo mass. Coloured bands show the predicted quenched fraction in a model where subhaloes become quenched only when their host mass is above a given threshold: Vmax > 150 km s−1 (cyan), >450 km s−1 (magenta) and >650 km s−1 (green). The symbols are the same data points shown in Fig. 1. Reproducing the data requires a minimum host Vmax of 650 km s−1, which is much too large given existing constraints on satellite quenching in lower mass hosts. The thickness of the bands illustrate how our results change as we vary the Vinfall range used in identifying dwarf galaxy haloes, as discussed in Section 3.
Only when we restrict quenching to satellites within host haloes of Vmax > 650 km s−1 is our model able to match the observed quenched fraction. However, this is an unrealistically high value for a Vmax threshold. Several studies have shown that satellites are quenched in excess of the field when seen around hosts with much smaller halo masses (Monachesi et al. 2011; More et al. 2011; Tollerud et al. 2011). For example, using a carefully designed sample to target Milky Way-sized hosts, Phillips et al. (2014) find that LMC-sized satellites are quenched with an excess of roughly 16 per cent compared to galaxies in the field. Furthermore, our own Milky Way, with a (dark matter) Vmax less than 220 km s−1 (excluding the disc contribution), has many quenched satellites, as does M31 (Mateo 1998; McConnachie 2012). We conclude that a simple model whereby a subhalo becomes quenched only after falling within a massive (Vmax > 650 km s−1) host is unrealistic.
It is, perhaps, more plausible that infall time is the primary factor in determining whether a satellite becomes quenched. Models of this kind are popular and physically motivated (De Lucia et al. 2012; Wetzel et al. 2013). Because infall time is linked to distance from the centre of the potential well in the host halo, infall time models naturally reproduce observed gradients in colour with cluster-centric distance (see Hearin et al. 2013, who demonstrate this qualitative result with a more sophisticated model, and Smith et al. 2012).
We explore infall time (τinfall) as a quenching parameter by associating subhaloes with quenched galaxies based on the time they most recently became a subhalo of another halo in the simulation. In the MS-II data base, the last time at which a halo becomes a subhalo is determined by the parameter infallSnap: the most recent snapnum at which the subhalo went from being at the centre of its own FOF group to being inside another halo's FOF group. In our τinfall model, then, a galaxy becomes ‘quenched’ after falling into another galaxy's FOF group and orbiting for a minimum amount of time. Because we use this definition of infall time, in cases where the initial crossing was followed by a subsequent pass outside the FOF group, we specifically associate infall time with the last time the subhalo joined the FOF group. However, because the definition is based on FOF group instead of virial radius, some subhaloes that pass outside the virial radius of their host but stay within the FOF group will still be counted as subhaloes, with an infall time dictated by when they first fell into their host. This should account for some of the ‘backsplash’ galaxies, which Wetzel et al. (2014) have concluded should behave very similarly to satellite galaxies in terms of quenching. In cases where the subhalo was originally accreted as a subhalo of something else (e.g. infall into a cluster as part of a group), our definition means that we track the first time the object became a subhalo to measure infall time.
The results of this model are illustrated in Fig. 4, where once again we are comparing to the observed quenched fractions from G12 (blue circles and red triangles). Here, the cyan band is the fraction of all dwarfs that are subhaloes and that became subhaloes over 4 Gyr ago. Within 250 kpc, almost 80 per cent of all dwarfs have been orbiting within their host haloes for over 4 Gyr. Nearly 60 per cent have been orbiting for over 7 Gyr, shown as the yellow band. In order to reproduce the observed quenched fraction at small separations (dNeighbour < 250 kpc), we must restrict quenching to only those satellites that fell into their host halo more than 9.5 Gyr ago. The quenched fraction that corresponds to this relatively extreme criterion is shown as the green band in Fig. 4. This quenching time-scale is very long, and suggestive of a very inefficient quenching process, more like strangulation than ram-pressure stripping at the virial radius. We discuss this result in relation to other work in Section 6.
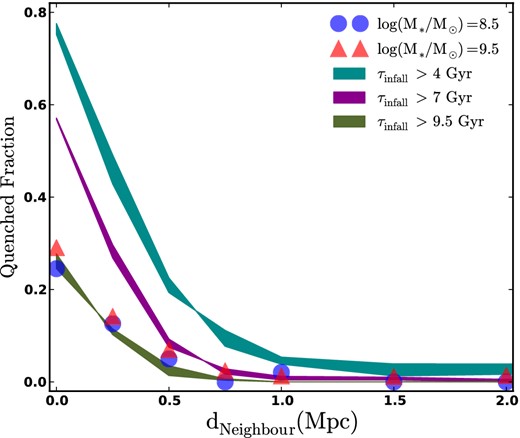
The relationship between quenching and infall time. Coloured bands show the predicted quenched fraction in a model where subhaloes become quenched only after a time τinfall of orbiting within a host: τinfall > 4 Gyr (cyan), > 7 Gyr (magenta) and > 9.5 Gyr (green). This model works only with rather long quenching time-scales, τinfall > 9.5 Gyr. The thickness of the bands correspond to different ranges of Vmax used to identify dwarf haloes, as discussed in Section 3.
Alternatively, subhalo quenching may have less to do with crossing the virial radius boundary than it does with a more central encounter, where tidal forces are greater and the hot gas density of the host halo is higher and more effective at ram-pressure stripping. While infall time is partially correlated with halo-centric distance, we explore a model that ties quenching to a parameter that more directly traces the tidal forces experience by a subhalo: the ratio of Vmax at z = 0 to Vinfall. Fig. 5 shows the results of this model with the fraction of dwarfs with current Vmax smaller than 85, 75 and 65 per cent of their Vinfall values plotted as cyan, magenta and green bands, respectively. Using this model to define when a satellite galaxy is quenched, we roughly match the observed values using a Vmax/Vinfall = 0.65 threshold. This corresponds to the satellite having lost roughly 70 per cent of its infall mass, which is perhaps reasonable. At a fixed Vmax/Vinfall, however, this model has trouble reproducing the observed quenched fractions in detail from |$0.5\text{--}1$| Mpc compared to the fixed infall time model shown in Fig. 4.
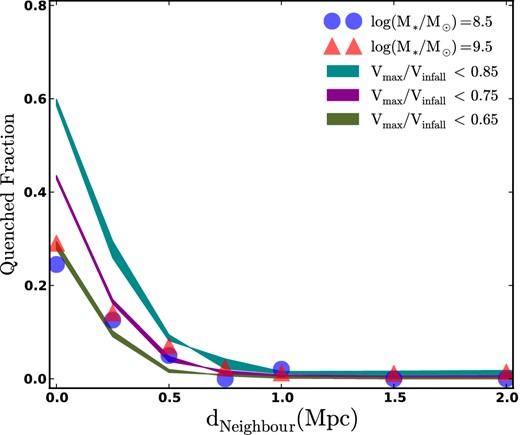
The relationship between quenching and mass-loss. Coloured bands show the predicted quenched fraction in a model where satellites become quenched when their subhaloes have been stripped of mass beyond a certain level: Vmax/Vinfall <0.85 (cyan), <0.75 (magenta) and <0.65 (green). The data are marginally well described by a quenching scenario with Vmax/Vinfall = 0.65 as the critical scale for star formation cessation. The thickness of the bands correspond to different ranges of Vmax used to identify dwarf haloes, as discussed in Section 3.
5 SUMMARY
We have used mock observations of the MS-II simulation (Boylan-Kolchin et al. 2009) in order to interpret dwarf galaxy ( M⋆ ≃ 109 M⊙) quenching as a function of projected distance to a more luminous neighbour as observed by G12. Dwarfs of this mass are particularly useful as a test bed for environmental quenching because, as shown by G12, they are never (or almost never) quenched in isolation.
We show that while dwarfs within 250 kpc and 1000 km s−1 of a luminous neighbour are subhaloes of a larger host approximately 90 per cent of the time, only about 25–30 per cent of such dwarfs are quenched (suggesting that ∼30 per cent of subhaloes are quenched at these masses). The implication is that whatever is giving rise to subhalo quenching, the process must be fairly inefficient, at least when evaluated relative to the subhalo population as a whole.
We investigate a model in which dwarfs become quenched only after a time τinfall of being accreted into a larger host. The required quenching time-scale is quite long, 9.5 Gyr (cf. Fig. 4), compared to some estimates in the literature (see Section 6). Alternatively, if dwarf quenching is instead related to the tidal forces experienced by the subhalo, then a simple model in which dwarfs with Vmax/Vinfall < 0.65 become quenched does a reasonable job in reproducing the observed quenched fraction in the innermost bin of G12 (see Fig. 5), though in detail the infall time model provides a better match overall (Fig. 4). If, instead, we try to explain the relatively low quenched fraction for subhaloes by demanding that only hosts larger than a critical Vmax are able to quench their satellites, we find that a threshold Vmax of 650 km s−1 is required. This value is unreasonably high, as it is well above that of isolated galaxy size hosts that are known to quench at least some of their satellites (Monachesi et al. 2011; More et al. 2011; Tollerud et al. 2011; Phillips et al. 2014).
Quenching is likely a complicated process that depends on more than a single parameter. Our aim in this work is to focus on simple models in order to gain qualitative insight, though we also explore slightly more complicated cases in which two conditions must be met before quenching occurs. Combining a minimum host Vmax with a maximum ratio of satellite Vmax/Vinfall does not significantly change the required values for either parameter. A minimum host Vmax of 350 km s−1 only moves the best-fitting threshold ratio to Vmax/Vinfall = 0.70, which is not significantly larger than the required one-parameter model value of 0.65. We also investigate a model that requires both a minimum host Vmax as well as a minimum τinfall for a satellite to become quenched. However, even requiring the relatively high host Vmax lower limit of 350 km s−1 does not reduce the required infall time significantly. We estimate that these joint criteria for quenching will lead to a reduced threshold quenching time-scale of ∼ 7.5 Gyr. Finally, combining Vmax/Vinfall and τinfall does not significantly change the required values for either parameter. This is due to the large amount of overlap between subhaloes that have lost a certain fraction of their Vinfall and those that have been orbiting within the virial radius of their hosts for a minimum amount of time.
6 DISCUSSION
Applying a semi-analytic scheme that models the evolution of central and satellite galaxies separately, while determining the quenching time-scales for each by matching the observed quenched fractions in the SDSS, Wetzel et al. (2013) conclude that infall time is the main determinant with regard to satellite quenching. Wetzel et al. (2013, hereafter W13) focus on satellite galaxies that are more massive than the dwarfs considered in this work. Their sample has a minimum satellite mass of M⋆ ∼ 5 × 10⁹ M⊙, compared to M⋆ ∼ 3 × 10⁹ M⊙ as the mid-point of the most massive stellar mass bin we consider for our dwarfs. W13 find that satellite galaxies experience ‘delayed-then-rapid’ quenching, becoming quenched rapidly (within an e-folding time of 0.8 Gyr) only after having orbited their hosts for ∼2–4 Gyr (see also McGee et al. 2009, 2011). This translates into an overall quenching time-scale of ∼3–5 Gyr, a value much less than the 9.5 Gyr determined in this work.
The 3–5 Gyr quenching time-scale adopted by W13 is roughly comparable to one of our models, in which we assume a required infall time of 4 Gyr before quenching; this is illustrated by the cyan band in Fig. 4. However, this model yields a quenched fraction within 250 kpc of a ‘luminous neighbour’ that is nearly quadruple that observed by G12. Furthermore, W13 count τinfall as the time since the satellite first fell into any host dark matter halo, while we use the time since the satellite most recently became a subhalo of any host. This difference in the definition of infall time dictates that our infall times will always be shorter than those inferred by W13 and thereby only serves to make the contrast between their results and our work more stark.
However, it is important to emphasize the different mass ranges investigated by W13 and our work. It is possible that invoking a simple (satellite) mass dependence in the quenching time-scale could serve to largely eliminate the discrepancy between the two results. According to fig. 8 of W13, the quenching time-scale becomes longer for less massive satellites. Their inferred quenching time-scale nearly triples for satellites in their lower mass range, reaching ∼ 6 Gyr for satellites with M⋆ ∼ 5 × 10⁹ M⊙ compared to ∼ 2 Gyr for satellites with M⋆ ∼ 1011 M⊙.
Quenching time-scales found by De Lucia et al. (2012, hereafter D12) also suggest a dependence of the quenching time-scale on satellite mass. Using methods very similar to our own, they investigate mock observations of quenched fractions by testing simple models for quenching and comparing to observation. D12 find a quenching time-scale of |$5\text{--}7\,\rm \, Gyr$| for satellite galaxies in a sample with stellar mass 109 < M⋆/ M⊙ < 1011. This mass range overlaps with ours slightly, which makes it unsurprising that they determine a time-scale that is more similar to ours and to that determined by W13 for their lowest satellite stellar mass bin. However, D12 use yet another definition for infall time: the time since a satellite first fell into its current host (we use the time it last became a subhalo of anything). By definition, the time-scale employed by D12 will always be less than or equal to the time-scale employed by W13, but could be shorter or longer than ours depending on the merger history of the satellite in question. For example, if a galaxy becomes a satellite of a host, and then that host itself is accreted on to a larger system, the time-scale would be longer according to our definition than that of D12.
In the context of a model where infall time is the determining factor in satellite quenching, there appears to be a qualitatively consistent trend in the literature that lower mass satellites require longer time-scales for quenching. This result begs the question: how is it that the smallest galaxies, which are presumably the most fragile, require the longest periods of time to become quenched? We speculate that this can only work in a ‘slow starvation’ scenario, whereby gas-rich yet inefficiently star-forming dwarfs continue to form stars for a long time after their supply of fresh or recycled gas is shut off. This possibility is consistent with the well-known fact that dwarfs have much higher gas fractions (and longer star formation time-scales) than more massive galaxies (Hunter & Gallagher 1985; van Zee 2001; Geha et al. 2006; Weisz et al. 2011). If we consider the possibility that the quenching time-scale is related to the gas depletion time-scale, this would imply that this time-scale should also increase with decreasing stellar mass.
Observationally, however, the mass dependence of the gas depletion time-scale remains fairly cloudy, especially for low-mass systems. Based on measurements of atomic hydrogen in local star-forming galaxies, gas depletion time-scales are generally found to increase with decreasing stellar mass (Skillman, Côté & Miller 2003; Schiminovich et al. 2010). More recent studies, however, show that star formation is a direct product of the molecular gas in a galaxy, not of all gas. In particular, on sub-kpc scales, current star formation is found to correlate strongly with molecular gas and poorly with atomic gas (Wong & Blitz 2002; Kennicutt et al. 2007; Bigiel et al. 2008; Leroy et al. 2008). Moreover, recent measurements of CO emission in nearby galaxies find that the molecular gas depletion time-scales are constant, or possibly even decreasing in lower stellar mass systems (Leroy et al. 2008; Genzel et al. 2010; Bigiel et al. 2011; Saintonge et al. 2011; Boselli et al. 2014). For systems with stellar mass less than 109 M⊙, however, the constraints are generally weak due to the difficulty of detecting CO emission in low-mass systems – a limitation that will hopefully soon be overcome for larger samples using more sensitive facilities such as Atacama Large Millimetre/submillimetre Array (ALMA).
Regardless of the underlying cause, our results indicate that dwarf satellites in the |$\, M_{\star }\sim 10^{8.5\text{--}9.5} \rm \, M_{{\odot }}$| mass range are quenched only ∼25–30 per cent of the time. However, for more massive satellites there is quenching in the field, and so the quenched fraction is not the same as the fraction of satellites that are quenched because they are satellites. Thus, a proper comparison of environmental quenching over different stellar mass regimes is best made by comparing only the ‘environmentally quenched fraction’. This is the fraction of satellites that are quenched but would have otherwise not be quenched in the field, and so is equivalent to the overall quenched fraction for low-mass galaxies. Our ‘environmentally quenched fraction’ is largely equivalent to the ‘transition fraction’, |$f_{\text{tr}|\text{s},\text{bc}}$|, first introduced by van den Bosch et al. (2008), as well as to the ‘conversion fraction’, fconvert, of Phillips et al. (2014) and the ‘excess red fraction’, |$f^{\rm Q}_{\rm excess}$|, of W13, the latter two of which are plotted in Fig. 6 alongside our quenched fraction. As Fig. 6 shows, over the stellar mass range 108–1011 M⊙, the environmentally quenched fraction is almost completely independent of stellar mass. The yellow triangles show results from W13, for which satellite galaxies reside typically in clusters. The green points are taken from our G12 sample, and include only systems with dNeighbour < 250 kpc, which again typically reside in small clusters (Fig. 3, and we have taken into account the fact that only ∼90 per cent of the galaxies in this bin are true subhaloes, Fig. 1). The Phillips et al. (2014) point (blue square) is somewhat different in that these galaxies were chosen to reside within Milky Way size hosts rather than clusters. This may explain the slightly lower environmentally quenched fraction. The results displayed here are consistent with other results suggesting that quenching efficiency is independent of stellar mass (van den Bosch et al. 2008; Peng et al. 2010; Tinker et al. 2013).
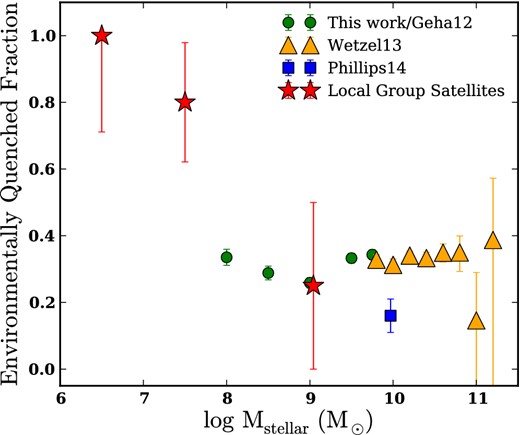
The environmentally quenched fraction – the fraction of satellites that are quenched in excess of that expected in the field, i.e. the fraction of satellites that are quenched because they are satellites. We see that while environmental quenching seems to have an approximately constant efficiency of ∼30 per cent at stellar masses from 108 to 1011 M⊙, there appears to be a dramatic upturn in quenching at lower stellar masses (if the Local Group is typical).
Although the statistics for satellites in the stellar mass range M⋆ ∼ 108.5 − 9.5 M⊙ within the Local Group are very low, it is interesting that the quenched fraction for these dwarfs is not too far from ∼25 to 30 per cent. Within this mass range, the LMC, the Small Magellanic Cloud and M33 are star forming while NGC 205 and M32 are quenched. Once we adjust the quenched fraction to the environmentally quenched fraction by accounting for the fraction of quenched galaxies at this mass in the field, the fraction of high-mass satellites of the Milky Way and M31 that have been quenched as satellites is broadly consistent with the results of this work. This can be seen in Fig. 6, where the high-mass Local Group satellites have been represented by a red star placed at the mean of their stellar mass values.
This consistency of the environmentally quenched fraction over so many orders of magnitude is particularly puzzling in light of the known (very high) quenched fraction of dwarf satellites in the Local Group in the mass range just below M⋆ ≃ 108 M⊙ (Mateo 1998; McConnachie 2012). The low-mass Local Group points in Fig. 6 (red stars) show a marked increase in the environmentally quenched fraction just below 108 M⊙. Furthermore, observations of the nearby group M81 show that almost all of the low-mass satellites of that group are also quenched (Kaisin & Karachentsev 2013; Karachentsev et al. 2014). Recall that at these low stellar masses, the overall quenched fraction is equivalent to the environmentally quenched fraction, since nearly all isolated systems are star forming. Of course, most of the quenched dwarf satellites in the Local Volume are of significantly lower stellar mass than those in G12 sample, but if stellar mass is the determining factor, it requires a reversal of sorts: rather than continuing the trend of longer quenching time-scales for lower mass galaxies as discussed above, the high quenched fraction of low-mass dwarfs in the Local Group suggests a sudden uptick in quenching efficiency below M⋆ ∼ 108 M⊙ (see Phillips et al., in preparation for more on this). It is possible that we are seeing a second physical process for quenching emerging in the low-mass dwarf regime: ram-pressure stripping, which should act more efficiently on systems with shallow potential wells, might well be at work. Future observations that probe this lower stellar mass regime with greater statistical samples will be required to determine whether the physics of satellite quenching transitions at the dwarf spheroidal mass scale from processes that act inefficiently to those that squelch star formation almost uniformly.
We thank Marla Geha, Andrew Wetzel and their collaborators for kindly supplying their observational results in tabular form, as well as for productive discussions. CW in particular thanks Shea Garrison-Kimmel for technical support. CW and JSB were supported by NSF grants AST-1009973 and AST-1009999. We also thank Frank van den Bosch for his suggested edits as the referee, which made the paper much clearer.
We emphasize that the halo mass shown is that of the true host halo identified in the simulations, which is not necessarily that associated with the ‘luminous neighbour’ identified in the mock G12 observations.
