


Abstract
Stephan's Quintet (SQ) is a famous interacting compact group of galaxies in an important stage of dynamical evolution, but surprisingly very few spectroscopic studies are found in the literature. We present optical integral field spectroscopy (IFS) observations of the SQ from the PPAK IFS Nearby Galaxies Survey, that provide a powerful way of studying with spatial resolution the physical characteristics of the ionized gas within the group. The nature of the gas emission is analysed using 2D maps of continuum-subtracted, pure emission-line intensities, stacked spectra, diagnostic diagrams, and photoionization model predictions. In the case of NGC 7319, we study the galaxy-wide high-velocity outflow emission by comparing the emission properties with theoretical shock and AGN models. We conclude that the excitation mechanism of the gas in this galaxy is a mixture of AGN photoionization and shocks with a photoionizing precursor. The emission spectra from the large-scale shock front in the interacting pair NGC 7318A/B is analysed, confirming the presence of several kinematic components. Comparison with predictions from theoretical shock models suggests that the gas emission is consistent with shocks without a photoionizing precursor, low pre-shock density, and velocities in the range of ∼200–400 km s−1. The gas oxygen abundance for NGC 7318B is determined using an updated O3N2 calibration. Although NGC 7317 shows no significant gas emission, an ionizing cluster is found southwest of this galaxy, probably the result of tidal interaction. As a by-product, we analyse the gas emission of the foreground galaxy NGC 7320.
1 INTRODUCTION
Compact galaxy groups at low redshift are ideal laboratories for studying the effects of extreme galaxy interactions, which are believed to be very important in driving galaxy evolution at high redshift. One of the best examples is Stephan's Quintet (hereafter SQ), a strongly interacting compact group of six galaxies (see Fig. 1) that has been the subject of many studies since it was discovered in 1877 by M. E. Stephan. It is an ideal candidate for detailed analysis, as it is bright and is in a rare but important stage of dynamical evolution that allows us to observe manifestations of both past and present interaction events.
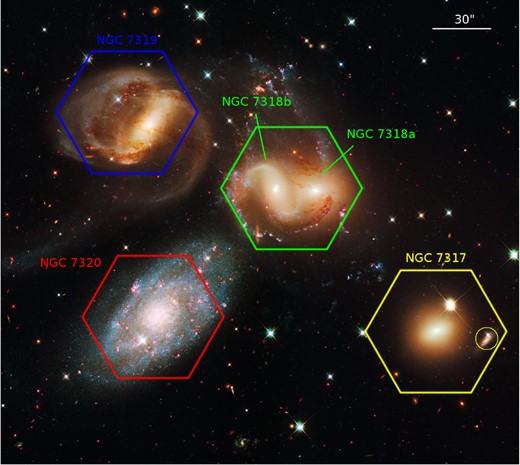
HST image of SQ, in standard astronomical orientation (north up, east left). Overlaid there are shown the four hexagonal pointings of this project: blue for NGC 7319, red for NGC 7320, green for NGC 7318A/B and yellow for NGC 7317. The yellow circle in NGC 7317 pointing indicates the region discussed in Section 3.4. Credit: NASA; ESA and the Hubble SM4 ERO Team.
The SQ includes a core of three galaxies (NGC 7317, NGC 7318A, and NGC 7319) with essentially zero velocity dispersion that have previously undergone several episodes of interactions. These past events are probably due to the dynamical harassment of a fourth galaxy with accordant redshift, NGC 7320C, called the ‘old intruder’ in the dynamical scenario described by Moles, Sulentic & Marquez (1997). Both NGC 7317 and NGC 7318A are ellipticals, while NGC 7319 and NGC 7320C (which is not shown in Fig. 1) show spiral morphology but have lost almost all their interstellar medium (ISM) along successive processes of interaction within the group (Sulentic et al. 2001). Now the gas-rich spiral NGC 7318B, the ‘new intruder’, is apparently entering the group for the first time at high velocity (≈1000 km s−1), colliding with the intergalactic medium of the group (Sulentic et al. 2001; Xu et al. 2003). The sixth object, NGC 7320, presents a highly discordant redshift (Burbidge & Burbidge 1961) and is known to be a foreground dwarf spiral galaxy. Many prominent elements of the SQ morphology are consequence of the interaction history of the group, like the unrelaxed stellar halo comprising 30 per cent of the optical light (Moles, Marquez & Sulentic 1998) or the two tidal tails of different ages pointing to the old intruder NGC 7320C (Sulentic et al. 2001). But the most striking feature of the group is the galaxy-scale shock generated by the ongoing collision between NGC 7318B and the intragroup gas, which is the tidally stripped ISM from NGC 7319 and NGC 7320C during previous interactions. Along the last decade this shock ridge has been detected and studied in a wide range of wavelengths: from X-ray (Trinchieri et al. 2003, 2005) to radio through its synchrotron emission (Sulentic et al. 2001; Williams, Yun & Verdes-Montenegro 2002). Excitation diagnostics from optical (Xu et al. 2003) and mid-IR (Cluver et al. 2010) emission lines also confirm the presence of shocked gas, and Spitzer mid-IR observations reveal that the mid-IR spectrum in the shock structure is dominated by the rotational line emission of molecular hydrogen, H2 (Appleton et al. 2006; Cluver et al. 2010). Recent integral field spectroscopy (IFS; Iglesias-Páramo et al. 2012) of the ionized gas in this shock has revealed the presence of several kinematic components.
Despite being the most studied compact group, there are many questions about the Quintet that remain unsolved. Relatively few spectroscopic studies have been carried out, some of them dealing with the general properties of the group as its dynamical state (Moles et al. 1998) and others focusing on particular aspects (Aoki et al. 1996; Lisenfeld et al. 2004; Cluver et al. 2010; Trancho et al. 2012), but there is still much lacking information about the complex phenomena that define the past and future of these galaxies. IFS may imply a significant step further in this field, as it allows a complete mapping of the physical properties of the relevant regions of the group. Hitherto only Iglesias-Páramo et al. (2012) has presented IFS observations of the SQ, but they focused specifically on the shock region between NGC 7318B and the debris field. In this paper, we present for the first time 2D spectroscopic observations with a wide field of view (FoV) that completely include five of the six galaxies related to the SQ, as well as some of the intergalactic regions. This provides a powerful way of studying with spatial resolution the physical characteristics of the ionized gas both in the galaxies and in the intragroup material generated by the interactions. Based on a proven methodology which includes the use of complete maps of pure emission-line intensities, the analysis on extracted stacked spectra from specific regions of interest, and comparison with theoretical model predictions, we confirm and extend previous results about the nature of the outflows in the Seyfert 2 galaxy NGC 7319, the properties of the shock region associated with NGC 7318B, the discovery of current star formation in NGC 7317, and as a by-product, the internal structure of the foreground galaxy NGC 7320. This work is focused on the gas component of the SQ, but these observations also provide very interesting information about the stellar populations, whose study will be performed elsewhere. The paper is organized as follows: in Section 2, we describe the observations and data reduction. Section 3 presents the analysis performed on the IFS data and the main results obtained. The main conclusions are summarized in Section 4.
2 OBSERVATIONS AND DATA REDUCTION
The SQ observations are part of the PPAK IFS Nearby Galaxy Survey (PINGS; Rosales-Ortega et al. 2010), a project designed to construct 2D spectroscopic mosaics of a representative sample of nearby spiral galaxies. PINGS observations were carried out at the 3.5 m telescope of the Centro Astronómico Hispano Alemán (CAHA) at Calar Alto with the Postdam Multi Aperture Spectrograph (PMAS; Roth et al. 2005) in the PPAK mode (Verheijen et al. 2004; Kelz & Roth 2006; Kelz et al. 2006), i.e. a retrofitted bare fibre bundle IFU which expands the FoV of PMAS to a hexagonal area with a footprint of 74×65 arcsec2. The PPAK unit contains 331 densely packed optical fibres to sample an astronomical object at 2.7 arcsec per fibre, with a filling factor of 65 per cent due to gaps in between the fibres. The sky background is sampled by 36 additional fibres distributed in six mini-IFU bundles of six fibres each. Additionally, 15 fibres can be illuminated directly by internal lamps to calibrate the instrument. During the observations the V300 grating was used, covering a wavelength between 3700 and 7100 Å with a resolution of 10 Å full width at half-maximum (FWHM), corresponding to 600 km s−1 for [O iii] λ5007 and 460 km s−1 for Hα. The exposure times per field for PINGS non-dithered frames, including also the SQ observations, were 3 × 600 s. More details about PINGS observations are available in Rosales-Ortega et al. (2010). In the case of SQ, four individual pointings were observed on the photometric night of 2008 August 10, three of which were centred at the bright bulges of NGC 7317, NGC 7319, and NGC 7320, while the last pointing was centred to cover NGC 7318A and NGC 7318B. The seeing was always smaller than 1.3 arcsec, never comparable to the fibre size. The FoV of the PPAK instrument is shown in Fig. 1 as hexagons overlaid on the Hubble Space Telescope (HST) image, labelled according to the galaxy or galaxies they cover. The whole data set comprises 1324 fibre spectra.
The pre-reduction processing was performed using standard iraf1 packages, while the main reduction was performed using the r3d software for fibre-fed and IFS data (Sánchez 2006) in combination with the E3D visualization software (Sánchez 2004). After that, the fibre-based IFS data were spatially resampled to a data cube with a regular grid of 2 arcsec spaxel−1, adopting a flux-conserving, natural-neighbour, non-linear interpolation, following the scheme described in Sánchez et al. (2012), developed for the CALIFA survey. Astrometric corrections were applied to the final data cube, and foreground objects (stars) were eliminated from the FoV of the pointings. Then, following the procedure outlined in Rosales-Ortega et al. (2010) and Sánchez et al. (2011), the fit3d software (Sánchez et al. 2007) was used to fit the underlying stellar population of each spaxel spectrum by a linear combination of single stellar population templates from the MILES library (Vazdekis et al. 2010) covering a wide range of ages (0.09, 1.00, and 17.78 Gyr) and metallicities (Z ∼ 0.0004, 0.03). Once the stellar continuum is subtracted, a pure-emission spectrum is obtained. Based on this residual spectrum, the intensity of the emission lines is calculated in each spaxel by fitting one or multiple Gaussian profiles to the most prominent emission lines in the considered wavelength range, including: Hα, Hβ, Hγ, [O ii] λ3727, [O iii] λλ4959,5007, [N ii] λλ6548,6583, and [S ii] λλ6717,6731, and also for the most prominent sky residuals present in the spectrum, i.e. [O i] λ5577, and Na i λ5893 lines (see Sánchez et al. 2011, for more details).
3 2D SPECTROSCOPIC ANALYSIS OF SQ
3.1 Emission-line ratio maps
The measurement of the line intensities for every spaxel provides images of the spatial distribution of all the strong emission-line species included in the wide wavelength range of our observations. We applied a flux threshold in order to avoid regions dominated by low S/N data. For this purpose, we produced masks considering two criteria. First, we empirically determined for each pointing the value of the Hα flux below which the spaxels are clearly not associated with the galactic structure and can be associated with the background, and eliminated these spaxels. We did the same for the Hβ map. Secondly, we discarded those regions that were not consistent with the expected theoretical value of the Hα/Hβ ratio (2.87 following Osterbrock & Ferland 2006, within the systematic errors in the measurement of Balmer lines). With this masking process we reproduced the galactic structure as seen in the HST image (see Fig. 1) and we made sure that we were considering regions that are physically meaningful.
This procedure was applied to all the pointings except NGC 7317, which showed no gas emission except for a region outside the galaxy that will be discussed in Section 3.4. For the other three pointings, we used the masked images of the emission lines to represent maps of key line ratios sensitive to ionization state, focusing on ratios of lines that are close enough in wavelength not to be strongly affected by dust attenuation. The species which are presented as the ratio with respect to Hα were masked with the corresponding Hα mask, while species presented as the ratio with respect to Hβ were masked with the corresponding Hβ mask. Some examples of the final maps are shown in Fig. 2, together with V-band contours of the corresponding galaxy or galaxies obtained with pingsoft (Rosales-Ortega 2011) after applying a V filter to the data, for comparison between the shape of the galaxy in the continuum light and the gas distribution. The maps show the galactic structures and highlight a wide range of phenomena according to each context, like the AGN with shock emission in NGC 7319, the shock front in NGC 7318A/B or the H ii regions distribution in NGC 7320, that will be further discussed in the following sections.
![Examples of emission-line ratio maps derived from the IFS cubes of NGC 7319, NGC 7318A/B and NGC 7320. Left-hand column: [O iii] λ5007/Hβ maps. Right-hand column: [N ii] λ6584/Hα. Maps are displayed with a standard orientation north-east positive.](https://oup.silverchair-cdn.com/oup/backfile/Content_public/Journal/mnras/442/1/10.1093_mnras_stu851/1/m_stu851fig2.jpeg?Expires=1749839150&Signature=lHWWjkE~tR5PIkE-Ln-KZvNoVooYNBtQOhSUwFKG2tRcYvCSUEn9hsGk9HKAARv9D7lL4sK4Su9gllQLBSweju-MrwwE81HbCHxYI9yiV~kUGJGfzlEekrbAQfO1gnNQ5B-KaPQCUCkYZvYKW5gSTqXr5lBoHOqPc5Srsk~mUHQhDrDk5wkxlKBXhTtK1c01se8~BX5XKSH3ewuEpJCFefIZlim0~IkGyjBEtrKfi4YYPjqXqJF4t0cIana9NDB7bBDOPShPxdLJ1IkiDJo-xkDbeFL1IocjjuE3m1kB9327~1XDk3f31bxr3v4MTSQLGgke9GMZw0R-O-AKgClokA__&Key-Pair-Id=APKAIE5G5CRDK6RD3PGA)
Examples of emission-line ratio maps derived from the IFS cubes of NGC 7319, NGC 7318A/B and NGC 7320. Left-hand column: [O iii] λ5007/Hβ maps. Right-hand column: [N ii] λ6584/Hα. Maps are displayed with a standard orientation north-east positive.
The AV extinction maps of NGC 7318 and NGC 7319, included in Fig. 3, are derived from the Balmer decrement of each spaxel spectrum, according to the reddening function of Cardelli et al. (1989), assuming R ≡ AV/E(B − V) = 3.1. Theoretical value for the intrinsic line ratio Hα/Hβ was taken from Osterbrock & Ferland (2006), assuming case B recombination (optically thick in all the Lyman lines), an electron density of |$n_{\text{e}}$| = 100 cm−3 and an electron temperature |$T_{\text{e}}$| = 104 K. In the case of NGC 7319, we detect an extinction of |${\sim }0.5\text{--}1$| mag in the nucleus and in the major part of the galaxy, consistent with dust produced by intense star formation in these regions. We notice that the higher extinction is found at the edges of the emission region, probably tracing dust accumulated by the gas expansion, although we should take into account that the extinction calculated in those regions may be conditioned both by the weak Hβ emission and the limitations in the fitting of the stellar population models that might not correctly reproduce the Hβ profiles in absorption. In the case of NGC 7318 extinction map, we find a relatively low extinction with average values between 0.15–0.25 mag, in a very inhomogeneous distribution, consistent with the mixing and turbulence expected in the shocked region.
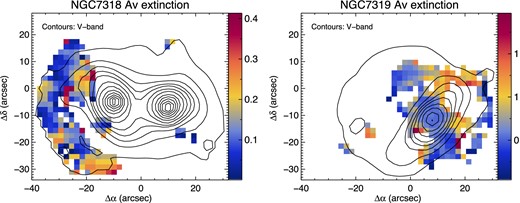
Left: AV extinction map of NGC 7318A/B, obtained from the Balmer decrement (Hα/Hβ) using the reddening function of Cardelli, Clayton & Mathis (1989). Right: AV extinction map of NGC 7319, obtained as indicated for NGC 7318A/B.
3.2 The Seyfert 2 galaxy NGC 7319
This galaxy has played a main role in all the interaction episodes within the group, losing most of its gas as a consequence. These interactions may be responsible for the activity of its nucleus, classified as Seyfert 2 (Véron-Cetty & Véron 2006). A powerful way to probe the nature of the dominant ionizing source in galaxies are the emission-line diagnostic diagrams (introduced by Baldwin, Phillips & Terlevich 1981, hereafter BPT). They work by exploring the location of certain line ratios, involving several strong emission lines with a dependence on the ionization degree and, to a lesser extent, on temperature or abundance. Through the application of different classification criteria (Kewley et al. 2001, 2006; Kauffmann et al. 2003; Stasińska et al. 2006; Schawinski et al. 2007) diagnostic diagrams allow the separation of galaxies into those dominated by ongoing star formation and the ones dominated by non-stellar processes, and with sufficient information can further split the latter into Seyfert AGN and LINERs. Some of the diagrams also contain a transition region, where the classification method indicates a blend of star formation and AGN activity.
The spatial resolution of the emission-line maps obtained from the IFS observations of the SQ has allowed us to elaborate diagnostic diagrams with the particular positions of every spaxel, instead of studying the integrated emission of each galaxy as a whole. The classification of each spaxel according to its position in the diagnostic diagrams provides information to study the distribution of the different ionizing sources across the galaxy. In the case of NGC 7319, the diagnostic diagrams highlight the coexistence of several processes, like the AGN emission from the NGC 7319 nucleus and the shocked gas emission as a consequence of the outflow from the nucleus (see Fig. 4). The integrated spectrum of the nuclear region was extracted using pingsoft, by co-adding the spectra of the spaxels corresponding to that zone in the data cube. In order to obtain the pure-emission spectrum we applied the fit3d software to the extracted spectrum, to fit and subtract the underlying stellar continuum, as explained in Section 2. In Fig. 5, we plot examples of stacked spectra from several key regions of the galaxy, corresponding to different physical scenarios that will be discussed along this section. The spectrum of the nucleus, included in Fig. 5, confirms the classification of this galaxy as Seyfert 2.
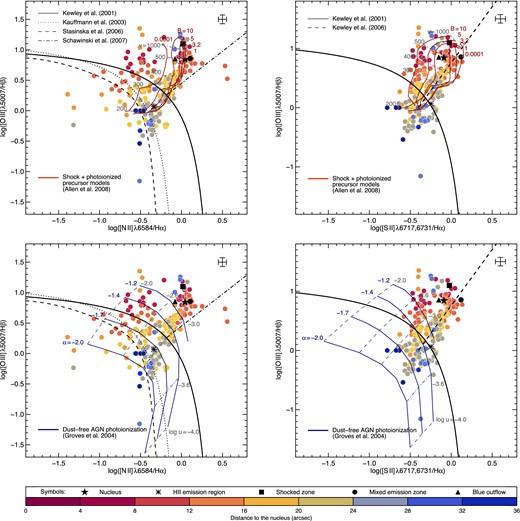
Line ratio diagnostic diagrams, showing line ratios for independent spaxels in NGC 7319. Line ratios in the key regions of interest (see Fig. 5) are plotted with black symbols, as indicated. Overplotted as black lines are empirically and theoretically derived separations between LINERs/Seyfert and H ii regions. Overplotted as coloured lines are line ratios predicted for photoionization of gas by a fast shock with precursor from Allen et al. (2008) and by AGN without dust from Groves, Dopita & Sutherland (2004), as described in the text.
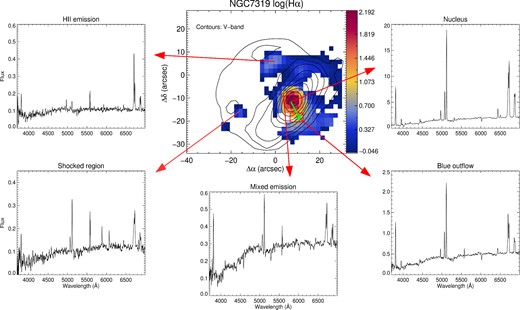
Stacked spectra, obtained with pingsoft, from several key regions of NGC 7319. The red box shows the spaxels where the blueshift in Hα is resolved. The green arrow shows the trajectory along which the evolution of the Hα line profile is studied in Fig. 6. Fluxes are expressed in units of 10−16 erg s−1 cm−2. (The prominent feature observed in some spectra at ∼5500 Å is the O i λ5577 sky emission line, the most visible at Calar Alto.)
Aoki et al. (1996, hereafter A96) reported the presence of a high-velocity outflow, that was later the objective of a first attempt of study with IFS techniques by Boschetti et al. (2003) and Di Mille et al. (2008). Using long-slit optical spectroscopic observations, A96 found that the gas in the south-west region relative to the nucleus is blueshifted from the systemic velocity by 300 km s−1 on average, and 500 km s−1 at maximum. After discarding galactic rotation and tidal effects as possible causes, it was finally concluded that this blueshift is generated by an outflow that may have a red counterpart in the north-east region, although this could not be observed with their data. The PPAK V300 PINGS observations’ spectral resolution (see Section 2) does not allow us to study the average velocity variations described by A96. This is not a surprising fact, as the observations were not intended to perform a kinematic analysis, but to cover a wide range in wavelength. Nevertheless we do detect some spaxels with blueshifted values of the order of 500 km s−1 in Hα, located in a region of |$6\,\text{arcsec} \times 4\,\text{arcsec}$| in the south-west at about |$5\,\text{arcsec}$| from the nucleus that is signalled with a red box in Fig. 5. The variation of the Hα line profile from the nucleus to this south-west region along the green arrow included in the central map of Fig. 5 is represented in Fig. 6. This is in very good agreement with the maximum blueshift reported by A96. Observations with higher spectral resolution would be necessary to construct a complete radial velocity map and to study the possible presence of a red outflow located north-east from the nucleus. Comparison with observations in other wavelength ranges would also be advisable. A simple comparison between our maps and those obtained by Xanthopoulos et al. (2004) reveals similarities between the emission structures observed in visible and radio ranges, leading to concordant conclusions about the presence of jets and shock fronts around the nucleus of the galaxy.
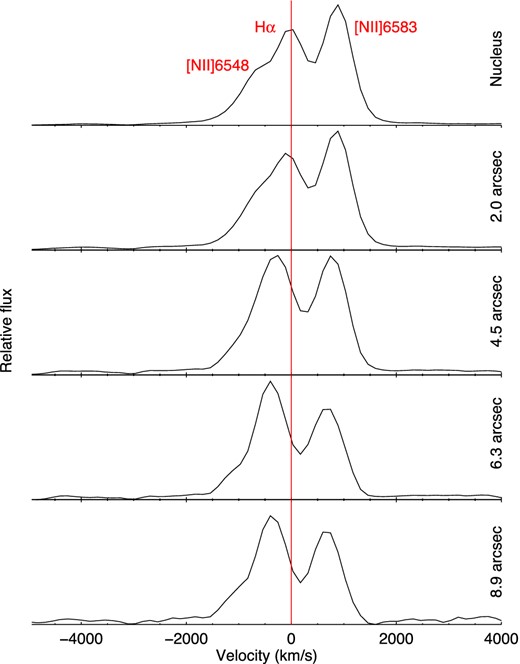
Variations of the Hα profile along the green arrow drawn in Fig. 5, from the galactic nucleus to the outflow region with velocities of the order of 500 km s−1. Each spectrum corresponds to the extraction of the emission of one spaxel. Distances to the nucleus are indicated on the right.
However, the outflow effects that we are not able to fully detect in the velocity field are instead much more visible in the study of the measured emission-line ratios. We observe features in the maps that would correspond to shocks caused by the outflowing material coming from the nucleus. In the optical range, shock-ionized regions can be distinguished from photoionized gas (H ii regions) through their strong lines from low excitation species, such as [O i] λ6300, [O ii] λ3727, [N ii] λλ6548,83, and [S ii] λλ6717,31 relative to Hβ. Temperature sensitive ratios (e.g. [O iii] λ5007/Hβ) are also good indicators of shock activity since shocked gas can readily attain high temperatures. These two facts together place these shocked regions in the LINER/Seyfert location in diagnostic diagrams. In general, LINER-like emission-line ratios are observed in the case of shocks, and if the shock is travelling quickly enough, a photoionized precursor can increase the ionization state of the gas even further, leading to Seyfert-like line ratios (Dopita & Sutherland 1996; Allen et al. 2008). Fig. 7 shows a galaxy map classifying the spaxels according to their position in the [O iii] λ5007/Hβ versus [N ii] λ6584/Hα BPT diagram (see Fig. 4, left-hand panels). Spaxels placed above and to the right from the parametrization line by Kewley et al. (2001), and therefore classified as AGN (both Seyfert and LINER), are coloured in red. Spaxels below the parametrization line by Stasińska et al. (2006), classified as starburst, are coloured in blue. Spaxels located between these two lines, classified as composite, are coloured in green. This composite classification has no physical meaning for individual H ii regions, but has a high interest in cases that are supposed to respond to a mixture of the two possible emission mechanisms (often associated with shocks). The central region appears coloured in red, as expected, and the green zones, i.e. the ones representing composite spaxels, delimit a circle surrounding the AGN-like emission region. Only a few spaxels are coloured in blue, in accordance with the absence of gas associated with pure star-forming regions. This scenario corresponds precisely to the hypothesis of shocks generated by the outflowing material from the nucleus. Using the information provided by the diagnostic diagrams and applying shock and AGN theoretical models (Groves et al. 2004; Allen et al. 2008), we attempted to determine the main characteristics of these shocks.
![NGC 7319 spatial map with the spaxels classified according to their position in the [O iii] λ5007/Hβ versus [N ii] λ6584/Hα diagram. Spaxels classified as AGN are displayed in red, spaxels classified as starburst are displayed in blue, and spaxels classified as composite are displayed in green.](https://oup.silverchair-cdn.com/oup/backfile/Content_public/Journal/mnras/442/1/10.1093_mnras_stu851/1/m_stu851fig7.jpeg?Expires=1749839150&Signature=OD7kIt7lscM4Tplkv-006IE2R7nw1leZvCvn0-NQ-NUfFU-w1fpmkt95Irjh4p--VUy1-T2c7LbhFBi43bQGnp2T2fZfA7MP0NImvQ4dPN7Ih3SZ0QjIKyYGM5EnELjGon-0SgkDIBAacCRrLY4Y7jm0lsvJujXK0mdVvhH1XemMw2V1lAdreLkghJ6hjEDlB5qNYicEy3mzzzRPtWcFD68RJJtnw5EWVf~1clAugCSQUQ0TLLMVyFepKs28CJ~LrfWNvDGHV-QpSJqm44KIZCpc0llvZizXdsDsJ8g0mVZSbuPj-wycj0~fhljt4HzH97f9Kxt-fyy40QA5MM0EJw__&Key-Pair-Id=APKAIE5G5CRDK6RD3PGA)
NGC 7319 spatial map with the spaxels classified according to their position in the [O iii] λ5007/Hβ versus [N ii] λ6584/Hα diagram. Spaxels classified as AGN are displayed in red, spaxels classified as starburst are displayed in blue, and spaxels classified as composite are displayed in green.
According to the treatment of interstellar shocks, assuming a frame of reference that is comoving with a driving shock into the surrounding medium, in the thin shock front the kinetic energy of the gas is converted into thermal energy through elastic collisions (Draine & McKee 1993; Tielens 2005). In the post-shock relaxation layer, this energy will cause ionization processes. As shocks are supersonic with respect to the gas upstream and subsonic relative to the gas behind, shock waves cannot travel ahead of the shock, but the shock may be preceded by a radiative precursor, affecting the pre-shock gas. In high-velocity shocks (vs > 50 km s−1), this effect will lead to photoionization. The recombination photons, i.e. extreme UV and soft X-ray photons which are generated by the cooling of hot gas behind the shock front, may travel upstream and pre-ionize the pre-shock gas.
The emission spectrum of radiative shocks depends upon the shock velocity and the physical conditions in the pre-shock material. The observed line intensities and widths in the outflow of NGC 7319 are consistent with the spectra of radiative shocks with velocity vs > ∼ 100 km s−1 (Draine & McKee 1993). Typically, the shock velocity (vs) can be diagnosed using Hα, [O i] λ6300, [O ii] λ3727, and [O iii] λ5007 based on the emission-line velocity dispersion σ and/or the FWHM. Nevertheless, as it was previously discussed, we do not have enough spectral resolution to determine the velocity dispersion of the gas or to resolve any line splitting in the data. Therefore, since the scenario proposed by A96 seems consistent with our observations, we use the velocity range obtained by A96 (300–500 km s−1) as a first approach to the shock velocity in order to estimate the parameters of the theoretical models that will be compared with our data.
We have overplotted on the diagnostic diagrams the predictions from the fast-shock models with precursor photoionization of Allen et al. (2008). Shock models are generated using solar metallicity and a pre-shock density of 1 cm−3, in agreement with the density value derived above, and are represented for a range of shock-velocities (vs) and magnetic field strengths (B). Similarly, we have also overplotted on the diagnostic diagrams the predictions from the dust-free AGN models of Groves et al. (2004). AGN models are generated using metallicity double than solar, as most of the narrow-line regions in Seyfert galaxies are characterized by supersolar metallicity, with a mean value of ∼2 Z⊙ (Groves et al. 2004), and an electronic density value of 100 cm−3, similar to the one derived from the [S ii] λλ6717/6731 ratio in the nucleus. AGN models are represented for a range of the dimensionless ionization parameter (u) and the spectral index (α). Both shock and AGN models were obtained using ITERA (IDL Tool for Emission-line Ratio Analysis; Groves & Allen 2010).
Regarding shock theoretical predictions, the shock plus precursor models follow the track of the spaxels with an excellent agreement for the velocity range of ∼200–1000 km s−1. On the other hand, the observed line ratios are inconsistent with the models that do not include the effect of the precursor. Two of these diagrams, along with the theoretical shock models, are presented in the top panels of Fig. 4. The wide range of shock velocities detected may indicate the presence of several kinematic components, but this fact could not be discarded nor confirmed with our data, which were not intended to perform a kinematic study of the system. With respect to the AGN models, we first derive observational values of the ionization parameter u from the [O ii]/[O iii]ratio for several regions of the galaxy, following Díaz et al. (2000) and obtaining a range of log u values between −2.7 and −3.4. Taking these results into account, we observe that dust-free AGN models fit the spaxels positions with better agreement than dusty AGN models. Two of the diagrams, with AGN models overplotted, are presented in the bottom panels of Fig. 4.
The observed line ratios are thus consistent both with shock and AGN models, but neither of these possibilities can explain the observational results exclusively. Even the nucleus emission, classified as Seyfert 2, is not plainly consistent with AGN models, which may be caused by a partial contamination by shock emission that we observe projected on the nucleus. We reach the conclusion that the excitation mechanism of the gas in the galaxy is a mixture of AGN photoionization and shocks, and the resulting emission spectra are generated by the combination of both ionization mechanisms. Thus, while A96 scenario considered the AGN photoionization as the only responsible mechanism for exciting the gas, the spatial resolution and wide FoV of our data have allowed us to detect the presence of shocks as another source of ionization, and to study the coexistence of these two processes in the observed gas emission of the galaxy.
3.3 The galaxy interaction in NGC 7318A/B
The PPAK pointing corresponding to NGC 7318 includes two objects: NGC 7318A which belongs to the group core, and NGC 7318B which is entering the group for the first time and colliding with it. The shock front generated by this collision is one of the most interesting features of the SQ, but until recently studies had been restricted to the brightest regions. Iglesias-Páramo et al. (2012, hereafter IP12) analysed for the first time IFS observations of the shock region in order to get a complete mapping of physical and dynamical properties, with very interesting results about the different kinematical components of the gas. This region has also been spectroscopically studied in detail by Konstantopoulos et al. (2014). Our observations, obtained with the same spectrograph but in a different configuration, have a much wider FoV and wavelength range, although less spectral resolution. Thus, our results may confirm and complement those obtained by IP12, giving more information by providing us with the 2D distribution of the physical properties of the region.
Fig. 8 shows the Hα emission-line map with the stacked spectra of some of the key regions of the pointing. The three pointings from IP12 are overplotted for comparison. Gas emission is only detected in the shock front, and the spectra of both galactic nuclei show only stellar emission. In the southern region of our pointing two H ii regions are detected, coinciding with those mentioned by IP12 in their S pointing. Further north we observe the shocked gas emission, with an evident strong blending in Hα-[N ii] lines and in the [S ii] doublet. This is due to the presence of the two different kinematical components studied by IP12, although our data do not have enough spectral resolution to develop a similar kinematic analysis.
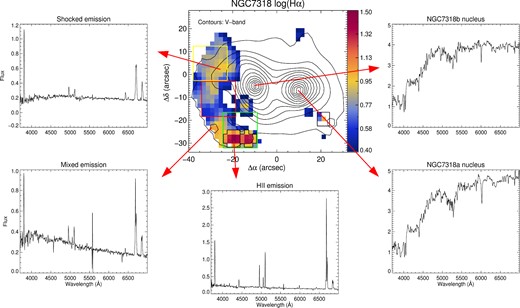
Stacked spectra, obtained with pingsoft, from several key regions of NGC 7318A/B. The H ii regions are delimited with black lines in the map. Yellow, red, and green squares are Iglesias-Páramo et al. (2012) pointings, overplotted for comparison. Fluxes are expressed in units of 10−16 erg s−1 cm−2. (The prominent feature observed in some spectra at ∼5500 Å is the O i λ5577 sky emission line, the most visible at Calar Alto.)
Resulting values, included in Table 1, are lower than solar and coincide with those obtained by IP12. Uncertainties are calculated by propagating the errors in quadrature, taking into account the systematic errors due to the flux calibration, and the stellar fitting. Reddening corrections were not applied here, due to the closeness of the lines involved in the ratios.
Oxygen abundances for the H ii regions in NGC 7318A/B pointing, estimated following the Marino et al. (2013) calibration based on the O3N2 indicator.
| Regions | 12 + log(O/H) [O3N2] |
|---|---|
| 1 | 8.45 ± 0.16 |
| 2 | 8.39 ± 0.16 |
| 3 | 8.35 ± 0.16 |
| Regions | 12 + log(O/H) [O3N2] |
|---|---|
| 1 | 8.45 ± 0.16 |
| 2 | 8.39 ± 0.16 |
| 3 | 8.35 ± 0.16 |
As in the case of NGC 7319, diagnostic diagrams provide important information about the shock characteristics. A map analogous to the one represented for NGC 7319 is shown in Fig. 9, with the spaxels colour-coded as a function of their position in the [O iii] λ5007/Hβ versus [N ii] λ6584/Hα diagnostic diagram. Most of the spaxels are coloured in green, as a consequence of their location in the composite zone due to the influence of shocks in their emission. Some spaxels coloured in blue are related to three H ii regions previously discussed.
![NGC 7318A/B spatial map with the spaxels classified according to their position in the [O iii] λ5007/Hβ versus [N ii] λ6584/Hα diagram. Spaxels classified as AGN are displayed in red, spaxels classified as starburst are displayed in blue, and spaxels classified as composite are displayed in green.](https://oup.silverchair-cdn.com/oup/backfile/Content_public/Journal/mnras/442/1/10.1093_mnras_stu851/1/m_stu851fig9.jpeg?Expires=1749839150&Signature=VOQpT1nrqyuKzowdy0Qe1LW6EmJuZ0qBFlzG4f-l9jnCkWJk6Pv~zbJHRrt~94XmAbK9xXHsKyo5~YRnMIeQKFZuJZlf4560PSx9uDLmwnahr-mAs6FYwJW-F9ozJoDsNzsVIitO2MQFNVHUKBmQtsQEdl74zJSlcS8Dqrt8DRBEUFByminDgA7NC~ZjkDVMofcnbHJUVhAsOnHRn9DSNZ5X4OLRyoWqYqwJvNjNMGAWXHXHYb0bu4Ll-eNYRph3gjctJkiGfZibXV~RuC244TcwmQj34nAG3zcb-h76WmkE5gtJUlPcpSQY~SJNl6EfQbrWbWgWiuN2wEViaL9L~w__&Key-Pair-Id=APKAIE5G5CRDK6RD3PGA)
NGC 7318A/B spatial map with the spaxels classified according to their position in the [O iii] λ5007/Hβ versus [N ii] λ6584/Hα diagram. Spaxels classified as AGN are displayed in red, spaxels classified as starburst are displayed in blue, and spaxels classified as composite are displayed in green.
We have analysed the spaxels distribution in [O i] λ6300/Hα versus [N ii] λ6584/Hα and [O i] λ6300/Hα versus [S ii] λλ6717,6731/Hα diagnostic diagrams, that are particularly suitable for the study of shocks, and compared our data location with the predictions from fast-shock models by Allen et al. (2008), as described in Section 3.2. The set of models more consistent with our observational data are those of shocks without precursor with solar metallicity and low pre-shock density (n = 0.1 cm−3), and with velocities between 200 and 400 km s−1. These diagrams and the overplotted models, along with the [O iii] λ5007/Hβ versus [N ii] λ6584/Hα diagram, are shown in Fig. 10. It is interesting to note that spaxels belonging to the H ii regions (coloured in orange) are located in the intermediate region between Kauffmann et al. (2003) and Kewley et al. (2001) demarcation lines. This fact agrees with the recent study by Sanchez et al. (2014), which demonstrates that bona fide H ii regions can be found in this intermediate zone above the Kauffmann et al. (2003) line.
![Line ratio diagnostic diagrams, showing line ratios for independent spaxels in NGC 7318A/B. Spaxels coloured in orange belong to the H ii regions. Overplotted as black lines in the [O iii] λ5007/Hβ versus [N ii] λ6584/Hα diagram are empirically and theoretically derived separations between LINERs/Seyfert and H ii regions. Overplotted as coloured lines are line ratios predicted by models from Allen et al. (2008) for photoionization of gas by a fast shock without precursor with solar metallicity and low density, as described in the text.](https://oup.silverchair-cdn.com/oup/backfile/Content_public/Journal/mnras/442/1/10.1093_mnras_stu851/1/m_stu851fig10.jpeg?Expires=1749839150&Signature=HDt3dEp27vYWMwYzNkZby40pk~tcxvb5XV3ZYp-NFiFZ~zn7vMMUpVDHatDivV~K4mOgJKnWTnv-3rFHFdGqlnPxuGW6yvhq-DDXI3vNL2LzNEPLHPBovHCUg5TpxnYe69EBVmZwoQ0ConYSWFm-NOczkFCCdKZPjbjEw3nveImkR5mGMrJT~H853N7FMTOXH-LPtM7fbhRmITjMXxuo2WXTX4Oj414i8YEeRMwi71hJnUqjsc8UhaYTzEKAgLBINS34G7uDgGUyXK7u3ZrHIHiGXCri0y2IgHLlQtsQrmCBXjAZf4FNARwjjlPB2s4QG4LiXl1Cq~zMbZ2OP-jAWg__&Key-Pair-Id=APKAIE5G5CRDK6RD3PGA)
Line ratio diagnostic diagrams, showing line ratios for independent spaxels in NGC 7318A/B. Spaxels coloured in orange belong to the H ii regions. Overplotted as black lines in the [O iii] λ5007/Hβ versus [N ii] λ6584/Hα diagram are empirically and theoretically derived separations between LINERs/Seyfert and H ii regions. Overplotted as coloured lines are line ratios predicted by models from Allen et al. (2008) for photoionization of gas by a fast shock without precursor with solar metallicity and low density, as described in the text.
IP12 analysis of diagnostic diagrams is based on their previous detection of two kinematical components, and shows that one component overlaps with solar metallicity shock models, while the other is shifted towards models of lower metallicity. These results are compatible with the findings of this paper, and discrepancies may arise from the different characteristics of the data: we have wider FoV and wavelength range (which allows the usage of the diagrams involving the [S ii] λλ6717,6731 lines), but we do not resolve kinematical components, and thus, we do not see the possible existence of different trends within our data. The low metallicities obtained for the H ii regions imply in fact that at least one of the components involved in the collision has metallicity lower than solar. Further studies combining gas emission lines and kinematic analysis and including information on the metallicity are required to further analyse the characteristics of this shock front.
3.4 Peculiar emission in NGC 7317
The elliptical galaxy NGC 7317 shows no significant gas emission by itself. Nevertheless, we do detect a peculiar emission-line source within this pointing: a region located at the southwest of NGC 7317 that can also be observed in the HST image (see Fig. 1), and at first sight may be confused as a background galaxy. An analysis of the spectra of this region reveals that its redshift is concordant with that of NGC 7317; therefore, this emitting region is located close to the elliptical galaxy. The maximum visible length of the region is of ∼8 arcsec, which, adopting a distance of 93.3 Mpc to NGC 7317 (taken from NED and confirmed spectroscopically), corresponds to a physical length of ∼0.35 Mpc.
We extracted the integrated spectrum from this region, showed in Fig. 11, and after subtracting the stellar continuum (see Section 2), we analysed the residual gas emission spectrum. Metallicity was estimated following the procedure explained in Section 3.3, obtaining a value of 8.42 ± 0.03, which is quantitatively very close to the abundance derived for the H ii regions in NGC 7318.

Integrated emission spectrum from the emitting region detected southwest of NGC 7317. Flux is expressed in units of 10−16 erg s−1 cm−2.
We obtained the Hα luminosity from the reddening-corrected Hα flux, considering the mentioned distance to NGC 7317. The Hα flux was corrected for reddening using the Balmer decrement according to the reddening function of Cardelli et al. (1989), assuming R ≡ AV/E(B − V) = 3.1. Theoretical value for the intrinsic line ratio Hα/Hβ was taken from Osterbrock & Ferland (2006), assuming case B recombination (optically thick in all the Lyman lines), an electron density of ne = 100 cm−3 and an electron temperature Te = 104 K. The logarithmic reddening coefficient, c(Hβ), was estimated using the Hα and Hβ lines in each spectrum. The relation between the Hα luminosity and the number of ionizing Lyman continuum photons given by Gonzalez-Delgado et al. (1995) gives the total number of ionizing photons. Using the total number of ionizing photons per unit mass provided by the PopStar models (Mollá, García-Vargas & Bressan 2009) for a zero-age main sequence with Salpeter initial mass function with lower and upper mass limits of 1 and 100 M⊙ and Z = 0.008, we estimate an ionizing cluster mass of 2.2 × 10⁴ M⊙. This is a lower limit of the ionizing mass, as we are considering an unevolved stellar population with no photon escape and no dust absorption.
This work is focused on the ionized gas emission, but as a first approach to this non-previously-studied region we have applied the Starlight synthesis spectral code (Cid Fernandes et al. 2005) to its extracted spectrum in order to characterize its stellar population. We have obtained that about 80 per cent (in mass) of the stars has an age of 1010 yr. This old population indicates that the region should had been formed inside one of the galaxies of the group, and that it was separated from the galaxy afterwards, maybe during some of the interacting episodes within the group.
The nature of this star cluster is intriguing, but may argue that its origin is related to the interacting history of the group, and that it might be a tidal debris tail or the product of a tidal instability which is now orbiting NGC 7317.
3.5 The foreground galaxy NGC 7320
This galaxy lost its membership to SQ when it was found to be a foreground object (Burbidge & Burbidge 1961), but its presence in the data frames is unavoidable. Therefore, it is necessary to know its characteristics, in order to disentangle its emission from that coming from the real members of the group.
The galactic structure is clearly reproduced in the emission-line ratio maps. Fig. 12 shows the Hα emission map, that traces the distribution of the star-forming regions in the galaxy and displays its spiral structure, with multiple H ii regions and H ii complexes of different sizes and morphology. The presence of diffuse emission between the H ii regions is also noticeable. In the [N ii] λ6583/Hα and [O iii] λλ4959,5007/Hβ maps, displayed in Fig. 2, it can be observed that the [N ii] λ6583/Hα ratio has lower values in the central part of the H ii regions, while [O iii] λλ4959,5007/Hβ ratio shows an opposite behaviour. Given that the [N ii] λ6583 emission originates in singly ionized regions, between the fully ionized and the partially ionized zones, the [N ii] λ6583/Hα ratio traces the changes in the local ionization, while the [O iii] λλ4959,5007 originates in the fully ionized zones, tracing the strength of the ionization. Therefore, this distribution may indicate that the ionization is stronger in the outer parts of the galaxy structure.
![Left: Hα emission-line map of NGC 7320, with the extracted H ii regions indicated with red contours. Right: [O iii] λ5007/Hβ versus [N ii] λ6584/Hα diagram, showing line ratios for independent spaxels in NGC 7320.](https://oup.silverchair-cdn.com/oup/backfile/Content_public/Journal/mnras/442/1/10.1093_mnras_stu851/1/m_stu851fig12.jpeg?Expires=1749839150&Signature=a7U1ocx1LVO1-hKwwAue4cb9VwGVFBOYOQAEXNH-1Zs0IIFvwplYlra6yH0eU6v1iD152sZIS-S1A7kQoAcIuaz7~cqhJTp3BPETPes14tkTvw38CtdSOaVHt1d2RquwJvPHlGdi2K~PWFfYjQn5GzQMvC7pbyHy~zfEvB6JDRiSmDHXas40rbEg~L0BbZTLMLHzjGgXhDDcWLQT886oMW7evQZEVccblBLF7ooFZ8J89MEL7Nva61hn~8MA~xB6A8rjyMWeDp7itgAHSSniFlRaaK~O9yTwVTo2K5usUA324os~NARAvMsTmL5rrW1azXIaeoMY7pfiKDNhjLvRCA__&Key-Pair-Id=APKAIE5G5CRDK6RD3PGA)
Left: Hα emission-line map of NGC 7320, with the extracted H ii regions indicated with red contours. Right: [O iii] λ5007/Hβ versus [N ii] λ6584/Hα diagram, showing line ratios for independent spaxels in NGC 7320.
The diagnostic diagrams show the expected spaxels distribution. The [O iii] λ5007/Hβ versus [N ii] λ6584/Hα BPT diagram (included in Fig. 12), as an example, shows that all the spaxels are located in the starburst region, even considering the most restrictive parametrization (Stasińska et al. 2006). Other diagrams show the same tendency.
The stacked spectra from all the H ii regions (indicated in Fig. 12) were extracted, and after accomplishing the fitting process with fit3d (see Section 2), we obtained the measurements of the main line fluxes from the residual spectra. The observed intensities are normalized to the flux of Hβ in units of 10−16 erg s−1 cm−2 Å−1, and are shown in Tables 2 –5 in the columns labelled as F(λ)/Hβ. Thereafter, the observed line intensities were corrected for reddening as explained in Section 3.4. Tables 2–5 show the reddening-corrected emission-line fluxes for each integrated spectrum, designated by the I(λ)/I(Hβ) columns. Uncertainties are calculated as mentioned in Section 3.3.
Integrated line intensities for NGC 7320, regions 1–4. The first column correspond to the emission-line identification, with the rest-frame wavelength. The F(λ)/Hβ column corresponds to the observed flux, while the I(λ)/Hβ to the reddening-corrected values; normalized to Hβ. The observed fluxes in Hβ are expressed in units of 10−16 erg s−1 cm−2.
| 1 | 2 | 3 | 4 | |||||
|---|---|---|---|---|---|---|---|---|
| F(λ)/Hβ | I(λ)/Hβ | F(λ)/Hβ | I(λ)/Hβ | F(λ)/Hβ | I(λ)/Hβ | F(λ)/Hβ | I(λ)/Hβ | |
| [O ii] λ3727 | 4.57 ± 0.97 | 4.57 ± 0.97 | 4.57 ± 0.97 | 4.84 ± 1.21 | 3.08 ± 0.67 | 3.26 ± 0.83 | 3.14 ± 0.65 | 3.42 ± 0.83 |
| [O iii] λ4959 | 0.53 ± 0.09 | 0.53 ± 0.09 | 0.30 ± 0.06 | 0.30 ± 0.06 | 0.21 ± 0.05 | 0.21 ± 0.05 | 0.49 ± 0.08 | 0.49 ± 0.08 |
| [O iii] λ5007 | 1.56 ± 0.23 | 1.56 ± 0.23 | 1.13 ± 0.17 | 1.12 ± 0.17 | 0.91 ± 0.14 | 0.90 ± 0.14 | 1.50 ± 0.21 | 1.49 ± 0.21 |
| He i λ5876 | 0.06 ± 0.02 | 0.06 ± 0.02 | – | – | – | – | – | – |
| [O i] λ6300 | 0.09 ± 0.02 | 0.09 ± 0.02 | 0.11 ± 0.02 | 0.11 ± 0.02 | 0.06 ± 0.02 | 0.06 ± 0.02 | 0.05 ± 0.01 | 0.05 ± 0.01 |
| [N ii] λ6548 | 0.16 ± 0.05 | 0.16 ± 0.05 | 0.15 ± 0.05 | 0.14 ± 0.05 | 0.17 ± 0.05 | 0.16 ± 0.05 | 0.14 ± 0.04 | 0.13 ± 0.04 |
| Hα λ6562 | 2.82 ± 0.36 | 2.82 ± 0.36 | 3.03 ± 0.37 | 2.87 ± 0.50 | 3.03 ± 0.38 | 2.87 ± 0.51 | 3.11 ± 0.37 | 2.87 ± 0.48 |
| [N ii] λ6583 | 0.46 ± 0.08 | 0.46 ± 0.08 | 0.44 ± 0.07 | 0.42 ± 0.09 | 0.50 ± 0.08 | 0.48 ± 0.10 | 0.42 ± 0.06 | 0.39 ± 0.08 |
| [S ii] λ6717 | 0.56 ± 0.09 | 0.56 ± 0.09 | 0.58 ± 0.09 | 0.55 ± 0.11 | 0.53 ± 0.08 | 0.50 ± 0.10 | 0.48 ± 0.07 | 0.44 ± 0.08 |
| [S ii] λ6731 | 0.38 ± 0.07 | 0.38 ± 0.07 | 0.48 ± 0.08 | 0.45 ± 0.09 | 0.42 ± 0.07 | 0.40 ± 0.08 | 0.39 ± 0.06 | 0.35 ± 0.07 |
| F(Hβ) λ4861 | 44.97 | 13.82 | 13.18 | 80.44 | ||||
Integrated line intensities for NGC 7320, regions 5–8. The first column correspond to the emission-line identification, with the rest-frame wavelength. The F(λ)/Hβ column corresponds to the observed flux, while the I(λ)/Hβ to the reddening-corrected values; normalized to Hβ. The observed fluxes in Hβ are expressed in units of 10−16 erg s−1 cm−2.
| 5 | 6 | 7 | 8 | |||||
|---|---|---|---|---|---|---|---|---|
| F(λ)/Hβ | I(λ)/Hβ | F(λ)/Hβ | I(λ)/Hβ | F(λ)/Hβ | I(λ)/Hβ | F(λ)/Hβ | I(λ)/Hβ | |
| [O ii] λ3727 | 4.27 ± 0.90 | 4.64 ± 1.14 | 4.07 ± 0.77 | 4.23 ± 0.94 | 4.77 ± 0.92 | 4.77 ± 0.92 | 4.27 ± 0.85 | 4.57 ± 1.09 |
| [O iii] λ4959 | 0.19 ± 0.04 | 0.19 ± 0.04 | 0.69 ± 0.10 | 0.69 ± 0.10 | 0.31 ± 0.05 | 0.31 ± 0.05 | 0.48 ± 0.08 | 0.48 ± 0.08 |
| [O iii] λ5007 | 0.68 ± 0.10 | 0.68 ± 0.10 | 2.08 ± 0.27 | 2.07 ± 0.27 | 0.95 ± 0.13 | 0.95 ± 0.13 | 1.42 ± 0.20 | 1.41 ± 0.20 |
| He i λ5876 | – | – | – | – | – | – | – | – |
| [O i] λ6300 | – | – | 0.06 ± 0.02 | 0.05 ± 0.02 | 0.08 ± 0.02 | 0.08 ± 0.02 | – | – |
| [N ii] λ6548 | 0.18 ± 0.04 | 0.17 ± 0.04 | 0.12 ± 0.02 | 0.11 ± 0.02 | 0.13 ± 0.02 | 0.13 ± 0.02 | 0.16 ± 0.05 | 0.15 ± 0.05 |
| Hα λ6562 | 3.10 ± 0.36 | 2.87 ± 0.47 | 2.97 ± 0.33 | 2.87 ± 0.44 | 2.83 ± 0.32 | 2.83 ± 0.32 | 3.06 ± 0.37 | 2.87 ± 0.49 |
| [N ii] λ6583 | 0.53 ± 0.07 | 0.49 ± 0.09 | 0.33 ± 0.04 | 0.32 ± 0.05 | 0.38 ± 0.05 | 0.38 ± 0.05 | 0.47 ± 0.08 | 0.44 ± 0.09 |
| [S ii] λ6717 | 0.68 ± 0.09 | 0.63 ± 0.11 | 0.36 ± 0.04 | 0.34 ± 0.06 | 0.50 ± 0.06 | 0.50 ± 0.06 | 0.91 ± 0.13 | 0.85 ± 0.16 |
| [S ii] λ6731 | 0.52 ± 0.07 | 0.47 ± 0.09 | 0.27 ± 0.04 | 0.26 ± 0.05 | 0.38 ± 0.05 | 0.38 ± 0.05 | 0.46 ± 0.08 | 0.43 ± 0.09 |
| F(Hβ) λ4861 | 11.47 | 31.69 | 13.72 | 37.58 | ||||
Integrated line intensities for NGC 7320, regions 9–11. The first column correspond to the emission-line identification, with the rest-frame wavelength. The F(λ)/Hβ column corresponds to the observed flux, while the I(λ)/Hβ to the reddening-corrected values; normalized to Hβ. The observed fluxes in Hβ are expressed in units of 10−16 erg s−1 cm−2.
| 9 | 10 | 11 | ||||
|---|---|---|---|---|---|---|
| F(λ)/Hβ | I(λ)/Hβ | F(λ)/Hβ | I(λ)/Hβ | F(λ)/Hβ | I(λ)/Hβ | |
| [O ii] λ3727 | 3.89 ± 0.91 | 3.89 ± 0.91 | 4.67 ± 0.97 | 5.40 ± 1.32 | 6.28 ± 1.28 | 6.75 ± 1.67 |
| [O iii] λ4959 | 0.32 ± 0.08 | 0.32 ± 0.08 | 0.45 ± 0.08 | 0.44 ± 0.08 | 0.45 ± 0.09 | 0.45 ± 0.09 |
| [O iii] λ5007 | 0.71 ± 0.14 | 0.71 ± 0.14 | 1.43 ± 0.21 | 1.41 ± 0.21 | 1.34 ± 0.22 | 1.33 ± 0.22 |
| He i λ5876 | 0.32 ± 0.06 | 0.32 ± 0.06 | – | – | 0.41 ± 0.10 | 0.39 ± 0.10 |
| [O i] λ6300 | – | – | – | – | 0.16 ± 0.03 | 0.15 ± 0.03 |
| [N ii] λ6548 | 0.14 ± 0.06 | 0.14 ± 0.06 | 0.17 ± 0.03 | 0.14 ± 0.03 | 0.19 ± 0.04 | 0.18 ± 0.05 |
| Hα λ6562 | 2.52 ± 0.36 | 2.52 ± 0.36 | 3.29 ± 0.40 | 2.87 ± 0.49 | 3.07 ± 0.41 | 2.87 ± 0.54 |
| [N ii] λ6583 | 0.41 ± 0.09 | 0.41 ± 0.09 | 0.48 ± 0.07 | 0.42 ± 0.07 | 0.56 ± 0.08 | 0.52 ± 0.10 |
| [S ii] λ6717 | 0.68 ± 0.12 | 0.68 ± 0.12 | 0.62 ± 0.08 | 0.54 ± 0.10 | 0.82 ± 0.12 | 0.76 ± 0.15 |
| [S ii] λ6731 | 0.40 ± 0.08 | 0.40 ± 0.08 | 0.41 ± 0.06 | 0.36 ± 0.07 | 0.59 ± 0.09 | 0.55 ± 0.11 |
| F(Hβ) λ4861 | 11.64 | 17.34 | 26.22 | |||
Integrated line intensities for NGC 7320, regions 12–14. The first column correspond to the emission-line identification, with the rest-frame wavelength. The F(λ)/Hβ column corresponds to the observed flux, while the I(λ)/Hβ to the reddening-corrected values; normalized to Hβ. The observed fluxes in Hβ are expressed in units of 10−16 erg s−1 cm−2.
| 12 | 13 | 14 | ||||
|---|---|---|---|---|---|---|
| F(λ)/Hβ | I(λ)/Hβ | F(λ)/Hβ | I(λ)/Hβ | F(λ)/Hβ | I(λ)/Hβ | |
| [O ii] λ3727 | 3.79 ± 0.79 | 4.37 ± 1.08 | 3.66 ± 0.67 | 3.66 ± 0.67 | 3.84 ± 0.73 | 4.17 ± 0.93 |
| [O iii] λ4959 | 0.44 ± 0.08 | 0.43 ± 0.08 | 0.64 ± 0.08 | 0.64 ± 0.08 | 0.52 ± 0.08 | 0.52 ± 0.08 |
| [O iii] λ5007 | 1.34 ± 0.20 | 1.32 ± 0.20 | 2.01 ± 0.25 | 2.01 ± 0.25 | 1.76 ± 0.23 | 1.74 ± 0.23 |
| He i λ5876 | – | – | 0.02 ± 0.01 | 0.02 ± 0.01 | – | - |
| [O i] λ6300 | 0.06 ± 0.02 | 0.06 ± 0.02 | 0.04 ± 0.01 | 0.04 ± 0.01 | 0.07 ± 0.01 | 0.07 ± 0.01 |
| [N ii] λ6548 | 0.21 ± 0.04 | 0.18 ± 0.04 | 0.12 ± 0.02 | 0.12 ± 0.02 | 0.16 ± 0.03 | 0.16 ± 0.03 |
| Hα λ6562 | 3.28 ± 0.41 | 2.87 ± 0.51 | 2.77 ± 0.28 | 2.77 ± 0.28 | 3.10 ± 0.35 | 2.87 ± 0.45 |
| [N ii] λ6583 | 0.60 ± 0.08 | 0.52 ± 0.10 | 0.36 ± 0.04 | 0.36 ± 0.04 | 0.51 ± 0.06 | 0.47 ± 0.08 |
| [S ii] λ6717 | 0.72 ± 0.10 | 0.62 ± 0.12 | 0.40 ± 0.04 | 0.40 ± 0.04 | 0.63 ± 0.08 | 0.58 ± 0.10 |
| [S ii] λ6731 | 0.49 ± 0.07 | 0.42 ± 0.08 | 0.27 ± 0.03 | 0.27 ± 0.03 | 0.46 ± 0.06 | 0.42 ± 0.07 |
| F(Hβ) λ4861 | 15.11 | 133.6 | 54.69 | |||
We estimate the H ii regions metallicities from the line intensities and their uncertainties as explained in Section 3.3. Obtained values are included in Table 6. We plot the metallicity of the H ii regions as a function of their deprojected distances to the nucleus normalized to the optical radius (R25; de Vaucouleurs et al. 1991) in Fig. 13. A very subtle metallicity gradient is observed between the distances of 0.3 and 0.65 r/R25, while the internal region of the galaxy presents a lower metallicity value, both phenomena described in Sánchez et al. (2012). Two puzzling regions show high metallicity values although being located at high galactocentric distances, that might suggest an average flat oxygen abundance for the entire galaxy disc.
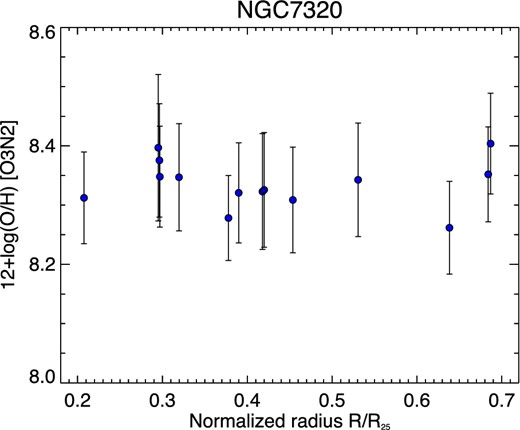
Gas-phase oxygen abundance obtained for the H ii regions in NGC 7320 as a function of the deprojected galactocentric distance normalized to the optical radius.
Oxygen abundances for the H ii regions in NGC 7320 pointing, estimated following the Marino et al. (2013) calibration, using O3N2 indicator.
| 1 | 2 | 3 | 4 | 5 | 6 | 7 | |
|---|---|---|---|---|---|---|---|
| 12 + log(O/H) | 8.32 ± 0.09 | 8.34 ± 0.09 | 8.38 ± 0.10 | 8.31 ± 0.09 | 8.40 ± 0.08 | 8.26 ± 0.08 | 8.35 ± 0.08 |
| 8 | 9 | 10 | 11 | 12 | 13 | 14 | |
| 12 + log(O/H) | 8.33 ± 0.10 | 8.40 ± 0.12 | 8.32 ± 0.08 | 8.35 ± 0.09 | 8.35 ± 0.09 | 8.28 ± 0.07 | 8.31 ± 0.08 |
The mean value of the metallicities from the H ii regions allows us to estimate the value of the stellar mass, using the mass-metallicity relation from Sánchez et al. (2013) based on CALIFA data (Sánchez et al. 2012). We find that the mass galaxy is of the order of 15 × 108 M⊙, which indicates that it is a low-mass galaxy.
4 SUMMARY AND CONCLUSIONS
We have analysed IFS observations of SQ provided by the PINGS survey. The data were composed by four pointings, each one with a FoV of 74×65 arcsec2 and containing 331 optical fibres that provided spectra with a wavelength range between 3700 and 7100 Å and with a spectral resolution of 10 Å FWHM. The pointings were centred on the bulges of NGC 7317, NGC 7319, NGC 7320 and in configuration over NGC 7318A and NGC 7318B. The stellar population of each spaxel spectrum was subtracted by the application of the fit3d software, in order to obtain the pure emission spectra. Thus, we were able to analyse the gas emission from all the galaxies with an unprecedented spatial resolution. For three of the pointings (except NGC 7317) we obtained maps of the main emission-line ratios, and represented diagnostic diagrams where the spatial resolution of the data allowed us to locate separately each one of the spaxels from the data cube. As a consequence we could detect and study different ionization sources coexisting in the same region.
In NGC 7319, the analysis was focused in the active nucleus and its surroundings. The stacked spectrum from the nucleus confirmed its classification as Seyfert 2. A96 already reported the presence of a high-velocity outflow within this galaxy, based on the detection of a region in the south-west of the nucleus where the gas is blueshifted from the systemic velocity by 300 km s−1 in average and 500 km s−1 at maximum. Our data have not enough spectral resolution to develop a kinematic analysis, but we have studied the effect of this outflow in the measured emission-line ratios. We have compared the spaxels distribution in the diagnostic diagrams with the predictions from fast-shock models by Allen et al. (2008) and from AGN models by Groves et al. (2004), obtaining that the sum of both ionization sources is necessary to explain the observed ratios. While A96 considered that photoionization by AGN was the only responsible mechanism of the excitation of the gas, the wide FoV and the spatial resolution of our results reveal the presence of shocks with precursor with a velocity range of ∼200–1000 km s−1 coexisting with the AGN photoionization.
In the case of the NGC 7318A/B pointing, gas line emission arises almost exclusively from the shock front. Shocked gas emission spectra confirmed the presence of several kinematic components, as reported in IP12. Two H ii regions were detected in the south, and their gas oxygen abundances were estimated using the updated O3N2 calibrator by Marino et al. (2013), corresponding to a subsolar metallicity. The comparison of the spaxels distribution in the diagnostic diagrams with the predictions from fast-shock models by Allen et al. (2008) suggests that our observational data are consistent with shocks without precursor with solar metallicity and low pre-shock density, in a range of velocities of ∼200–400 km s−1. Our results confirm and complement those obtained by IP12, especially in terms of the subsolar metallicities obtained for the H ii regions.
NGC 7317 showed no significant gas emission by itself, and we could not obtain maps or diagnostic diagrams for this pointing. Nevertheless, an emitting region was detected south-west to the galaxy. Its integrated spectrum was extracted, and we estimated its metallicity and the ionizing star cluster mass. We postulate that this cluster might be the result of a tidal interaction with the rest of the members in the SQ group.
Finally, as a by-product of the IFS observations, we analyse the 2D distribution of the star-forming regions in the foreground galaxy NGC 7320. The spectra from all the H ii regions were extracted, and the metallicities were calculated from the reddening-corrected line intensities. The representation of these metallicity values as a function of the deprojected distances to the nucleus shows a weak metallicity gradient along r/R25 with a metallicity fall in the internal region, as expected (Sánchez et al. 2013), and two puzzling regions with high metallicity values at high galactocentric distances. Using the mass–metallicity relation from Sánchez et al. (2013), we estimate that NGC 7320 is a low-mass galaxy, with a mass of the order of 15 × 108 M⊙.
We thank the anonymous referee for all the comments and suggestions that improved the content of the paper. We would like to thank Rubén García-Benito for his support and useful discussions during the preparation of this manuscript. We acknowledge financial support for the ESTALLIDOS Collaboration by the Spanish Ministerio de Ciencia e Innovación under grant AYA2010-21887-C04-03. We acknowledge financial support from the Marie Curie FP7-PEOPLE-2013-IRSES scheme, under the SELGIFS Collaboration (Study of Emission-Line Galaxies with Integral-Field Spectroscopy). MRB acknowledges financial support by the Spanish Ministerio de Economía y Competitividad under the FPI fellowships programme. FFRO acknowledges the Mexican National Council for Science and Technology (CONACYT) for financial support under the programme Estancias Posdoctorales y Sabáticas al Extranjero para la Consolidación de Grupos de Investigación, 2010-2012.
Based on observations collected at the Centro Astronómico Hispano Alemán (CAHA) at Calar Alto, operated jointly by the Max-Planck Institut für Astronomie and the Instituto de Astrofísica de Andalucía (CSIC).
iraf is distributed by the National Optical Astronomy Observatories, which are operated by the Association of Universities for Research in Astronomy, Inc., under cooperative agreement with the National Science Foundation.
