


Abstract
We present Kepler and Swift observations of StHa 169 which is currently classified as a symbiotic binary. The Kepler light curve shows quasi-periodic behaviour with a mean period of 34 d and an amplitude of a few per cent. Using Swift data, we find a relatively strong UV source at the position of StHa 169 but no X-ray counterpart. Using a simple two-component blackbody fit to model the combined Swift and 2MASS spectral energy distribution and an assessment of the previously published optical spectrum, we find that the source has a hot (∼10 000 K) component and a cooler (∼3700 K) component. The Kepler light is dominated by the cool component and we attribute the variability to pulsations in a red giant star. If we remove this approximate month long modulation from the light curve, we find no evidence for additional variability in the light curve. The hotter source is assigned to a late B or early A main-sequence star. We briefly discuss the implications of these findings and conclude that StHA 169 is a red giant plus main-sequence binary.
1 INTRODUCTION
Symbiotic stars are interacting binary systems containing a red giant star and a hotter component, which can be a white dwarf, a main-sequence star or even a neutron star (see Mikolajewska 2007 for a review). A relatively small fraction of these binaries show evidence for accretion on to the hot component via a disc, while the remainder show evidence of accretion via the wind from the giant star and, in some systems, nuclear burning occurs on the surface of the hot component (see Kenyon & Webbink 1984). Some systems such as CH Cyg, have produced jets (e.g. Taylor, Seaquist & Mattei 1986; Crocker et al. 2001; Galloway & Sokolski 2004) and large variations (∼5 mag) in optical brightness over year long time-scales (e.g. Mikolajewski, Mikolajewska & Khudiakova 1990). More recently, evidence has been presented which suggests that symbiotic stars could be progenitors of a fraction of supernovae 1a explosions (e.g. Dilday et al. 2012).
Given the fact that symbiotic stars contain a red giant star, the binary orbital periods are the longest (ranging from several hundreds of days to many years) found in the many different types of interacting binaries. As such, long-duration photometric surveys such as OGLE have been used to search for signatures of the binary period (e.g. Angeloni et al. 2014). In contrast, high time resolution photometry or spectroscopic observations are required to search for the presence of phenomena such as accretion whose rate can be variable over the medium to long time-scale (e.g. Sokolski, Bildstein & Ho 2001; Sokolski & Kenyon 2003).
The Kepler mission (Borucki et al. 2010) provides a unique opportunity to study objects such as symbiotic binaries on short time-scales (1 min) and also much longer time-scales (the initial Kepler pointing lasted approximately 4 yr). There were two objects classified as symbiotic binaries in the Kepler field – the previously mentioned system CH Cyg – and StHA 169. This paper presents an analysis of Kepler and Swift observations of StHA 169.
2 StHA 169
StHA 169 (also known as NSV 12466 and S169) was classified as a symbiotic binary by Downes & Keyes (1988), and is in the catalogue of symbiotic binaries of Belczyński et al. (2000), as a result of its optical spectrum which ‘resembles that of the quiescent phase of the symbiotic recurrent nova RS Oph’. StHA 169 has the identifier KIC 9603833 in the Kepler Input Catalogue (Brown et al. 2011) and has a magnitude of g = 14.37 and colour g − r = 1.60 in the Kepler INT Survey (Greiss et al. 2012) and g = 14.12 and g − r = 1.42 in the RATS-Kepler Survey (Ramsay et al. 2014). StHa 169 is recorded in the ASAS survey of the Kepler field (Pigulski et al. 2009) as a source with ‘no well-defined periodicity in light variations’.
3 KEPLER PHOTOMETRIC OBSERVATIONS
The detector on board Kepler is a shutterless photometer using 6 s integrations and a 0.5 s readout. There are two modes of observation: long cadence (LC), where 270 integrations are summed for an effective 29.4 min exposure (this includes deadtime), and short cadence (SC), where nine integrations are summed for an effective 58.8 s exposure. Gaps in the Kepler data streams result from, for example, 90° spacecraft rolls every 3 months (called Quarters), and monthly data downloads using the high-gain antenna.
Kepler data are available in the form of FITS files which are distributed by the Mikulski Archive for Space Telescope (MAST).1 For LC data each file contains one observing quarter worth of data whereas for SC data one file is created per month. After the raw data are corrected for bias, shutterless readout smear, and sky background, time series are extracted using simple aperture photometry (SAP). We note in Table 1 the Kepler Quarters in which LC data were obtained and also the Kepler months in which SC mode data were obtained. The first data to be taken (Q0) started in 2009 May and the final data (Q17) finished in 2013 May.
Journal of Kepler observations. Each quarter nominally lasts 3 months with a short gap between months. SC observations are made on a monthly basis. Quarter 17 was truncated to approximately 1 month.
| LC | SC |
|---|---|
| (Quarter) | (Quarter/Month) |
| 0, 1, 2, 3, 4, 5, 6, 8, 9, 10, 12, 13, 14, 16, 17 | 6/2, 14/2 |
| LC | SC |
|---|---|
| (Quarter) | (Quarter/Month) |
| 0, 1, 2, 3, 4, 5, 6, 8, 9, 10, 12, 13, 14, 16, 17 | 6/2, 14/2 |
3.1 LC observations
Using the data downloaded from MAST, we used the ‘simple aperture photometry’ (SAP) data and removed data which do not conform to ‘SAP_QUALITY=0’ (for instance, time intervals of enhanced solar activity) and then normalized this light curve so that the mean count rate was unity (Fig. 1). There are clear flux variations on a time-scale of tens of days and a semi-amplitude of several per cent.

The upper light curve shows the normalized LC data of StHa 169. The lower light curve has been de-trended and normalized and corrected so that there are no step changes in flux between different quarters.
To remove systematic trends in the data (e.g. Kinemuchi et al. 2012), we used the task kepcotrend which is part of the pyke software (Still & Barclay 2012).2 We then applied a small offset so that there are no discrete jumps in flux between the different quarters of data. This light curve is also shown in Fig. 1 and shows similar features but with fewer large flux variations at the start and end of quarters.
We show the Lomb–Scargle power spectrum (Lomb 1976; Scargle 1982) of the corrected light curve in Fig. 2. The peaks correspond to periods of 40.0, 38.5 and 36.3 d. There are also peaks in the power spectrum at ∼200 and 260 d. However, given the presence of data gaps, the necessary adjustments between each quarter of data and the known presence of a modulation due to the Kepler year (372.5 d) in the data of giant stars (Bányai et al. 2013), some caution is necessary in interpreting long-period signals in power spectra such as these.
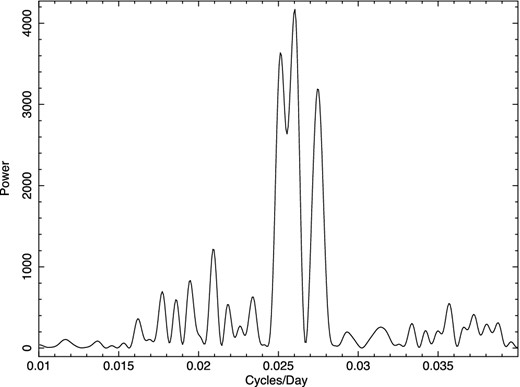
The Lomb–Scargle power spectrum of the light curve corrected for systematic trends and jumps between different quarters.
To further investigate the nature of the light curve, we determined the time of maximum for every peak in the light curve by eye (the error on the time of maximum was generally 0.3 d which is very much smaller than the range of duration of each cycle) and then calculated the time difference between successive peaks. The duration of each cycle is shown in Fig. 3 and shows a considerable range in the duration of each cycle, ranging from 23 to 52 d, with a mean of 34.2 d and σ = 8.4 d.
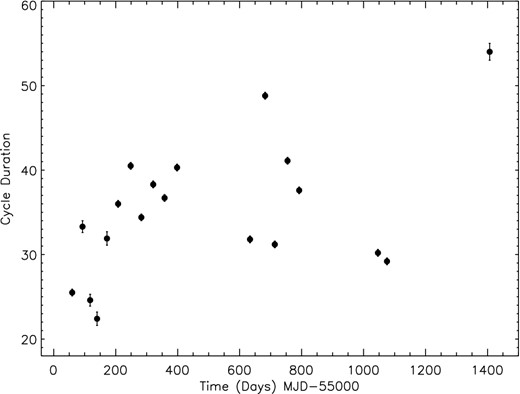
The length of the ‘month’ long pulsation period of StHa 169 as a function of time. The length is defined as the time difference between a given peak in the light curve and the previous peak.
3.2 SC observations
StHa 169 was observed in two quarters (6 and 14) using SC mode, which provides photometry with effective exposure times of 58 s and allows the short-term photometric behaviour to be studied in more detail. To remove the effects of systematic trends and also the 25–50 d pulsation period we used the pyke task kepflatten. After normalizing the data by dividing the light curve by the mean flux we found the rms was 0.000 48 and 0.000 49 for data in quarters/months 6.2 and 14.2, respectively. This result shows very little evidence of short period variability in the Kepler light curve.
4 SWIFT OBSERVATIONS
StHa 169 lies ∼5 arcmin distant from the γ-ray burst GRB060105 and therefore within the field of view of the X-ray (XRT) and optical/UV (UVOT) instruments on board Swift. Observations were made between 2006 Jan 5 and 11. However, only in the data set comprising ObsId 00175942000 (Jan 5 and 6) were observations made in the UV filters. We therefore restrict ourselves to this data set.
We show in Table 2 the filters in which observations were obtained. We used the ftool task uvotsource3 to determine the mean count rate for StHa 169 and the corresponding flux. The exposure time of each UVOT image is generally 500–700 s in duration, and there were 7 images in the UVW1 filter and 13 images in the UVM2 filter (other filters had values between these numbers). Based on the count rates derived from these images, we determined the rms and expected rms (assuming Poisson statistics) and the corresponding value sfrac (= rms/count rate). These numbers are given in Table 2. In no case was the rms variation greater than twice the expected rms. We also did the same analysis using event rate data which were obtained using the UVM2 filter. We binned the data using different binsizes and show the results for a 4 and a 60 s binsize in Table 2. Again the rms/rmsexp ratio is less than 2 (and was for all attempted binsizes). This finding of very low short-term variability is consistent with that found in the SC Kepler observations.
Details of the Swift UVOT observations made in 2006 Jan 5 and 6 where we indicate: the filter and its central wavelength; the mean count rate and flux; the rms derived from the given number of points. We also indicate the expected rmsexp which is determined from the mean count rate and sfrac = rms/Rate. We also determine sfrac for two different bin sizes and were derived from the event data.
| Filter | Wavelength | Rate | Flux | rms | rmsexp | rms/ | sfrac | Points | Bin size | sfrac |
|---|---|---|---|---|---|---|---|---|---|---|
| (Å) | (Ct s−1) | (erg s−1 cm−2 Å) | (Ct s−1) | (Ct s−1) | rmsexp | (sec) | ||||
| V | 5468 | 62.9 ± 0.9 | 1.64 ± 0.02 × 10⁻¹⁴ | 0.90 | 1.47 | 0.61 | 0.014 | 13 | ||
| B | 4392 | 72.3 ± 1.9 | 1.06 ± 0.03 × 10⁻¹⁴ | 1.87 | 1.54 | 1.21 | 0.027 | 12 | ||
| U | 3470 | 81.6 ± 2.8 | 1.32 ± 0.03 × 10⁻¹⁴ | 2.84 | 1.94 | 1.45 | 0.035 | 12 | ||
| UVW1 | 2510 | 27.8 ± 0.9 | 1.17 ± 0.04 × 10⁻¹⁴ | 0.91 | 0.75 | 1.21 | 0.033 | 7 | ||
| UVM2 | 2250 | 12.9 ± 0.6 | 1.09 ± 0.03 × 10⁻¹⁴ | 0.57 | 0.38 | 1.50 | 0.044 | 13 | ||
| 11.51 | 1.94 | 1.70 | 1.14 | 0.17 | 4 | 0.17 | ||||
| 11.54 | 1.09 | 0.70 | 1.56 | 0.09 | 60 | 0.09 | ||||
| UVW2 | 1880 | 19.8 ± 0.6 | 1.18 ± 0.03 × 10⁻¹⁴ | 0.61 | 0.52 | 1.27 | 0.031 | 9 |
In their study of symbiotic binaries using Swift, Luna et al. (2013) found that in the UV 33 non-saturated sources shows rms/rmsexp > 2. All the sources which did not show significant rms variability were fainter in that band compared to StHa 169. StHa 169 therefore displays an unusually low degree of variability compared to the majority of symbiotic binaries.
In the data set comprising ObsID 00175942000, the combined X-ray exposure was 57.8 ks. However, there is no detection of a source at the position of StHa 169. The count rate for the location of StHa 169 is 0.000 011 ± 0.000 009 count s−1 where we have used a source aperture of 20 arcsec (which excludes a nearby X-ray source) and subtracting a scaled and much larger background aperture. The XRT is sensitive to a flux of ∼1.5 × 10⁻¹⁴ erg s−1 cm−2 for this observation.
5 SPECTRAL ENERGY DISTRIBUTION
With the available data of StHa 169 ranging from the near-UV and optical (Swift), the near-IR (2MASS) and far-IR (WISE), we can obtain the broad spectral energy distribution of StHa 169 and from that assess which binary component is dominant in the Swift and Kepler band-passes. However, as symbiotic stars are known to show flux variations over the long term, some assessment needs to be made as to the long-term variability of StHa 169. Perhaps the most spectacular long-term variability seen in a symbiotic star is CH Cyg which has shown variations of 6 mag in the U band, although the variation is much reduced (<1 mag) at infrared bands (e.g. Munari et al. 1996). On the other hand, other symbiotic systems show much lower levels of long-term variability. For instance, in a study of symbiotic binaries in the LMC (Angeloni et al. 2014), two systems showed a variation less than 14 per cent in the I band over a time span of more than 800 d.
However, perhaps the best evidence of long-term variability is the Kepler data of StHa 169 itself which span nearly 4 yr. This shows a standard deviation of 3.6 per cent in the unnormalized light curve and 2.7 per cent in the unnormalized de-trended light curve. Other data, for instance, the g mag from the KIS and RATS-Kepler surveys differ by 0.25 mag, while the V mag from the Swift mission and the Kepler UBV survey (Everett, Howell & Kinemuchi 2012) differ by 0.28 mag. ASAS had (incomplete) coverage of StHa 169 over a 600 d interval and found a standard deviation of 0.13 mag in the light curve (Pigulski et al. 2009).
We therefore use Swift data from the data set ObsId 00175942000 (as we used in the previous section) since photometric data using six UVOT filters were made within a short (2 d) time interval. We have also extracted from the archives the 2MASS and WISE flux measurements. In Table 3 and Fig. 4, we show the observed fluxes from these instruments in mJy.
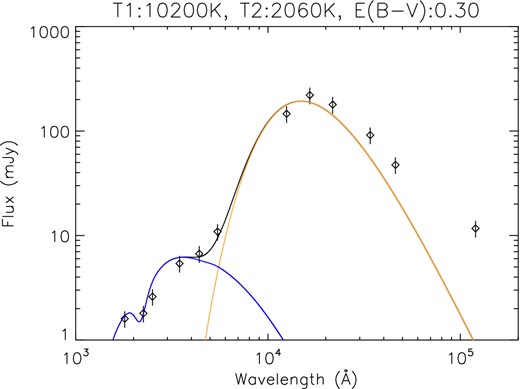
The spectral energy distribution of StHa 169 from the near-UV to near-IR. The absorbed flux unit is mJy and we show the joint fit (solid line) from two blackbody models with temperature ∼2100 and ∼10 200 K and absorption E(B − V) = 0.26. We have not used the WISE points (the three right-most points) in the fit.
The observed flux in mJy of StHa 169. The errors for Swift fluxes come from the standard deviation of the observed fluxes in Swift data obtained during 2006 Jan 5 and 6. The error on the 2MASS and WISE fluxes come from the error on the magnitude in the 2MASS and WISE catalogues.
| Wavelength | Filter | Flux |
|---|---|---|
| (Å) | (mJy) | |
| 1880 | Swift UVW2 | 1.6 ± 0.1 |
| 2250 | Swift UVM2 | 1.8 ± 0.1 |
| 2510 | Swift UVW1 | 2.6 ± 0.1 |
| 3470 | SwiftU | 5.4 ± 0.2 |
| 4392 | SwiftB | 6.7 ± 0.2 |
| 5468 | SwiftV | 16.0 ± 0.2 |
| 12 500 | 2MASS J | 146.0 ± 3.1 |
| 16 500 | 2MASS H | 220.5 ± 3.2 |
| 21 700 | 2MASS K | 179.1 ± 2.6 |
| 34 000 | WISEW1 | 91.4 ± 2.0 |
| 46 000 | WISEW2 | 47.4 ± 0.9 |
| 120 000 | WISEW3 | 11.7 ± 0.3 |
Although cool stars are poorly fit by blackbody models (which we discuss in the next section) they are simple to use and allow us to easily determine which stellar component is dominant in the Kepler and Swift band-passes. The fractional residuals to a two-blackbody model were measured to have a scatter of 18 per cent about the fit (Fig. 4). To account for any changes in the brightness at different epochs, we therefore assigned the error in each photometric band to be 18 per cent and carried out a set of 200 Monte Carlo simulations to derive the errors for the parameters. We find T1 = 10 200 ± 1100 K, T2 = 2060 ± 140 K, The ratio of projected areas (red giant/blue star) is 29 800 ± 12 000 and E(B − V) = 0.30 ± 0.10. Although the WISE flux measurements are shown in Fig. 4, we have not actually used them in the fit since emission from dust (originating in the immediate vicinity of StHa 169) is likely to be strong at these wavelengths. Indeed, given that the WISE flux measurements are in excess of the model fit, this points to the presence of dust in the StHa 169 system.
What this simple modelling shows is that the Kepler band-pass (4200–9000 Å) is dominated by the flux from a cool star, while the UV and blue flux in the Swift UVOT is dominated by a hotter component. In the V band, the cool component contributes 70 per cent of the observed flux.
6 THE NATURE AND DISTANCE OF THE BINARY COMPONENTS
Although the above modelling gives approximate temperatures for the two components, it is well known that cool stars (of any spectral class) are very poorly fit by a blackbody model. To obtain a better estimate of the temperature of the cool star in StHa 169, we used the spectral atlas of Pickles (1998) and the published spectrum of StHa 169 (fig. 4 of Downes & Keyes 1988). Given that the Kepler data strongly supports the view that the cool star is a pulsating giant, we compared red giant spectra given in Pickles (1998) with StHa 169. Based on the general shape of the spectra of StHa 169 and the dip near 5452 Å, we assign a spectral type of M2III–M3III to StHa 169. Assuming this range of spectral type we can then assign a temperature of 3650–3750 K (Straizys & Kuriliene 1981) which is considerably hotter than the fit derived using two blackbody components (2100 K) but physically more realistic for a pulsating red giant star.
Using the information to hand, we can make estimates on the distance to StHa 169 using different assumptions and assess the nature of the hot component. For an observed (J − K) = 1.17 and (J − K)o = 0.90, Tabur, Kiss & Bedding (2009) indicate that this colour implies MK ∼ −4.5 and a resulting distance of ∼4.5 kpc, whilst the same authors find that the absolute magnitude of the tip of the red giant branch is MK = −6.85 implying a distance of 13.7 kpc if StHa 169 was on at this stage in its evolution. We can also make an approximate estimate of the distance to the system by taking the observed relationship between the pulsation period of red giants and MK (Tabur et al. 2010). For a pulsation period of 34 d, we estimate MK ∼ −5.8 ± 0.5 and a distance of 8.6 ± 2.4 kpc.
Although there is a significant degree of uncertainty (and range) in these distances (and it is possible the K band may have residual dust contamination, see Section 5), we conclude that StHa 169 is at least 4 kpc distant. Gaia should be able to determine the distance to StHa 169 with an accuracy of ∼20 per cent.
Our blackbody fits (Section 5) suggest that the temperature of the hotter component is ∼10 000 K which is very similar to Vega (an AOV star). Our blackbody fits indicate that the hotter component contributes 30 per cent of the overall flux in the V band, and that an AOV star would lie at a distance of 5.3 kpc. On the other hand, if the hotter component was a pure hydrogen white dwarf with a temperature of 10 000 K, it would have an absolute magnitude of MV = 12.1 (Bergeron, Wesemael & Beauchamp 1995), implying a distance of 26 pc. Even if there was an accretion disc around a white dwarf (which could brighten the absolute magnitude by 2 mag), the distance would be very much closer than that inferred using the cooler component. We conclude that the hot component in StHa 169 is not a white dwarf. However, the hotter star must be less massive than the red giant star (estimated to be 3.3–3.5 M⊙). An AO V star has a mass of 2.2 M⊙ while a B8 V star has a mass of 3.0 M⊙ (Straizys & Kuriliene 1981).
7 DISCUSSION AND CONCLUSIONS
The Swift-2MASS spectral energy distribution of StHa 169 indicates that there are two components, one relatively hot and one relatively cool. Using additional information, such as the existing optical spectrum of Downes & Keyes (1988), our best estimate for the temperature of the two components is 10 000 and 3700 K. The Kepler observations therefore sample the cooler (and physically much larger) component, while the Swift UV and blue filters sample the hotter component. The Kepler light curve shows quasi-periodic behaviour with a mean period of 34 d. Given that this period is not stable, it is clearly not the signature of a binary orbital period. Rather it indicates that the cool component is a pulsating red giant star. This is consistent with the suggestion made by Downes & Keyes (1988) that the cool component in StHa 169 has an M spectral type and resembles the red giant in the recurrent nova RS Oph (Porb = 460 d; Dobrzycka & Kenyon 1994; M0–M2 III, Dobrzycka et al. 1996).
Further confirmation of the evolutionary status of the red giant in StHA 169 is provided through its frequency spectrum. Kepler photometry has been used extensively to characterize red giants as to their membership on the RGB or the AGB (Chaplin et al. 2013). The Kepler light curve of StHa 169 is very similar in character to, say, the red giant KIC 2986893 (Bányai et al. 2013) which has a mean period of 21.7 ± = 2.2 d. However, given that StHa 169 has a wide range of pulsation period, it is possible that it is a Semi Regular Variable (cf. Soszyński, Wood & Udalski 2013). Bányai et al. (2013) showed that M giants separate into three distinct groups according to their period structure. StHA 169 and KIC 2986893 belong to group 1 – red giants with periods between 10 and 100 d. Group 1 stars with a period similar to that found in StHa 169 tend to lie the upper red giant branch (see Kiss & Bedding 2003, Kiss & Bedding 2004) and are pulsating due to first and second overtone modes. (Given the main-sequence lifetime of a 3.3 M⊙ star is 500 Myr, the system is at least this old.)
The identification of StHa 169 as a symbiotic star lies solely with the optical spectrum presented in Downes & Keyes (1988). The spectral energy distribution as derived from Swift and 2MASS photometry and presented in Section 5 is consistent with StHa 169 being a binary system. Similarly, our detection of pulsations in the Kepler data clearly demonstrates that the cool star is a red giant. However, determining the nature of the hot component in symbiotic stars is not a trivial task (see, for instance, Sokolski & Bildstein 2010 who recount the quarter of a century debate on the nature of the hot star in the Mira AB system). Our spectral energy distribution shows that an isolated white dwarf or a white dwarf with an accretion disc would not lie at the same inferred distances for the red giant component. Instead, our results favour that the hot star is more likely to be a late B or early A main-sequence star. The absence of short-period variability in the UV and the non-detection in X-rays suggest that accretion was not taking place at the time of these Swift observations.
There are at least two other sources which bear some similarity to StHa 169: XX Oph and AS 325 which are thought to consist of a Be star and a red giant secondary (Howell, Johnson & Adamson 2009). Indeed, AS 325 was originally taken to be a symbiotic system. The fact that the optical spectrum of StHa 169 (Downes & Keyes 1988) shows the Balmer lines (and He ii 4686Å) in emission may indicate that the B/A star is an emission star (either through a wind or accretion). Stars like these are interesting from a binary evolution point of view. Determining the binary orbital period is a key step but will be difficult to disentangle the signature of the binary period from the red giant pulsations.
Kepler was selected as the 10th mission of the Discovery Program. Funding for this mission is provided by NASA, Science Mission Directorate. The Kepler data presented in this paper were obtained from the Multimission Archive at the Space Telescope Science Institute (MAST). STScI is operated by the Association of Universities for Research in Astronomy, Inc., under NASA contract NAS5 26555. Support for MAST for non-HST data is provided by the NASA Office of Space Science via grant NAG5 7584 and by other grants and contracts. This work made use of pyke, a software package for the reduction and analysis of Kepler data. This open source software project is developed and distributed by the NASA Kepler Guest Observer Office. Armagh Observatory is supported by the Northern Ireland Government through the Department of Culture, Arts and Leisure. We thank the anonymous referee for a useful report.
