


Abstract
We report results from our 1D radiative transfer modelling of dust in the hydrogen-deficient planetary nebula IRAS 18333−2357 located in the globular cluster M22. A spectral energy distribution was constructed from archival UV, optical and IR data including Akari photometry at its 18, 65, 90, 140 and 160 μm bands. An archival Spitzer spectrum shows several aromatic infrared bands indicating a carbon-rich dust shell. The spectral energy distribution is well fitted by a model which considers a modified Mathis–Rumpl–Nordsieck grain size distribution and a radial density function which includes compression of the nebula by its interaction with the Galactic halo gas. The model indicates that a significant amount of cold dust, down to a temperature of 50 K, is present at the outer edge of the nebula. At the inner edge, the dust temperature is 97 K. The dust shell has a size of 26 ± 6.3 arcsec. We find a large amount of excess emission, over the emission from thermal equilibrium dust, in the mid-IR region. This excess emission may have originated from the thermally fluctuating dust grains with size ∼12 Å in the UV field of the hot central star. These grains, however, come from the same population and conditions as the thermal equilibrium grains. The dust mass of this grain population is (1.2 ± 0.73) × 10−3 M⊙ and for the thermal equilibrium grains it is (1.4 ± 0.60) × 10−4 M⊙, leading to a total dust mass of (1.3 ± 0.91) × 10−3 M⊙. The derived dust-to-gas mass ratio is 0.3 ± 0.21. For a derived bolometric luminosity of (1700 ± 1230) L⊙ and an assumed central star mass of (0.55 ± 0.02) M⊙, the surface gravity is derived to be log g = 4.6 ± 0.24. We propose that the progenitor of IRAS 18333−2357 had possibly evolved from an early stellar merger case and the hydrogen-deficient nebula results from a late thermal pulse. The hydrogen-rich nebula, which was ejected by the progenitor during its normal asymptotic giant branch evolution, might have been stripped off by its strong interaction with the Galactic halo gas.
1 INTRODUCTION
The halo planetary nebula (PN, plural PNe) IRAS 18333−2357 is located in the metal-poor ([Fe/H] = −1.7; Lee, Demarque & Zinn 1994) globular cluster M22 (NGC 6656) and was originally discovered as a strong far-infrared source by the IRAS satellite (Gillett et al. 1986). M22 is one of the nearest and third brightest globular star clusters in the sky. It is located in Sagittarius with an angular diameter of about 32 arcmin and a core diameter of 2.66 arcmin (Hartwick, Cowley & Grindlay 1982). The cluster is 12 Gyr old as implied by its main-sequence turn-off mass of 0.83 M⊙ (Sippel & Hurley 2013).
Marino et al. (2011) studied the chemical composition of two metallicity groups of the globular cluster M22. They found substantial star-to-star metallicity scatter with [Fe/H] ranging from −2.0 to −1.6. The stellar groups in M22 are characterized by a different content of neutron capture elements Y, Zr and Ba. More recently, Marino et al. (2012) studied the chemical composition of the double subgiant branch of the globular cluster M22. They found broad spread in ages of the two subgiant branches. Nearly all globular cluster stars exhibit star-to-star variations in light elements mainly C, N, O, Na, Mg and Al (Gratton, Christopher & Eugenio 2004). These anomalous abundances appear to be present in stars of all evolutionary stages.
PNe are very rare objects to see in the globular clusters of our galaxy as the stars are of low mass and they do not evolve fast enough to ionize the ejected envelopes before their dissipation into the interstellar medium (ISM). Only four PNe are detected in approximately 150 globular clusters known in our galaxy (Jacoby et al. 1997). These peculiar PNe are of key importance for the poorly understood evolution of low-mass stars, the post-asymptotic giant branch (post-AGB) evolution at very low metallicity and the evolution of stellar mergers. Further, the enrichment of the ISM by dust is of great importance as dust plays a vital role in many physical and chemical processes in the ISM including the formation of molecular hydrogen (Gould & Salpeter 1963). Earlier studies of globular clusters have demonstrated that dust forms even in an extremely metal poor environment (Evans et al. 2003; Boyer et al. 2006). AGB stars are the main factory of dust production, and the PNe located in globular clusters hence display the nature of the grains ejected into the ISM and replenishment of the ISM within metal-poor stellar systems. IRAS 18333−2357 is one among the four PNe detected in globular clusters, the other three are namely K648 (in M15; Pease 1928), JaFu 2 (in NGC 6441; Jacoby et al. 1997) and JaFu 1 (in Palomar 6; Jacoby et al. 1997). K648, JaFu 1 and JaFu 2 are located in the cores of clusters which are far away from us. They are smaller and fainter than IRAS 18333−2357 which make them difficult to study in detail. IRAS 18333−2357 is located in the core of M22, about 1 arcmin from the centre of the cluster, which has a well-determined distance of 3.1 kpc (Frogel, Cohen & Persson 1983).
M22 is moving with a space velocity of 158 km s−1 with respect to the Galactic Centre (Cudworth 1986, 1990) and has a radial velocity of −153 km s−1 (Webbink 1981). The ram pressure of the Galactic halo gas (halo gas, hereafter) causes a strong asymmetry in the PN morphology (Borkowski, Sarazin & Soker 1990; Borkowski, Tsvetanov & Harrington 1993) stripping the nebular gas away from the star. Strong asymmetry seen in the images of PNe is known to have originated from their interaction with the ISM (Borkowski et al. 1990; Muthu, Anandarao & Pottasch 2000). Such an interaction can decelerate the leading shell of a PN and fragment the shell due to Rayleigh–Taylor instability (Soker, Borkowski & Sarazin 1991).
The most interesting aspect of this PN, apart from its association with the globular cluster M22 and its strong interaction with the halo gas, comes from its peculiar and unique spectrum. Its spectrum shows the absence of H and He emission lines but the presence of [O iii] and [Ne iii] lines (Gillett et al. 1989). Photoionization of H and He or other elements cannot provide the required energy for the free electrons to account for the observed forbidden line fluxes of [O iii] and [N ii] (Gillett et al. 1989). An additional source of energy should indeed be present (Borkowski & Harrington 1991, hereafter BH91). The central star was found to be luminous and was suggested to be an H-deficient and He-rich star with Teff ∼ 50 000 K by Cohen & Gillett (1989, hereafter CG89). Harrington & Paltoglou (1993) obtained optical spectroscopic observations of the central star of IRAS 18333−2357. They showed that its spectrum closely resembles the optical spectrum of the SdO star KS 292. They suggested that the stellar photospheric abundances were enhanced with the products of hydrogen and helium shell burning. However, though KS 292 has an He/H mass ratio of 2 (Rauch et al. 1991), a similar study to determine an He/H mass ratio is lacking for the central star of IRAS 18333−2357. BH91 assumed for their ionization models that the bulk of carbon had condensed into grains but that the oxygen at the earlier molecular epoch would have locked up an equal abundance of carbon in the form of CO, later dissociated to form atomic gas with C/O = 1. However, the dust chemistry of this PN is not yet constrained by observations.
It has been recognized that dust survives inside the ionized gas of a PN, in spite of the harsh radiation environment present in the PN phase. The direct evidence of dust in PNe comes from the large depletion factors of refractory elements which in a dusty plasma should be locked up into the dust grains (Shields 1983) (if not so, the Ca H&K lines and the [Ca ii] lines in the near-IR region should dominate the spectra of PNe). Dopita & Sutherland (2000) presented self-consistent models of PNe by including the effect of dust heating through photoelectric emission and they found a strong influence of dust on the thermal structure and the emission line spectra of PNe.
BH91 carried out a detailed dust emission model of IRAS 18333−2357 using IRAS fluxes at its four far-IR bands. They assumed that the grains have sizes from 0.01 to 0.30 μm and derived the total dust mass in the PN to be ∼8.3 × 10⁻⁴ M⊙. They further claimed that photoelectric emission from the dust grains heats the nebular gas to a temperature of ∼104K , and accounts for the [O iii] and [N ii] line fluxes. We extend the study of BH91 using 1D radiative transfer modelling of the spectral energy distribution (SED) of IRAS 18333−2357, extending the wavelength baseline of the SED in the far-IR to 160 μm and in the shorter wavelength down to the UV. The large wavelength baseline gives us a possibility of better deriving the nebular and the central star parameters. We further study the nature of the very small grains (VSGs) and their influence on the nebular optical spectrum. We also show the presence of cold dust in the context of the nebular interaction with the halo gas. From these results, together with the findings from the literature on the central star, we discuss the evolutionary nature of IRAS 18333−2357 and propose a possible origin of this PN within the framework of existing stellar evolutionary models.
2 SED OF IRAS 18333−2357
The SED of IRAS 18333−2357 was constructed from the UV to the far-IR wavelength region using archival data. The UV data were from International Ultraviolet Explorer (IUE) SWP and LWP and Hubble Space Telescope (HST) GHRS observations, both are available at the Mikulski Archive for Space Telescopes1 (MAST). The optical and the near-IR fluxes were calculated from the magnitudes at respective wavelengths which were obtained from the Deep Near Infrared Survey (DENIS; Epchtein et al. 1994) and the Two Micron All Sky Survey (2MASS; Cutri et al. 2003) archive and from Gillett et al. (1989). A Spitzer IRS spectrum at long low (LL, with wavelength coverage from 5.13 to 14.29 μm) and short low (SL, with wavelength coverage from 13.9 to 39.9 μm) modules was obtained from the Spitzer Heritage Archive.2Infrared Space Observatory data available in the archive are all noisy for this object; hence, they are not included in our study. InfraRed Astronomical Satellite (IRAS; Naugebauer et al. 1984) fluxes at 12, 25, 60 and 100 μm and Wide-field Infrared Survey Explorer (WISE; Wright et al. 2010; Cutri et al. 2012) fluxes at 3.4, 4.6, 12 and 22 μm were used to span the mid- and far-IR emission. In addition, we have used the archived fluxes from Akari (Ishihara et al. 2010) at its 18, 65, 90, 140 and 160 μm bands to trace the emission from cold dust down to temperatures of 20 K. The DENIS, 2MASS and Akari data used for this study are available at the NASA/IPAC Infrared Science Archive.3
The colour-correction factor for the WISEW4 band is close to unity for a wide range of power-law SEDs. Hence, the Spitzer LL-module spectrum was calibrated using convolution of this spectrum with the photometry at this band. The Spitzer SL and the LL modules have a spectral overlap between 13.9 and 14.3 μm, and the SL-module spectrum was multiplied to match the LL-module spectrum at this overlapping region. The IRAS flux ratios F(12 μm)/F(25 μm) and F(25 μm)/F(60 μm) were used to find the spectral power-law exponent in the 12–60 μm region, which is α = −0.3. All the flux measurements at this wavelength region were colour corrected using this power-law exponent. Similarly, using the flux ratios F(90 μm)/F(140 μm) and F(140 μm)/F(160 μm) in the extreme far-IR region, we obtain α = 2.0. The fluxes at 90, 100, 140 and 160 μm bands were colour corrected with this power-law exponent. The colour-corrected fluxes were used to construct the final SED.
2.1 Source confusion and flux contamination
IRAS 18333−2357 is spatially extended for several arcseconds (BH91) near the centre of the cluster and is likely to suffer from flux contamination by other sources in the cluster. Here we examine the contamination at different wavelength regions.
In the UV region: CG89 find that the central star of this PN is the only hot source along the line of sight and there is no substantial contribution to the flux from any other objects in the wavelength region shortwards of 2000 Å. Hence, the only important sources of emission should be the central star and the emission lines from the ionized nebula in the UV region.
In the optical and near-IR region (0.33–3.4 μm): emission from the PN in this wavelength region has contributions from the nebular line emission, by the central star in the optical and by the dust in the near-IR region. From their imaging and spectroscopic studies, Gillett et al. (1989) have shown the presence of an early M star with mV = 14.7 mag which is located 1.3 arcsec north of the central star of the PN. They show that this field star, which is well within the beam sizes of the optical and the IR photometric observations used in our study (Table 1), is the only main source which can contaminate the flux in the optical and near-IR region. Gillett et al. (1989) also found a bluer and fainter star at 8.5 arcsec away from the central star. Flux contamination by this star can occur only for those observations which were taken with large beams. However, such observations are all in the mid- and the far-IR regions, and the blue star gives negligible flux in this wavelength region. Hence, the only star which can contaminate the photometric fluxes at U to I bands is the field star. The beam sizes of DENIS and 2MASS cover the central star of the PN, the field star and some part of the nebula. The major contribution to the fluxes in their bands comes from the field star and some from the nebular dust. The central star contributes very little at these bands. However, in the Kitt Peak National Observatory J, H, K and L bands and in the WISE W1 band, significant dust emission from the PN should contribute to the flux, in addition to the field star. Hence, the only source of flux contamination in the optical and near-IR region is the field star.
In the mid- and far-IR region (4.6–65 μm): IRAS 18333−2357 is known to be the only strong IR source observed by IRAS in M22 (Gillett et al. 1986). A simple blackbody fit to the IRAS fluxes gives a temperature of ∼100 K which is a typical dust colour temperature for a PN. The beam sizes of IRAS, WISE and Akari cover the central star, the field star and the whole nebula. Neither the central star nor the field star can provide significant flux in the mid- and far-IR region and the total flux comes from the nebular dust if the field star, an M star, does not have significant dust in its circumstellar environment. At 12 μm, the WISE images show several objects unresolved by IRAS which contaminate the nebular flux. The LL portion of the Spitzer IRS spectrum covers the entire nebula and the SL portion of the spectrum covers only its central region. The main contribution to the fluxes in both SL and LL modules is the nebular dust. Hence, the contamination at the IRAS 12 μm band and at the WISEW3 band can be estimated from the Spitzer IRS spectrum. The estimated values at these two bands are 23 and 11 per cent, respectively. Hence, the IR emission from warm dust is also not contaminated by other objects in the cluster (except in 12 μm bands), assuming that the field star does not have dust around it.
In the extreme far-IR region (90–160 μm): the fluxes at the 90, 140 and 160 μm bands of Akari and the 100 μm band of IRAS are expected to be contaminated by the cold, foreground ISM dust present along the line of sight and from the background galaxies. The ratio of the (colour-corrected) fluxes at the Akari 160 and 90 μm bands is 0.361, which gives an observed slope of the SED of −0.102 Jy μm−1 at this wavelength region. The diffuse, Galactic ISM dust with a temperature of 19.5 K has an opacity index of 1.6 in the far-IR wavelength region (Li & Draine 2001). This gives a slope of the SED of +0.0147 Jy μm−1 at this wavelength region. This is significantly larger than the observed slope, implying that the extreme far-IR bands of Akari and the IRAS 100 μm band are at the Rayleigh–Jeans limit of the PN dust emission. Hence, in the extreme far-IR bands too, the PN fluxes are unlikely to have contaminated from other sources in the cluster.
Data summary (see the text for details).
| Observatory | Wavelength/ | Flux/ | Flux/ | Beam size | References |
|---|---|---|---|---|---|
| waveband | magnitude | magnitude | (arcsec) | ||
| (observed) | (extinction | ||||
| corrected) | |||||
| HST FOS | 1087–1606 Å | 0.0033–0.0064 Jy | 0.071–0.074 Jy | 1 | MAST |
| IUE SWP | 1150–1978 Å | 0.0022–0.0024 Jy | 0.042–0.032 Jy | 10 × 20 | MAST |
| IUE LWP | 1853–3347 Å | 0.027–0.000 37 Jy | 0.307–0.0018 Jy | 10 × 20 | MAST |
| Palomar | U (N*+S*) | 13.5 ± 0.20 | 11.72 ± 0.20 | 8.5 | Gillett et al. (1989) |
| 1.5 m | (N*) | – | – | – | Gillett et al. (1989) |
| telescope | (S*) | 13.5 ± 0.20 | 12.0 ± 0.20 | – | Gillett et al. (1989) |
| B (N*+S*) | 14.6 ± 0.10 | 13.05 ± 0.10 | 8.5 | Gillett et al. (1989) | |
| (N*) | 16.0 ± 0.10 | 13.4 ± 0.20 | – | Gillett et al. (1989) | |
| (S*) | 14.8 ± 0.10 | 13.5 ± 0.20 | – | Gillett et al. (1989) | |
| g (N*+S*) | 14.0 ± 0.01 | 12.91 ± 0.01 | 8.5 | Gillett et al. (1989) | |
| V (N*) | 14.7 ± 0.20 | 12.9 ± 0.20 | – | Gillett et al. (1989) | |
| (S*) | 14.3 ± 0.20 | 13.3 ± 0.20 | – | Gillett et al. (1989) | |
| 2MASS | J | 10.90 ± 0.03 | 10.67 ± 0.03 | 3.0 | Cutri et al. (2003) |
| H | 10.03 ± 0.03 | 9.89 ± 0.03 | 3.0 | Cutri et al. (2003) | |
| Ks | 9.70 ± 0.02 | 9.62 ± 0.02 | 3.0 | Cutri et al. (2003) | |
| DENIS | I | 12.44 ± 0.02 | 11.99 ± 0.02 | 5.4 | DENIS data base, 2nd Releasea |
| J | 10.93 ± 0.09 | 10.70 ± 0.09 | 5.4 | DENIS data base, 2nd Releasea | |
| K | 9.7 ± 0.13 | 9.7 ± 0.14 | 5.4 | DENIS data base, 2nd Releasea | |
| WISE | 3.4 μm (W1) | 9.15 ± 0.03 | 9.11 ± 0.03 | 7 | Cutri et al. (2012) |
| 4.6 μm (W2) | 8.72 ± 0.02 | 8.7 ± 0.02 | 7 | Cutri et al. (2012) | |
| 12 μm (W3) | 4.45 ± 0.01 | 4.44 ± 0.01 | 7 | Cutri et al. (2012) | |
| 22 μm (W4) | 0.169 ± 0.01 | 0.168 ± 0.01 | 7 | Cutri et al. (2012) | |
| IRAS | 12 μm | 0.7 ± 0.13 Jy | 0.7 ± 0.13 Jy | 12 | Beichman et al. (1988) |
| 25 μm | 8.6 ± 0.68 Jy | 8.61 ± 0.68 Jy | 15 | Beichman et al. (1988) | |
| 60 μm | 21 ± 2.30 Jy | 21 ± 2.30 Jy | 25 | Beichman et al. (1988) | |
| 100 μm | 15 ± 1.50 Jy | 15 ± 1.50 Jy | 60 | Beichman et al. (1988) | |
| Spitzer | |||||
| IRS SL | 5.13–14.29 μm | 0.0007–7.59 Jy | 0.0007–7.61 Jy | 3.7 × 57 | Spitzer IRS Handbookb |
| IRS LL | 13.90–39.90 μm | 5.88–17.14 Jy | 5.89–17.15 Jy | 10.7 × 167 | Spitzer IRS Handbook |
| Akari | 18 μm | 3.55 ± 0.04 Jy | 3.56 ± 0.04 Jy | 10 | Ishihara et al. (2010) |
| 65 μm | 15.0± 0.26 Jy | 15.0 ± 0.26 Jy | 27 | Kawada et al. (2007) | |
| 90 μm | 14.6 ± 0.17 Jy | 14.6 ± 0.17 Jy | 27 | Kawada et al. (2007) | |
| 140 μm | 4.8 ± 0.49 Jy | 4.8 ± 0.49 Jy | 45 | Kawada et al. (2007) | |
| 160 μm | 4.0 ± 0.10 Jy | 4.0 ± 0.10 Jy | 45 | Kawada et al. (2007) |
Table 1 lists the multiwavelength observations and their extinction-corrected values for an interstellar reddening of E(B − V) = 0.32 mag (Alcaino & Liller 1983; Gillett et al. 1989, E(B − V) = 0.53 mag for the field star, see Section 2.2). We have used a wavelength-dependent extinction curve given by Fitzpatrick & Massa (2007) for correcting the ISM extinction. Table 1 also shows the origin of these observations, their beam sizes and the component magnitudes of the field star (N*), and the central star of the PN (S*) as adopted by Gillett et al. (1989). The extinction-corrected component spectra of the PN central star, the nebula and the field star are shown in Figs 1– 3, respectively.
2.2 Dust around the field star
Corrected for the reddening towards M22, the field star has colours (B − V) = 1.6 mag, (J − H) = 0.84 mag and (H − K) = 0.22 mag. The value of (B − V) given by Monaco et al. (2004) is (1.810 ± 0.016) mag. The (H − K) and (J − H) colours indicate that the field star has a spectral type between M0 and M2 (Glass 1999). The intrinsic (B − V) colour of an M0 star is 1.60 mag (Allen 1973), and the observed (B − V) of Monaco et al. (2004) shows an E(B − V) = 0.21 mag. This in turn gives an additional extinction of AV = 0.65 mag for the field star. This additional extinction is contributed both by the Galactic foreground ISM and the PN. The value of additional extinction given by Gillett et al. (1989) is AV = 1.0 mag, which is little larger than our value. The total extinction for the field star is hence AV = 1.65 mag, and the SED of the field star is corrected for reddening using this value (Fig. 3).
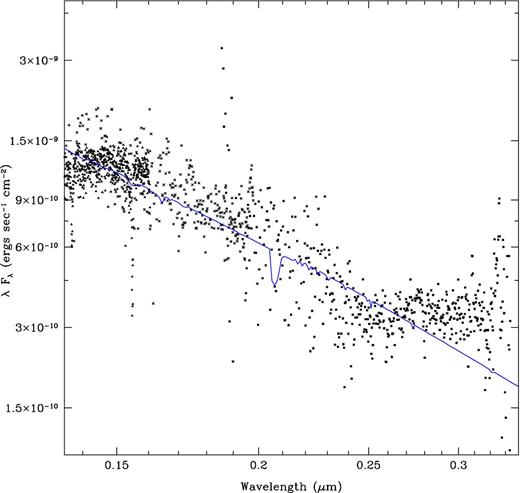
Model atmosphere fit to the extinction-corrected central star data (solid line in blue). The filled triangles denote HST FOS data, the crosses denote IUE SWP data and the filled squares denote IUE LWP data, respectively.
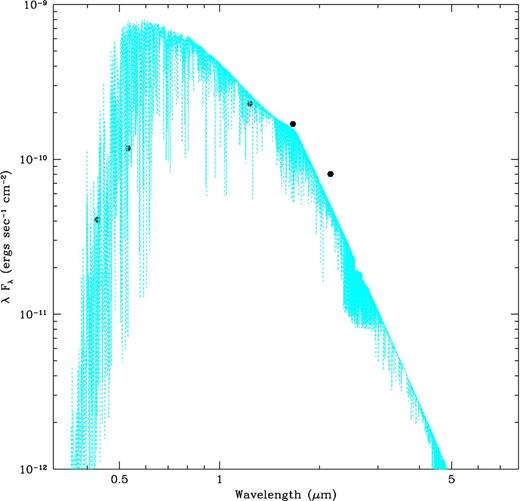
Model atmosphere of an M1 giant (dotted lines in cyan) fitted to the extinction-corrected fluxes (filled hexagons in black) of the field star adopted from Gillett et al. (1989). See the text for details.
The field star is not associated with M22 as indicated by its radial velocity (Gillett et al. 1989) and its metallicity is not known. Assuming it to be solar, a model atmosphere of an M0 giant with Teff = 4000 K and log g = 1.4 was obtained from the nextgen model atmosphere grids for giants (Hauschildt et al. 1999) which fits the observed SED reasonably well. The wavelength-integrated bolometric luminosity of the field star obtained from the model atmosphere flux is ∼50 L⊙ for a distance of 3.1 kpc. The minimum luminosity required for the giants to produce significant amounts of dust is ∼1000 L⊙ (McDonald et al. 2011). To have this luminosity, the field star should be at a distance of 14 kpc, which is very unlikely. Hence, the field star could not have produced sufficient dust to contaminate the nebular fluxes in the mid- and the far-IR regions.
3 RESULTS
3.1 Central star of IRAS 18333−2357
The central star of IRAS 18333−2357 should be hotter than 35 000 K as implied by the presence of C iv lines in the IUE spectrum. The temperature was estimated by CG89 using He ii lines at 4686 and 4542 Å as 55 000 ± 10 000 K. From the IUE SWP and LWP spectra taken during 1988 March to 1989 October, we see a variation in the absorption line strengths and also in the continuum levels of the central star (see Fig. 4). The change in the central star spectrum was noted earlier by CG89 from their IUE SWP and LWP spectra taken during 1988 March and April. However, they suspected that this could arise due to artefacts. The presence of this variability in all the UV spectra, and the observation of the C iv line at 1549 Å in deep absorption in some spectra and its absence in some other spectra together suggest a possible intrinsic variation. This indicates a variation in the temperature and hence in the luminosity of the central star. From our preliminary inspection, we do not see a periodicity and the variability is possibly irregular. However, to our knowledge, no optical variability has been reported in the literature. A detailed analysis of the UV and the optical spectra to derive the properties of the central star and its evolutionary nature using a model atmosphere is not yet available.
3.2 The Spitzer IRS spectrum
We have analysed the Spitzer IRS spectrum of IRAS 18333−2357 to identify the dust emission features, which are superimposed on the continuum emission. The contribution from the field star was subtracted from the IRS spectrum (the field star and the central star contribute little flux to the IRS spectrum; at 5.1 μm the flux contributed by the field star is only 5 per cent, and the flux contributed by the central star is less than 1 per cent). Then the spectrum was used to decompose the dust emission features. To make this decomposition, we used an idl curve-fitting package pahfit which was originally developed by Smith et al. (2007). The model spectrum takes into account the stellar continuum, thermal equilibrium dust continuum and the aromatic infrared emission bands (AIBs). The idl package allows up to eight thermal equilibrium dust continuum components to be modelled. To get the best fit to the continuum level of the IRS spectrum, we have used two components. The warm dust component was fitted with a temperature of 200 K and the cold dust component has a temperature of 90 K. We have adopted a stellar photospheric temperature of 45 000 K.
The spectral decomposition clearly shows many AIBs and the strongest features are seen at 7.7 and 12 μm. In addition, the H2 S5 line and the [Ar iii], [S iv] and [Ne iii] ionic lines are also seen in the IRS spectrum. The central wavelengths and the strengths of these ionic and molecular lines and the dust emission features are shown in Table 2. Identified AIBs are also indicated in this table. There are also spectral features whose identifications were not possible to make and they are indicated as dust feature (DF) with their central wavelengths. The model spectrum obtained from the pahfit program is plotted against the input IRS spectrum in Fig. 5. The model could not fit the IRS spectrum in the 9–10 and 14–16 μm regions well. With the input ionic species, the model fits only the edges of these wavelength regions and the missed flux could be due to some unmodelled dust species. The strengths of the ionic species given in Table 2 should hence be taken with caution. The spectral lines detected in IRAS 18333−2357 are similar to the spectral lines which were detected in the IRS spectrum of three carbon-rich PNe in Large Magellanic Cloud by Woods et al. (2011). The presence of AIBs in the Spitzer IRS spectrum of IRAS 18333−2357 clearly indicates a carbon-rich dust chemistry in the shell, with a C/O ratio greater than unity.
Mid- and far-IR dust emission features of IRAS 18333−2357 seen in the Spitzer IRS spectrum. Power carried by the features and their errors are shown.
| Line | Wavelength | Power |
|---|---|---|
| (μm) | (W m−2) | |
| H2 S(5) | 8.02 | 1.0 × 10⁻¹⁰ (1.05 × 10⁻¹¹) |
| [Ar iii] | 9.03 | 1.2 × 10⁻¹⁰ (5.12 × 10⁻¹²) |
| [S iv] | 10.56 | 1.4 × 10⁻¹¹ (3.8 × 10⁻¹²) |
| [Ne iii] | 15.53 | 3.5 × 10⁻¹⁰ (8.12 × 10⁻¹⁴) |
| AIB | 6.22 | 1.3 × 10⁻¹⁰ (3.25 × 10⁻¹¹) |
| AIB | 6.70 | 3.3 × 10⁻¹⁰ (5.15 × 10⁻¹¹) |
| AIB | 7.42 | 4.7 × 10⁻¹⁰ (7.58 × 10⁻¹¹) |
| AIB | 7.70 | 1.2 × 10−09 (4.52 × 10⁻¹¹) |
| AIB | 8.33 | 4.3 × 10⁻¹⁰ (3.24 × 10⁻¹¹) |
| AIB | 8.61 | 4.2 × 10⁻¹⁰ (2.81 × 10⁻¹¹) |
| AIB | 11.99 | 1.1 × 10−09 (1.46 × 10⁻¹¹) |
| AIB | 12.70 | 3.7 × 10⁻¹¹ (6.72 × 10⁻¹²) |
| AIB | 13.48 | 1.1 × 10⁻⁹ (1.36 × 10⁻¹¹) |
| DF14.0 | 14.04 | 6.0 × 10⁻¹⁰ (1.40 × 10⁻¹¹) |
| DF14.2 | 14.20 | 1.1 × 10⁻⁹ (1.93 × 10⁻¹¹) |
| DF15.9 | 15.90 | 1.1 × 10⁻⁹ (1.53 × 10⁻¹¹) |
| DF17.0 | 17.00 | 10.0 × 10⁻¹⁰ (7.52 × 10⁻¹¹) |
3.3 1D radiative transfer modelling
The one-dimensional radiative transfer code dusty (Nenkova, Ivezic & Elitsur 1999) was used to model the observed SED, assuming a falling radial density profile. The dust envelope has a carbon-rich chemistry (see Section 3.2) and we have calculated models for amorphous carbon and graphite grains. For a given set of input parameters, namely the grain size distribution, an expected dust temperature at the inner shell boundary (Td), an optical depth at 0.55 μm, a relative shell thickness Rout/Rin and an input stellar model spectrum, the model SED was computed. Here Rin and Rout are the radii of the inner and the outer edges of the shell, respectively. For the central star, we have used an appropriate model atmosphere taken from the atlas9 grids of models (Castelli & Kurucz 2003). The values of Teff, log g and [Fe/H] were taken to be 45 000 K, 4.5 and −1.7 (the metallicity of the cluster), respectively, for the model atmosphere. However, a determination of Teff, [Fe/H] and log g for the central star of the PN from spectroscopic observations is not yet available [CG89 and Harrington & Paltoglou (1993) have not derived these photospheric values from their central star spectra]. The photospheric temperature has a possible value between 35 000 and 55 000 K (CG89); hence, we model the SED with a central star temperature of 45 000 ± 10 000 K and report the values of the derived parameters with their corresponding errors.
3.3.1 Model SED of IRAS 18333−2357
For our modelling, we have assumed that the grains follow a modified MRN size distribution function (Mathis, Rumpl & Nordsieck 1977) with amin = 0.007 μm, amax = 0.10 μm and a power-law exponent q = −3.5. Increasing the upper and the lower limits of the grain size gives much less flux in the mid-IR region than the observed. It was suggested that the grain size distribution may deviate from the standard MRN in the circumstellar environment. A deviation from the standard MRN grain size distribution was also invoked to model the SED of the circumstellar dust shell around the post-AGB star IRAS 19500−1709 by Clube & Gledhill (2004). The density follows a 1/r2 function with radius for our modelling. The central star temperature was varied and our model fit to the data shows that the star is quite hot with a temperature of ∼45 000 K (the star is suggested to be hotter than this by CG89). We use the optical constants for amorphous carbon packaged with dusty, which are originally from Hanner (1988). Those for graphite are adopted from Draine & Lee (1984). The model SEDs were then subjected to an interstellar extinction with a wavelength-dependent extinction curve given by Fitzpatrick & Massa (2007) for a value of AV = 1.0 mag [which corresponds to E(B − V) = 0.32 mag]. The model fits the observed SED of IRAS 18333−2357 for the amorphous carbon grains better than the graphite grain model. Both the model SEDs were plotted against the data in Fig. 6 for a comparison. The graphite model underestimates the fluxes in the mid-IR region being nearly 1.5 times fainter than the amorphous carbon model. If we correct this by bringing the inner edge of the dust shell closer to the star, then the far-IR part of the SED does not fit well even for a large shell thickness. Our models hence suggest an amorphous nature of the carbon grains which was also noticed by BH91. The input stellar spectrum for dusty is also shown in Fig. 6.
The amorphous carbon dust model with a 1/r2 radial density profile (Model 1) has the inner shell temperature of 93 K and the optical thickness of the shell at 0.55 μm of 0.29. The ratio of the outer to the inner shell radius is 4.0. The IR part of the SED longwards of 20 μm is well reproduced by dusty, and the UV part of the SED is also fitted reasonably well. However, there is a large discrepancy between the observed and the model SEDs in the optical to the mid-IR regions (3–30 μm). The model fluxes are systematically smaller than the observed values, implying a large amount of excess emission in this wavelength region over the emission level of the thermal equilibrium dust (classical dust) grains considered by dusty.
In order to fit the far-IR fluxes of Akari, Model 1 needs a diameter of the dust shell of ∼40 arcsec (for the bolometric luminosity derived from wavelength-integrated flux, see Section 4.4) which seems to be somewhat large. More importantly, Model 1 does not reproduce the observed mid- and far-IR fluxes which show a relatively flat SED. The observed SED shows a knee around 90 μm which also was not reproduced by Model 1. We attempt to overcome from these problems by considering the interaction of the nebula with the halo gas in our radiative transfer modelling.
3.3.2 Radiative transfer model considering the nebular interaction with the halo gas
The large discrepancy between the observed and the model SEDs in the optical to the mid-IR region is seen also for Model 2. The best-fitting model spectrum was subtracted from the observed spectrum in this wavelength region and is shown in Fig. 8. To check if the M1 giant star (the only field star which can give significant contribution to the emission in this wavelength region) can account for the excess of emission seen in this wavelength region, we have added the nextgen model atmosphere fluxes of the field star (see Section 2.2) to the model-subtracted SED. This fills most of the optical and the near-IR regions, though some residual fluxes are still seen. A simple blackbody fit to the residuals indicates a temperature of ∼3100 K, and this cannot be due to dust. There is an uncertainty on the origin of this flux as the field star parameters are not well constrained. In addition, the nebula also contributes significantly in the H and K bands as seen from the component spectrum of the PN (see Fig. 2). Hence, we remove a fitted 3100 K blackbody for our following analysis. The excess of emission over the thermal dust emission observed in the 5–20 μm wavelength region, on the other hand, cannot be due to the M star or to other faint AGB stars in the field. This discrepancy will be discussed in Section 3.7.
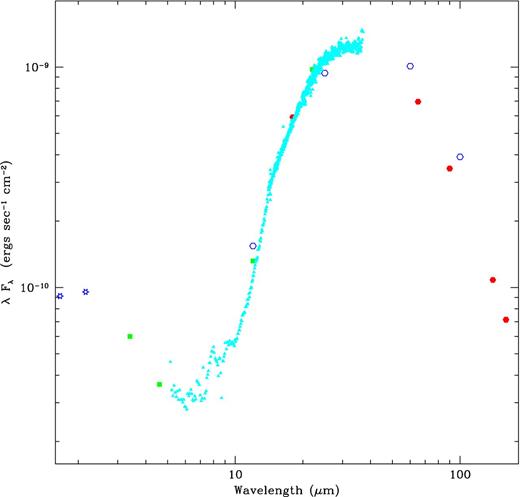
Nebular dust component SED. The open stars in blue denote data from Gillett et al. (1989) after subtracting field star photometry, the filled squares in green denote data from WISE photometry, the filled triangles in cyan represent the Spitzer IRS spectrum, the open hexagons in blue denote IRAS photometry and the filled hexagons in red denote Akari photometry.
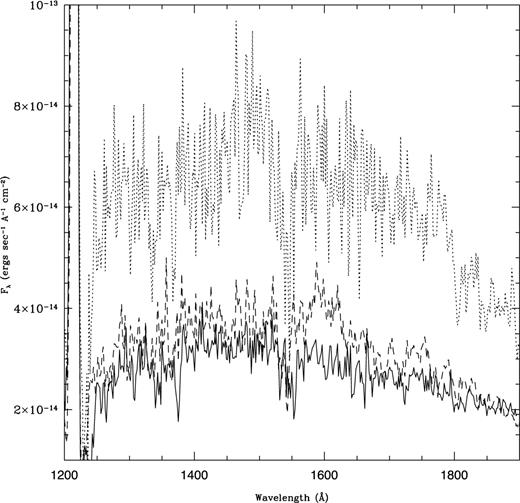
UV (IUE) spectral variability of the central star of IRAS 18333−2357. The C iv line appears in deep absorption in the dotted-line spectrum (SWP 33081) and is nearly absent in the solid-line spectrum (SWP 37288).
pahfit model fit (black solid line) to the Spitzer IRS spectrum after subtracting field star (filled triangles in cyan) of IRAS 18333−2357, showing several prominent PAH features. The central star continuum, although included in the plot, is too weak to be seen. The blue dashed line represents the dust continuum.
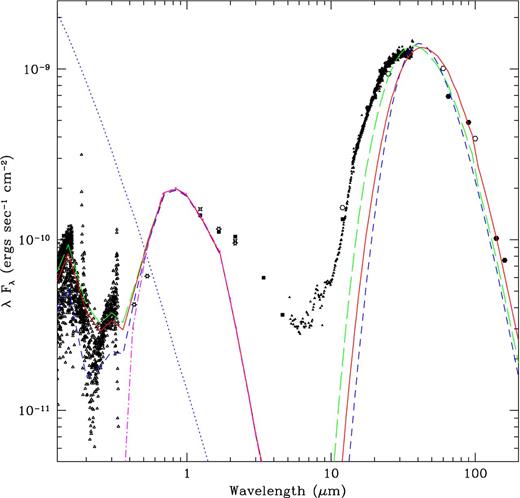
Data description: the diagonal crosses represent HST FOS spectrum, the open triangles represent IUE spectrum, the open stars denote optical and IR photometry from Gillett et al. (1989), the filled stars denote DENIS photometry, the filled squares denote WISE photometry, the filled triangles represent Spitzer IRS spectrum, the open hexagons denote IRAS photometry and the filled hexagons denote Akari photometry. Model SEDs fit to the observed data for (a) 1/r2 radial density profile with amorphous carbon grains (long-dashed line in green) (b) 1/r2 radial density profile with graphite grains (short-dashed line in blue) (c) amorphous carbon model with a modified density function taking the nebular interaction with the halo gas (solid line in red). The modelled central star spectrum is given in dotted lines. A model of the field star spectrum is given (dot–dashed line in magenta). Input stellar spectrum is shown as a dotted line in blue.
3.3.3 Nebular and central star parameters
We have also run dusty in a mode where it derives the density distribution in the dust envelope by considering hydrodynamics coupled with radiative transfer. This offers a possibility of obtaining a historical mass-loss rate, which we derive to be (3.6 ± 1.9) × 10−6 M⊙ yr−1 assuming a gas-to-dust mass ratio of 2.96 (see Section 4.5). Choosing a modified MRN grain size distribution has increased the mass-loss rate by 16 per cent and we adopt this as part of our mass-loss rate uncertainty. From the terminal velocity, we predict a shell expansion velocity of (18 ± 2) km s−1. The inherent uncertainty in estimating the mass-loss rate and terminal velocity by dusty is about 30 per cent. Hence, the derived mass-loss rates and the expansion velocity have their respective values of (3.6 ± 2.24) × 10−6 M⊙ yr−1 and (18 ± 6) km s−1. The mass-loss rate is comparable to the values derived for the M-type stars in the globular cluster ω Cen by Boyer et al. (2008) ( ≳ 10−7 M⊙ yr−1). The model fit to the data and the values of other derived parameters are identical with those obtained from Model 1.
3.4 Very small dust grains in IRAS 18333−2357
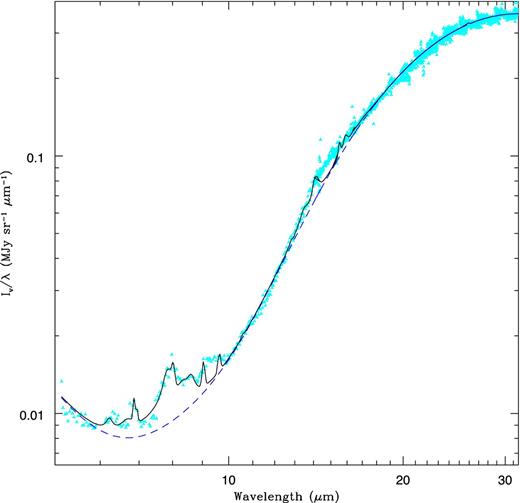
The excess emission over the classical dust emission in the 5–20 μm region could not be fitted by dusty even by considering a lower extension to the grain size in the MRN-like grain size distribution (to the lower end of the input grain size accepted by dusty, 0.005 μm). We find that this emission should arise from a grain population which has sufficiently small grains, and is sufficiently hotter than the classical dust considered by dusty. This excess emission can be attributed to the presence of a VSG population. The VSGs, however, come from the same population and conditions as the classical grains. The presence of VSGs has been seen earlier in circumstellar environments, for example in the PN A30 (Borkowski et al. 1994). They are carbon nanoparticle composites like soot particles with their sizes varying from few nm to 100 nm, depending on the formation mechanism. It is likely that polycyclic aromatic hydrocarbons (PAHs) are the condensation nuclei of such nanoparticles (Tielens 2008). These grains thermally fluctuate by absorbing UV photons from the hot central star. The grain reaches a high temperature after absorbing a UV photon from which it cools down by emitting at longer wavelengths. A simple grey-body model with α = −0.3 (see Section 2 and Fig. 8) fits well to the model-subtracted spectrum in the mid- and the far-IR regions with a grain temperature of (207 ± 5) K. The unmodelled mid-IR emission arises from the statistical behaviour of VSGs, and the temperature of each grain at any given time is described by a probability distribution function (Siebenmorgen, Krügel & Mathis 1992).
3.5 Dust mass
Similarly, the total dust mass of the VSG population can also be estimated. Unlike the classical grains (where all the grains contribute to the total flux and hence the estimated mass will be the total dust mass), the VSG population is statistically heated. Only a small fraction of the grain population will attain the temperature spike at any given time and contribute to the measured flux. Other grains will be at very low temperature and will not emit in the mid-IR region. Hence, the total mass of the VSG population should also include the probability (P) of finding a grain which has undergone a temperature jump to 207 K in the radiation field at any given time. Taking the model-subtracted flux of 2.65 Jy at 18 μm, the dust mass of VSG population estimated from equation (8) is Md,vsg = (3.48 ± 1.49)/P × 10−8 M⊙.
The time interval for two subsequent absorption of a photon with frequency ν is given by tabs = 1/Eν. The value of tabs calculated for absorbing a photon of wavelength 800 Å is 5.18 × 10⁵ s for a grain of size of 12 Å. The grain will cool down after absorbing a photon, assuming that the emission is continuous, by a law |$T_{\rm d}^{-0.4}(t)$| = |$T_{\rm d,p}^{-0.4}$| + βt, where Td, p is the peak temperature and Td(t) is the temperature at a given time t, and the value of β is ∼0.005 (Siebenmorgen et al. 1992). The cooling time is very small when compared to the value of tabs; to cool down to a temperature of 50 K, the time taken by a grain with radius 12 Å is only 15 s. Hence, usually the grain is much closer to the lower temperature limit.
When the grain reaches a temperature of ∼50 K, it will give very negligible emission in the mid-IR region. Hence, the probability of finding a statistical grain to give significant emission in the mid-IR region is 15/tabs = 2.9 × 10⁻⁵. The error in estimating the probability comes from the error in r0/r (30 per cent from our model estimates), in |$F^{\rm 0}_{\lambda }$| (23 per cent, contributed from the error in Teff), in β (∼30 per cent as seen from the work of Siebenmorgen et al. 1992), in the blackbody flux (30 per cent, calculated from the model fit to the VSG emission), in the grain size (8 per cent) and in Qabs(λ) (30 per cent). The probability thus has a value of (2 ± 1.3) × 10−5. Hence, the derived total mass of the VSG population is (1.2 ± 0.73) × 10−3 M⊙. This is larger than the mass of the classical grains. Though this derivation is based on a classical approach and the error associated with this is an approximate value, it indicates that the lower limit on the mass of the VSG population (5 × 10⁻⁴ M⊙) is at least comparable to the mass of the classical grains. The total dust mass in the PN is thus derived to be (1.3 ± 0.91) × 10−3 M⊙. This is larger than the minimum mass of 6.4 × 10⁻⁴ M⊙ given by Gillett et al. (1986) and the dust mass estimated by BH91 (8.3 × 10⁻⁴ M⊙). The fraction of the stellar luminosity that is reprocessed by the classical dust grains is 30 per cent and that by the VSG population is 19.5 per cent. Though the classical dust grains are expected to have their total mass smaller than that of the VSG population, they dominate in reprocessing the stellar flux.
In Table 3, we list the derived values of the dust shell and the central star parameters and we compare them with the values given by BH91.
Dust shell parameters of our proposed model which are compared with BH91 values.
| Parameter | Our value | Value from BH91 |
|---|---|---|
| Grain size | amin = 0.007 μm | amin = 0.01 μm |
| amax = 0.1 μm | amax = 0.25 μm | |
| q = −3.5 | q = −3.5 | |
| avsg = 12 ± 1 Å | – | |
| Shell size (arcsec) | Rin = 3.1 ± 1.21 | Rin = 1.95 |
| Rout = 13 ± 4.52 | Rout = 6 | |
| Grain | Tin = 97 | Tin = 113 |
| Temperature (K) | Tout = 50 | Tout = 67 |
| Tvsg = 207 ± 5 | – | |
| Ld,classical (L⊙) | 510 ± 370 | – |
| Ld,vsg (L⊙) | 330 ± 240 | – |
| Ltotal (L⊙) | 1700 ± 1230 | 3000 |
| Md,classical (M⊙) | (1.4 ± 0.60) × 10−4 | |
| Md,vsg (M⊙) | (1.2 ± 0.73) × 10−3 | – |
| Md,total (M⊙) | (1.3 ± 0.91) × 10−3 | 8.3 × 10⁻⁴ |
| τ.55 μm | 0.29 | 0.22 (average) |
| Teff (K) | 45 000 ± 10 000 | 50 000 |
| log g | 4.6 ± 0.24 | 5.0 |
| M* (M⊙) | 0.55 ± 0.02 | – |
| dM/dt (M⊙ yr−1) | (3.6 ± 2.24) × 10−6 | – |
4 DISCUSSION
4.1 The interaction of IRAS 18333−2357 with the halo gas
CG89 estimated the expansion velocity of the nebula to be 11 km s−1. The nebula is strongly interacting with the halo gas which should significantly decelerate the leading shell. Hence, we present our values of the derived parameters scaled for a typical expansion velocity of a PN, vexp = 20 km s−1. From the radii of the outer and the inner edges of the shell, we find that the mass ejection began about (9000 ± 800) × (20/vexp) yr ago (vexp in km s−1). It had occurred for (6700 ± 800) × (20/vexp) yr until it was terminated (2300 ± 800) × (20/vexp) yr ago. The expansion age derived in our study can be compared with the evolutionary time-scale of an He burning central star with Teff = 45 000 K calculated by Vassiliadis & Wood (1994). For a solar mass star (minimum mass required for a star to become a carbon star) with Z = 0.008, this time-scale is 7500 yr as seen from their table 2 and fig. 8. Taking the nebular and the halo gas electron densities as 10 and 0.03 cm−3, respectively, from BH91, the reverse shock driven into the nebula has a velocity of vshock = 11 km s−1. This is much smaller than the shock velocity required for the destruction of dust (∼50 km s−1; Draine 1995). The direction of the reverse shock is close to the line of sight as implied by the radial and space velocities of the PN. The halo gas impinging on the nebula typically has a temperature of ∼5 × 10⁶ K (Henley et al. 2010). The tenuous nature of the halo gas does not accrete significant mass to the nebula, rather the gas will flow around the nebular shell. This suggests an adiabatic interaction of the PN with the halo gas.
The large space velocity of the PN causes an interaction between it and the halo gas, compressing the leading shell of the nebula significantly and resulting in an apparent asymmetry in the nebular morphology (Borkowski et al. 1993). The interaction manifests the nebular morphology when the nebular density decreased below the critical density (Borkowski et al. 1990). This occurred at a time-scale of tcrit from the time of ejection, which can be estimated from the location of reverse shock. The value of rturn in Model 2 shows that the reverse shock front has travelled a distance of 2.3 × Rin, which is (5.3 ± 1.89) arcsec from the nebular outer edge. This is the thickness of the shocked nebular shell. This in turn shows that the interaction was started about 1.7 × Rin/vshock = (5600 ± 2020) yr ago. Using the age of the outer edge, tcrit ∼ 3400 yr for an expansion velocity of 20 km s−1. The shell stopping time-scale was estimated by Soker et al. (1991) as ∼10 000 yr, which is close to the age of the PN. Hence, we witness the nebula near the end of its journey towards stopping of the leading shell. The half-mass radius of the cluster is 3.36 arcmin (Harris 1996). This implies that the cluster clearing time-scale for the ejected material to dissipate into the halo is ∼1.5 × 20/vexp × 105 yr, roughly 300 times the age of the nebula. For a comparison, the lifetime of dust was estimated to be ∼106 yr in M15 (Boyer et al. 2006) and to be ≤105 yr in ω Centauri (McDonald et al. 2009). An average lifetime of dust in 12 globular clusters was derived to be less than (5–50) × 106 yr by Matsunaga et al. (2008). However, as the nebular shell is not expanding freely due to its interaction with the halo gas, the shell is expected to be dragged and finally will be mixed to the halo. The measured expansion velocity of 11 km s−1 by CG89 could possibly be the expansion of the trailing shell as the leading shell is almost stationary with respect to the central star (i.e. the initial expansion of the nebula is ∼22 km s−1).
The time-scale for the nebula to undergo fragmentation due to significant growth of Rayleigh–Taylor instability can be obtained from equation 8 of Soker et al. (1991). Its value is estimated to be ∼8000 yr, which is close to the age of the PN. Hence, the nebular leading shell might have already been fragmented. The optical images published by Borkowski et al. (1993) show emission knots in the leading shell of the nebula displaying such fragmentation. These are the observational signature on the presence of an adiabatic interaction between the nebula and the halo gas.
4.2 The source of free-electron energy
As photoionization is not the major source of energy input to the nebula (BH91), the source of energy for the free electrons remains unexplained. One possibility is that the strong interaction of the nebula with the halo gas could heat up the nebular shell providing energy to the free electrons. BH91 examined the mechanical luminosity obtained by the nebular–ISM interaction and concluded that it is several times less than the total luminosity of the collisionally excited lines. This indicates the absence of a shock heating. The density jump across the reverse shock is ∼15 times of the nebular density at rturn [using equations (1) and (2) in Section 3.3.2]. This shows that the reverse shock is most likely isothermal rather than adiabatic as for an adiabatic shock the density jump across the shock front cannot be larger than a few. Hence, the shock heating in the leading shell is not effective.
Dopita & Sutherland (2000) show that photoelectric heating plays a significant role in the thermal structure of a PN. They discussed that the efficiency of photoelectric heating depends on the effective area projected by the grains to the stellar UV field. IRAS 18333−2357 is a unique candidate to study the photoelectric heating in PNe as the nebula shows a substantial VSG population in the vicinity of a hot central star. BH91 also had discussed the effect of photoelectric heating in IRAS 18333−2357. If we assume a typical grain size of 12 Å for the VSG population, this can project the required total surface area as seen from the work of Dopita & Sutherland (2000). Grains with sizes down to 12 Å can give an [O iii] electron temperature of ∼3000 K by photoelectric emission as seen from fig. 7 of Dopita & Sutherland (2000). A detailed study on the thermal structure of this PN, taking the values of the VSG parameters given in our study into account, will be very interesting to see.
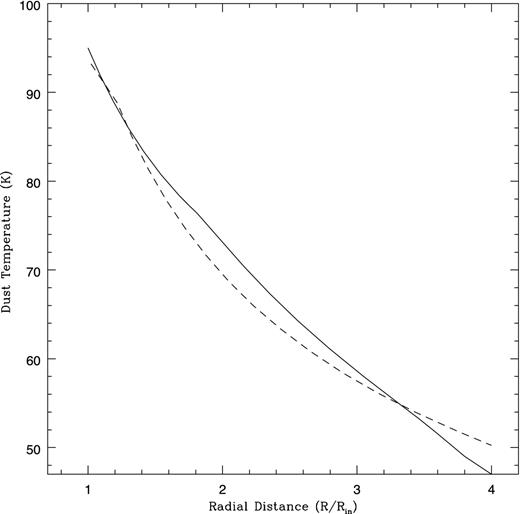
Radial dependence of the dust temperature in IRAS 18333−2357, for Model 1 (dashed line) and for Model 2 (solid line).
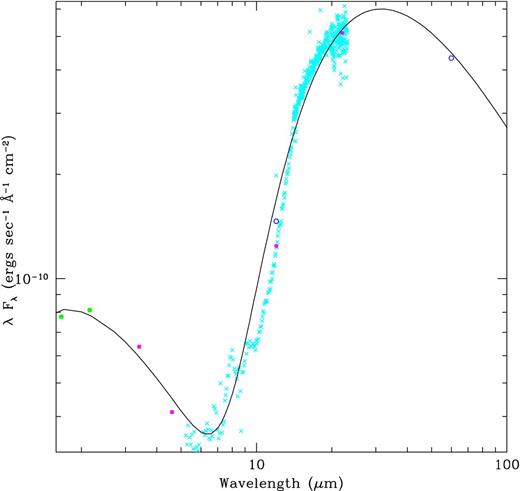
Grey-body model (black solid line) fit to the residual data obtained by subtracting Model 2 from photometry of Gillett et al. (1989) (filled hexagons in green), WISE photometry (filled squares in magenta), Spitzer spectrum (crosses in cyan) and IRAS photometry (open hexagons in blue).
4.3 The evolutionary nature and the origin of IRAS 18333−2357
IRAS 18333−2357 has several unusual properties and there is no other PN which can be directly compared with it in all respects. This provides a difficulty in understanding the origin and the evolutionary status of this nebula. However, here we make a comparison with PNe K648 and A30 which are partly related to IRAS 18333−2357. K648 is located in the globular cluster M15, which has a main-sequence turn-off mass less than 0.8 M⊙ and a metallicity of −2.37 (Bianchi et al. 2001). HST optical narrow-band images at Hα, [O iii] and [N ii] lines showed a double-shelled elliptical nebula (Alves, Bond & Livio 2000). A density enhancement in the north-west edge of the nebula can also be seen in their images which could arise from its interaction with the halo gas. High-resolution nebular spectroscopy showed the presence of high-velocity (60 km s−1) collimated outflows (Tajitsu & Otsuka 2006). The optical spectrum of K648 is quite similar to the optical spectrum of a typical Galactic PN (Bianchi et al. 2001). Rauch, Heber & Werner (2002) analysed the optical spectrum of its central star and claimed that the surface composition of the star could be a mixture of both hydrogen-rich material and the products of helium burning. From their HST and ground-based spectroscopy, Bianchi et al. (2001) derived the nebular and central star parameters of K648. The higher luminosity of K648 indicates a higher mass than expected for M15.
The first direct mass measurements of individual white dwarfs in M4 were made by Kalirai et al. (2009) from which they derived an average mass of (0.53 ± 0.01) M⊙. Hence, PNe are only thought to occur in globular clusters through the evolution of stellar a merger, where the more massive coalesced star is able to evolve faster and ionize its wind. Bianchi et al. (2001) proposed a coalescence mechanism in the early stage of the progenitor evolution for K648 which leads to a total progenitor mass lower than 1.6 M⊙. They further suggested that the star had experienced third dredge-up. For IRAS 18333−2357, its central star mass of 0.55 M⊙ shows an initial mass of 0.82 M⊙ for a metallicity of −1.7 (Marigo 2001). However, the initial mass of a star must be ≳ 1 M⊙ for it to become a carbon star (Marigo & Girardi 2007), and the star must be more massive than is typically found in a globular cluster. The turn-off mass of M22 hence implies a possible binary coalescence scenario on the origin of IRAS 18333−2357, similar to that of K648. However, unlike the case of K648, the C-rich hydrogen-deficient gas in IRAS 18333−2357 also needs to be addressed. An example of a possible C-rich PN progenitor in a globular cluster is Lynga 7 V1 (Sloan et al. 2010; Feast, Menzies & Whitelock 2013). Table 4 compares the nebular and the central star parameters of IRAS 18333−2357 and K648.
A comparison of the nebular and the central star parameters of IRAS 18333−2357, K648 and A30.
| Parameter | M22 PN | M15 PN | A30 |
|---|---|---|---|
| (Bianchi | (Guerrero | ||
| et al. | et al. | ||
| 2001) | 2012) | ||
| Nebular ne (cm−3) | 10 (BH91) | 3020 | 1700 |
| Nebular Te (K) | 10 000 (BH91) | 11 000 | 16 460 |
| Dust-to-gas | 0.3 ± 0.21 (this work) | – | 0.107 |
| mass ratio | |||
| VSG population | Present (this work) | Absent | Present |
| Kinematic age | 9000 yr (this work) | 4200 yr | 820 yr |
| C/O (nebular) | ≳ 1 (this work) | ≳ 22 | 0.3 |
| H abundance | Deficient (Gillett et al. 1989) | Normal | Deficient |
| (nebular) | |||
| C/O (stellar) | ≳ 1 (CG89) | ≳ 1 | 1.33 |
| H abundance | Deficient: (CG89) | Deficient | Deficient |
| (stellar) | |||
| Stellar Teff (K) | 45 000 ± 10 000 (this work) | 35 000 | 115 000 |
| Stellar radius (R⊙) | 0.68 ± 0.22 (this work) | 1.3 | 0.20 |
| log g | 4.6 ± 0.24 (this work) | 4.0 | – |
| log L (L⊙) | 3.23 ± 0.23 (this work) | 3.45 | 3.78 |
A small number of PNe (A30, A58, A78) are known to exhibit clear signature of late thermal pulses which occurred during the post-AGB evolution of their progenitors (born-again post-AGB stars; Iben et al. 1983). A substantial fraction of the intershell region, which is rich in the products of H and He shell burning, will be mixed with the tiny hydrogen envelope due to a late thermal pulse (Iben et al. 1983; Gorny & Tylenda 2000). The central star of a PN which has experienced such a late thermal pulse is expected to have the following characteristics: a hot, hydrogen-deficient stellar atmosphere and a nebula having a large IR excess, a high dust-to-gas mass ratio with highly processed hydrogen-deficient materials in its inner region and a VSG population (Borkowski et al. 1994; Kimeswenger, Kerber & Weinberger 1998; Ercolano et al. 2003). A textbook example of a PN which has these characteristics is A30. From their non-local thermodynamic equilibrium model fit to the optical and the UV spectra, Guerrero et al. (2012) argued that the hydrogen-deficient nebula and the hydrogen-deficient central star of A30 were resulted from the born-again post-AGB scenario triggered by a late thermal pulse. Borkowski et al. (1994) modelled the excess of the near-IR emission over the classical dust emission observed by Dinerstein & Lester (1984) for A30. They attributed this to the presence of a VSG population with a mean radius down to 7 Å. These grains are thermally fluctuating in the radiation field of the hot (Teff ∼ 115 000 K) central star. IRAS 18333−2357 also shows many of the characteristics of the born-again post-AGB evolution. It is very likely that this PN also was formed in a process similar to that of A30, which was suggested earlier by BH91. The nebular and the central star parameters of IRAS 18333−2357 and A30 are compared in Table 4.
The progenitor of IRAS 18333−2357 therefore likely had evolved from a stellar merger. The PN is near the core of the cluster as projected in the sky. If the progenitor was near the core of the cluster, it had a high possibility of encounter with a member star. Some of these encounters may result in stellar collisions. A possible scenario is that the merging of two lower mass stars had occurred during their early stages of evolution (during main-sequence evolution, through common-envelope interaction). A more likely scenario is that the system started as a binary, which was progressively hardened through three-body interaction. The expansion of the primary during its red giant branch would likely to result in a common-envelope system, in which drag forces cause the merging of two stellar cores. Merging resulted a higher mass star which had then evolved in single entity. It ejected the present hydrogen-deficient nebula when the star underwent a late thermal pulse during its post-AGB evolution. Blue stragglers, stars which are present in the extension of the main sequence in a region that is brighter and bluer than the turn-off, were proposed to have formed from stellar mergers (Hills & Day 1976) or mass transfer between two companions in a binary system (McCrea 1964). These blue stragglers are a good candidate for the progenitors of PNe in globular clusters.
The absence of a hydrogen-rich outer shell (which is seen in A30) in IRAS 18333−2357 could be understood in terms of its strong interaction with the halo gas. The interaction stripped off the (old, tenuous) hydrogen-rich material which was ejected during the normal AGB evolution of the progenitor. The time taken for the nebular shell to be swept downstream past the central star by the ram pressure was estimated by Soker et al. (1991) as ∼2 × 10⁴ yr. This is in fact comparable to the time taken for a late thermal pulse (20 000 yr; Blöcker 2001) after the star had ejected its normal hydrogen-rich envelope. It is likely that the stripped-off, highly fragmented hydrogen shell would be moving through the halo gas with the cluster space velocity of ∼200 km s−1, shocking the gas to a temperature of ∼5 × 10⁵ K (Soker et al. 1991). High-resolution imaging observations in the optical and the soft X-ray wavelength regions will be very useful to search for the debris of the fragmented hydrogen shell in the downstream of IRAS 18333−2357.
It should be noted, however, that the photospheric temperature and the chemical composition of the central star of IRAS 18333−2357 are not yet constrained, though it is expected that the star is He rich. The surface temperature is expected to be significantly smaller than the surface temperatures of the central stars of PNe which had descended from born-again post-AGB evolution, (Teff larger than 70 000 K; Zijlstra 2002). Hence, it is also possible that the nebula could have originated from the merging of two evolved stars and ejecting the envelope without experiencing a late thermal pulse. Alves et al. (2000) outlined several possible scenarios through which mass transfer or merger may lead to a luminous PN with a high-mass central star in a globular cluster. They suggest that the progenitor of K648 in M15 experienced mass augmentation in a close-binary merger allowing it to evolve to a remnant of higher mass than those of single stars in M15. The high mass of the central star of IRAS 18333−2357 in M22 also indicates that it may be the result of similar evolutionary path. It should be noted that the luminosity for a central star mass of 0.55 M⊙ is ∼5000 L⊙ (Blocker 1993). This is much higher than the wavelength-integrated luminosity of (1700 ± 1230) L⊙ obtained by us for IRAS 18333−2357.
4.4 Dust-to-gas mass ratio
BH91 estimated the total mass of H and He gas in IRAS 18333−2357 to be 4 × 10⁻³ M⊙. From our derived dust mass of (1.3 ± 0.91) × 10−3 M⊙, the dust-to-gas mass ratio in IRAS 18333−2357 is 0.3 ± 0.21. This is roughly 50 times larger than the typical value found in PNe, ∼0.005. The dust mass of the H-poor, late thermal pulse ejection in A30 was estimated to be 0.002 M⊙ by Borkowski et al. (1994). This ejecta had a mass-loss rate of 10−6–10−5 M⊙ yr−1 which had occurred for about 850 yr (Guerrero et al. 2012). Hence, the total mass lost by the born-again AGB wind is about 8.5 × 10⁻⁴–8.5 × 10⁻³ M⊙ for A30. The H-poor knots of A30 will have a corresponding dust-to-gas mass ratio of 0.23–2. The gas and dust masses of the H-poor ejecta of A30 compare well with their respective values of IRAS 18333−2357. This again strengthens the born-again AGB scenario proposed for the formation of IRAS 18333−2357. Highly processed material in the stellar wind enhances the dust formation in born-again AGB stars and the envelope has a larger amount of dust than the normal PN (Borkowski et al. 1994). For a mass-loss rate of (3.6 ± 2.24) × 10−6 M⊙ yr−1 (see Section 3.3.3), the duration of mass ejection ∼12 200 yr (estimated from Rout, Rin and vexp = 11 km s−1) gives a total mass of ∼0.03 M⊙ for the nebula. This is about three times larger than the estimated upper limit for the nebular mass by BH91 (10−2 M⊙). Hence, vexp should be significantly larger than 11 km s−1.
4.5 Dust shell chemistry
Stellar models and chemical yields of AGB stars computed by Karakas & Lattanzio (2007) show that in low-metallicity environment, the lifetimes are too short for the star to experience significant third dredge-up to enhance carbon and hence they mostly remain oxygen rich. However, since the discovery of a carbon star in ω Cen by Harding (1962), several such stars in globular clusters have been discovered. Sloan et al. (2010) reported that the Spitzer mid-IR spectrum of the Mira variable discovered by Matsunaga (2006) in the globular cluster Lynga 1 shows it to be a carbon star. A lack of silicate DF has been reported in the IRS spectra of metal-poor globular clusters by McDonald et al. (2011). Spitzer IRS spectrum of IRAS 18333−2357 shows clearly the presence of AIBs and the absence of silicate features, implying a carbon-rich environment. Feast et al. (2013) discussed that the carbon-rich Mira in Lynga 1 was resulted from a stellar merger. Most globular cluster carbon stars are mass-transfer systems as discussed in Section 4.3. IRAS 18333−2357 and carbon stars in ω Cen are more special than the other sources mentioned as they are associated with globular clusters with very low metallicity. It is also interesting to note that the modelled sizes of the classical grains are smaller than the typical grains seen in the ISM. Systems like IRAS 18333−2357, Lynga 7 V1 and other carbon stars in globular clusters can constrain the properties of binary stellar evolution in the low-metallicity environment.
To test our proposed evolutionary nature and the origin of this PN, it is important to get the following new observations: (1) high-resolution spectroscopy of the central star to derive its surface abundances, the temperature and surface gravity in order to accurately determine the central star mass which in turn will fix its evolutionary nature, (2) high-resolution imaging in the near- and the mid-IR regions to find the distribution of VSGs and cold dust (the mid-IR instrument of the James Webb Space Telescope will be an ideal instrument for this study), and (3) imaging of the trailing region in the optical and the soft X-ray regions to find the debris of the old, fragmented hydrogen-rich shell.
5 CONCLUSIONS
1D radiative transfer modelling of the SED of the dusty PN IRAS 18333−2357 in globular cluster M22 was carried out. The SED was constructed from the optical to the far-IR observations taken from the archival data. We have also used the mid- and far-IR observations of Akari. An analysis of the Spitzer IRS spectrum shows the presence of AIBs indicating a carbon-rich dust shell. Our radiative transfer model with amorphous carbon dust grains fits the SED better than the model with graphite grains. The central star is quite hot with a photospheric temperature of ∼45 000 K. Our study shows that the dust envelope is more extended than was anticipated earlier. Wavelength-integrated flux gives a luminosity of (1700 ± 1250) L⊙. For this luminosity, the outer radius of the dust envelope is derived to be (13 ± 4.52) arcsec and the inner shell radius is (3.1 ± 1.21) arcsec. The modelled dust shell diameter of 26 arcsec is significantly larger than the optical size of the nebula, 10 × 7 arcsec2. The outer shell radius corresponds to a kinematic age of (9000 ± 800) × 20/vexp(km s−1) yr. Our study also shows that the nebular interaction with the halo gas should be taken into account while modelling the SED.
A large excess of emission in the mid-IR region in addition to the classical dust emission is attributed to a VSG population with a mean size of (12 ± 1) Å which can attain a peak temperature of (207 ± 5) K. It is argued that the reverse shock driven into the nebula by the halo gas cannot be the source of free-electron energy. The VSG population could cause photoelectric heating of the nebula and possibly account for the observed fluxes of the collisionally excited lines in the hydrogen-deficient nebula. The dust mass is derived to be (1.4 ± 0.60) × 10−4 M⊙ for the classical dust grains and (1.2 ± 0.73) × 10−3 M⊙ for the VSG population. The dust-to-gas mass ratio is found to be very high with a value of 0.3 ± 0.21. The progenitor of IRAS 18333−2357 might have evolved from an early stellar merger. The present hydrogen-deficient nebula was resulted from a late thermal pulse occurred in the progenitor when it was evolving through its post-AGB phase. The nebula has been decelerated significantly and its leading shell should be almost stationary with respect to the central star. It also has undergone fragmentation due to significant growth of Rayleigh–Taylor instability. The hydrogen-rich material ejected by the progenitor during its normal AGB evolution was stripped off by its strong interaction with the halo gas. High-resolution imaging of the nebula in the optical to the mid-IR regions and high-resolution optical spectroscopy of the central star will be essential to test the proposed evolutionary nature and the origin of the nebula.
MP is thankful to Professor Ajit K Kembhavi, Professor Kandaswamy Subramanian and Professor T. Padmanabhan for their kind encouragement, support and hospitality. This research has made use of the SIMBAD data base, operated at CDS, Strasbourg, France. Some of the data presented in this paper were obtained from the Multimission Archive at the Space Telescope Science Institute. STScI is operated by the Association of Universities for Research in Astronomy, Inc., under NASA contract NAS5-26555. Support for MAST for non-HST data is provided by the NASA Office of Space Science via grant NAG5-7584 and by other grants and contracts. This publication makes use of data products from the Two Micron All Sky Survey, which is a joint project of the University of Massachusetts and the Infrared Processing and Analysis Centre, funded by the National Aeronautics and Space Administration and the National Science Foundation. The DENIS project has been partly funded by the SCIENCE and the HCM plans of the European Commission under grants CT920791 and CT940627. It is supported by INSU, MEN and CNRS in France, by the State of Baden-Württemberg in Germany, by DGICYT in Spain, by CNR in Italy, by FFwFBWF in Austria, by FAPESP in Brazil, by OTKA grants F-4239 and F-013990 in Hungary, and by the ESO C&EE grant A-04-046. This work is based in part on observations made with Spitzer Space Telescope, obtained from the NASA/IPAC Infrared Science Archive, both of which are operated by the Jet Propulsion Laboratory, California Institute of Technology, under contract with the National Aeronautics and Space Administration. We are indebted to the referee for his/her valuable comments and suggestions which have greatly improved the manuscript.
