


Abstract
Very Large Array deep radio images at 1.4 GHz in total intensity and polarization reveal a diffuse non-thermal source in the interacting clusters A3411–A3412. Moreover, a small-size low-power radio halo at the centre of the merging cluster A3411 is found. We present here new optical and X-ray data and discuss the nature and properties of the diffuse non-thermal source. We suggest that the giant diffuse radio source is related to the presence of a large-scale filamentary structure and to multiple mergers in the A3411–A3412 complex.
1 INTRODUCTION
Clusters of galaxies are characterized by X-ray emission from a hot intracluster medium (ICM, T ∼ 2–10 keV). Thermal emission is a common property of all clusters of galaxies and has been detected even in poor groups as well as in optical filaments connecting rich clusters.
In some clusters, the ICM is also characterized by non-thermal diffuse emission: giant radio sources with a spatial extent similar to that of the hot ICM, which are called radio haloes or relics, according to their morphology and location in the cluster (see Feretti et al. 2012 for a recent review). These sources are not directly associated with the activity of individual galaxies and are related to physical properties of the whole cluster. In a few cases a diffuse non-thermal emission is also found in filamentary structures (see e.g. Giovannini et al. 2010), and in A399 and A401, we found two radio haloes in two interacting clusters (Murgia et al. 2010).
In the last few years, our knowledge of the non-thermal emission in galaxy clusters and the properties of large-scale magnetic fields largely increased, thanks to the discoveries of new halo and relic sources, and the large development in simulations and theoretical models (see e.g. Bonafede et al. 2012; Feretti et al. 2012; Van Weeren et al. 2012; Donnert et al. 2013; Govoni et al. 2013; Venturi et al. 2013).
There is substantial evidence that radio haloes are found in clusters showing significant substructures in X-ray images and complex gas temperature distributions, both signatures of cluster mergers (e.g. Feretti 1999; Govoni et al. 2004; Giovannini et al. 2009; Cassano et al. 2010; Feretti et al. 2012). The monochromatic radio power of a halo at 1.4 GHz correlates with the cluster X-ray luminosity, mass and temperature (e.g. Feretti 2002; Brunetti et al. 2007; Giovannini et al. 2009), implying a direct connection between the radio and X-ray plasmas (Govoni et al. 2001; Feretti 2002).
In addition, diffuse radio sources classified as radio relics are detected in cluster peripheral regions (see e.g. Giovannini & Feretti 2004; Van Weeren et al. 2011; Feretti et al. 2012). Observations of relics provide the best indication for the presence of magnetic fields and relativistic particles in cluster outskirts. Relic sources are strongly polarized (∼20–30 per cent) and typically show an elongated radio structure, with the major axis roughly perpendicular to the direction of the cluster centre. When observed with high angular resolution, they generally show an asymmetric transverse profile, with a sharp edge usually on the side towards the cluster's outer edge. These morphologies are in very good agreement with models predicting that these sources are related to large-scale shocks generated during cluster merger events (see e.g. Brüggen, van Weeren & Röttgering 2011). However, Ogrean et al. 2013, discussing the Toothbrush cluster, found several difficulties in this interpretation. Moreover, we note the existence of relic sources with roundish structures, classified in Feretti et al. 2012, whose morphology is quite different from that expected if they were originated by shock waves.
In a few cases, non-thermal emissions have been detected in structures connecting merging clusters (filaments), see e.g. the filament surrounding the cluster ZW2341.1+0000 (Bagchi et al. 2002 and Giovannini et al. 2010) and the bridge of radio emission extending about 1 Mpc in size, connecting the central halo Coma C and the peripheral relic source 1253+275 in the Coma cluster (Kim et al. 1989). The orientation of this feature is, suggestively, aligned with the direction to A1367 (see also Brown & Rudnick 2011).
Recently, Van Weeren et al. (2013) presented the detection of a new halo source located at the centre of the cluster A3411 and a complex region of diffuse, polarized emission found in the southeastern outskirts of A3411, along the projected merger axis of the system. They classify this region as a peculiar 1.9 Mpc-scale radio relic.
Here, we present new optical results on this complex region and the large-scale X-ray image from archive ROSAT data, both showing that A3411 and A3412 are two interacting clusters in a large-scale filament. These data compared with the high- and low-resolution polarized Very Large Array images, show that the giant diffuse radio source is likely related to the filamentary structure and to the presence of multiple mergers in the A3411–A3412 complex.
The intrinsic parameters quoted in this paper are computed for a Λ cold dark matter cosmology with H0 = 71 km s−1 Mpc−1, Ωm = 0.27 and ΩΛ = 0.73. At z = 0.1687, the luminosity distance is 803 Mpc and the angular conversion factor is 2.85 kpc arcsec−1.
2 OPTICAL DATA
A3411 and A3412 are on the galactic plane; therefore, available X-ray and optical information is poor. The cluster centres as reported in the NASA/IPAC Extragalactic Database (NED) are: RA |$08^{\rm h}41^{\rm m}47{{^{\mathrm{s}}_{.}}}7$| and Dec. −17° 28′ 46′′ for A3411, and RA |$08^{\rm h}42^{\rm m}05{{^{\mathrm{s}}_{.}}}6$| and Dec. −17° 35′ 47′′ for A3412.
For A3411 (see also Van Weeren et al. 2013), a redshift = 0.1687 is reported (Ebeling, Mullis & Brent Tully 2002), and the 6dF Galaxy Survey (Jones et al. 2009) lists a 2MASS galaxy at z = 0.162 569, very close to the A3411 centre (see Fig. 1). No redshift is reported for A3412.
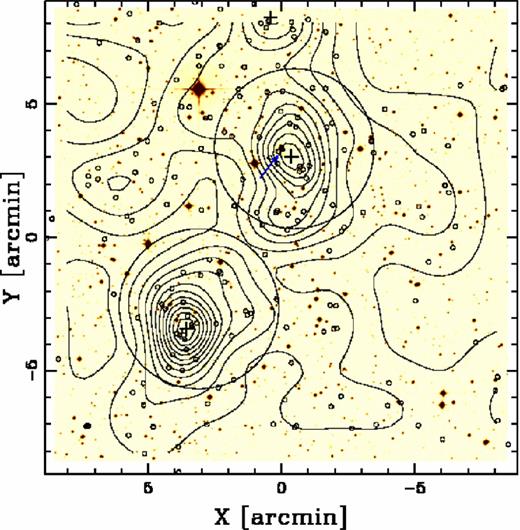
Digitized Sky Survey (DSS) spatial distribution on the sky of likely cluster members – very small circles – and relative isodensity contour map are superimposed on the DSS2-red image. The levels are 0.25, 0.50, 0.75, …, 3.00 gals arcmin− 2. The centre and the size (∼3 Mpc) correspond to those of Fig. 2 for an easy comparison. The large circles indicate the 3 arcmin radius regions around A3411 (northern structure) and A3412 (southern structure) centred on the X-ray peaks as listed in the text. The crosses highlight the positions of the peaks in the galaxy distribution as detected in our 2D DEDICA analysis. The arrow near to the A3411 centre indicates the galaxy with known redshift listed in the 6dF Galaxy Survey, very close to a star.
The distance between the two cluster centres is ∼8.2 arcmin corresponding to ∼1.4 Mpc assuming the redshift of A3411.
To analyse the structure of the A3411–A3412 complex, we constructed a photometric catalogue in a large region of 30 arcmin radius around the A3411 centre extracting the objects classified as ‘galaxies’, and having both Bj and R magnitudes available and having R < 20 mag from the SSA (SuperCOSMOS Science Archive).1 In this photometric catalogue, we selected ‘likely cluster members’ on the basis of the colour–magnitude relation (hereafter CMR), which indicates the early-type galaxy locus. We considered galaxies having observed colours within 0.4 mag from Bj − R = 1.2, where 1.2 is roughly the expected colour for the CMR galaxies (considering typical B − R values at z = 0.17 in López-Cruz, Barkhouse & Yee 2004, opportune magnitude conversions and Galactic absorption). Note that we prefer to rely on the expected CMR relation and a quite large colour range since galaxy colours (and star/galaxy separation too) are expected to have large uncertainties in the A3411 region.
Fig. 1 shows a zoomed region of the contour map for the likely members (860 galaxies within the whole ∼30 arcmin region) as obtained through to the 2D adaptive-kernel method (2D DEDICA; Pisani 1996). The two densest peaks in the galaxy distribution correspond to A3411 and A3412, nominally A3412 being even denser than A3411. A third significant, but much less dense, peak lies at north at the limit of the plot we show. The three density peaks are significant at the >99.99 per cent CL and Table 1 lists relevant information: the number of assigned members, NS (Column 2), the peak position (Column 3), the density (relative to the densest peak), ρS (Column 4) and the value of χ2 for each peak, |$\chi ^2_{\rm S}$| (Column 5).
2D DEDICA optical structure.
| Subclump | NS | α(J2000), δ(J2000) | ρS | |$\chi ^2_{\rm S}$| |
|---|---|---|---|---|
| |$(\mathrm{^{h\,m\,s})\ \ \ \ \ \ \ \ \ \ \ \ \ (\mathrm{^\circ }\,{^\prime }\,{^{\prime \prime }}})$| | ||||
| A3412 | 49 | 08 42 08.0−17 34 45 | 1.00 | 21 |
| A3411 | 34 | 08 41 51.4−17 28 18 | 0.83 | 16 |
| Northern peak | 50 | 08 41 54.7−17 23 05 | 0.55 | 12 |
To obtain more reliable positions and relative densities, we stress the need of better quality images covering the whole cluster complex in 2 mag bands in a homogeneous way, while to date available, more recent images do not have both the advantages.
The relatively small distance between A3411 and A3412, and the presence of galaxies in the connecting region suggest that they are two interacting clusters. Van Weeren et al. (2013) classify the central galaxy in A3411 as a cD galaxy from a Very Large Telescope (VLT) FOcal Reducer and low dispersion Spectrograph (FORS1) image of the central part of the cluster.
3 X-RAY DATA
In Fig. 2, the ROSAT image obtained from archive data (observation request 801009) of this region is shown in colour. The image shows an extended complex emission with three aligned major clumps.
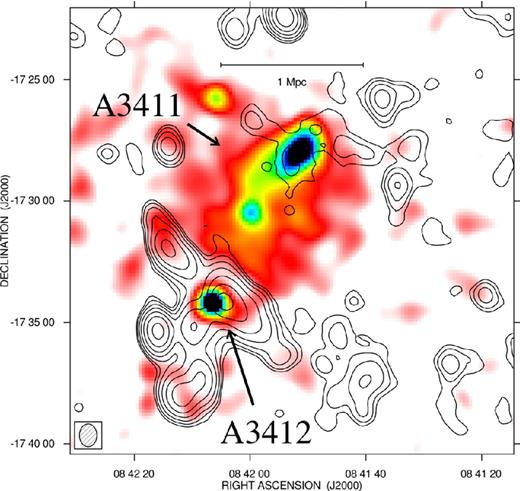
Radio X-ray overlay of the A3411–A3412 region. The contours show the radio source at 1.4 GHz. The Halph Power Beam Width (HPBW) is 56.3 arcsec × 43.1 arcsec (PA −17°). The levels are 0.12, 0.24, 0.48, … mJy beam−1. The noise level is 0.04 mJy beam−1. In colour, the X-ray image from archive ROSAT data is shown.
We estimated the X-ray luminosity of the whole region, from the ROSAT All Sky Survey data, by considering a weighted averaged total Galactic H i column density 4.67 × 1020 cm−2 from the Leiden/Argentine/Bonn Survey (Kalberla et al. 2005), an APEC model with kT = 5 keV and metallicity 0.4 Z⊙. We measured in the 0.1–2.4 keV band a total X-ray luminosity of ∼5.3 × 1044 erg s−1, over a region of ∼ 13 arcmin, centred at the location of the less-bright X-ray peak and including all the three clumps. This value is slightly higher, but in agreement within the errors with the value published in Ebeling et al. (2002).
In more detail, we note that the X-ray image shows an extended emission with a peak near to the A3411 optical position: RA 08h41m51s and Dec. −17° 28′ 00′′. We assume this as the A3411 cluster centre. The X-ray emission is extended in the S direction and a secondary peak is present at RA 08h42m00s and Dec. −17° 30′ 30′′. For the A3411 structure, a total X-ray luminosity of ∼5.0 × 1044 erg s−1 is measured over a region of ∼ 7.5 arcmin. From the X-ray data, we conclude that A3411 is a bright X-ray cluster in a merging phase.
At RA 08h 42m 06s and Dec. −17° 34′ 00′′, one more bright X-ray emission is present, slightly extended to SW. This compact structure has an X-ray luminosity of ∼3.2 × 1043 erg s−1 over a region of ∼ 4 arcmin in size. Because of its position, we identify this X-ray emission with A3412, even if its compactness could suggest the identification of the X-ray structure with a discrete source (e.g. a radio galaxy; see Section 4.1). We note that A3412 is aligned with the very elongated X-ray structure of A3411 and that the X-ray emission is in good agreement with the optical galaxy distribution.
We compared the ROSAT X-ray data with the Chandra X-ray image of A3411 published by Van Weeren et al. (2013, their fig. 1). Both images confirm the evidence that A3411 is a cluster in a merging phase. The high-resolution Chandra image by Van Weeren et al. (2013, their fig. 1, right) shows the inner disturbed region of A3411. The secondary peak in between A3411 and A3412, present at ∼6.5σ level in the ROSAT All Sky Survey data, is marginally visible being at the bottom-left corner.
In the ROSAT image, one more peak of emission is present at the NE of A3411 at the ∼4.7σ level. No radio emission is present from this region and no optical condensation was found. With the present data, we cannot confirm if it is one more substructure related to A3411 or if it is an unrelated discrete source. This structure is outside the fig. 1 (right) in Van Weeren et al. (2013). We note that the whole X-ray structure (including secondary peaks) is present both in the X-ray image derived from the ROSAT All Sky Survey data and in the image from the ROSAT archive pointed observation: the two independent images are in very good agreement.
4 RADIO DATA
4.1 Full intensity images
A field centred on A3411 was observed at 1.4 GHz in full polarization mode in 2003 October in A/B configuration and in 2004 June in C/D configuration (project AC696). Because of the small angular distance between A3411 and A3412 (∼7 arcmin), both clusters are well imaged with the present data.
Calibration and imaging were performed with the National Radio Astronomy Observatory Astronomical Image Processing System (aips). After the editing of bad points, self-calibration was applied to both data sets to remove residual phase and gain variations. The two data sets were combined together to produce final images. The final good coverage of the uv-plane in the combined data set allowed us to derive images with a low noise level. We obtained images at low angular resolution using the factor ROBUST = 5 in the IMAGR task, at intermediate resolution (15 arcsec, ROBUST = 1) and at high angular resolution (5 arcsec, ROBUST = −5). Final images were corrected for the primary beam attenuation, to properly measure the flux density. Polarized images were obtained combining the Q and U images and correcting for the positive bias, using standard aips tasks.
In Fig. 2, we show the radio image at the angular resolution of 56.3 arcsec × 43.1 arcsec at position angle (PA) 17°, overimposed on to a ROSAT X-ray image (colour) obtained from archive data (Observing request number 801009).
At the position of A3411, coincident with the main peak of the X-ray emission, we confirm (Van Weeren et al. 2013) the presence of a diffuse faint radio source that we interpret as a possible small-size central halo (see Figs 2 and 3). The morphology of this extended source is rather irregular in agreement with the recent finding of irregular low-power radio haloes, discussed in Giovannini et al. (2009). At high resolution, a few contaminating discrete sources are present, subtracted in Fig. 3 (see Section 5.2).
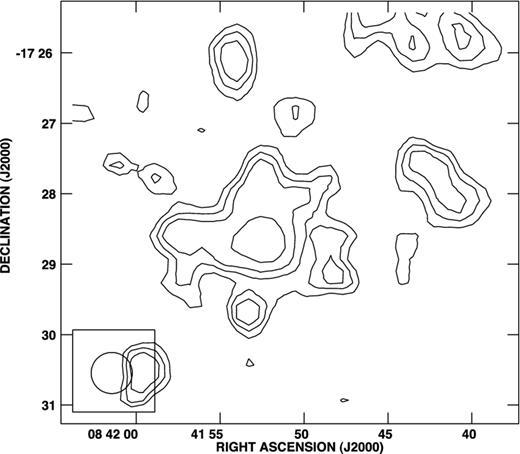
Contour image of the central diffuse radio source identified as a radio halo at the centre of A3411. Discrete sources in the halo region have been subtracted. The HPBW is 35 arcsec. The contours are 0.06, 0.08, 0.10, 0.15, 0.30 and 0.50 mJy beam−1. The noise level is 0.03 mJy beam−1.
Moreover, as discussed by Van Weeren et al. (2013) a remarkable extended diffuse radio source is detected at the peripheral region of A3411. We confirm the presence of this structure crossing the A3412 cluster centre. For a more clear discussion, we separate this extended diffuse, non-thermal source into two substructures: R1, elongated perpendicularly to the A3411 and A3412 filament, and R2, a N–S more elongated structure aligned with the A3411 and A3412 filament, southern to A3412 (see Fig. 4). To the west side of R1 another diffuse, non-thermal source is present with a lower surface brightness (named R1B in Fig. 4), aligned with the brighter structure. Low-resolution images show that these structures are connected and that the diffuse, non-thermal source R1 extends up to ∼RA 08h41m40s and Dec. −17° 37′ 30′′ with a total size ∼1.9 Mpc, in agreement with Van Weeren et al. (2013).
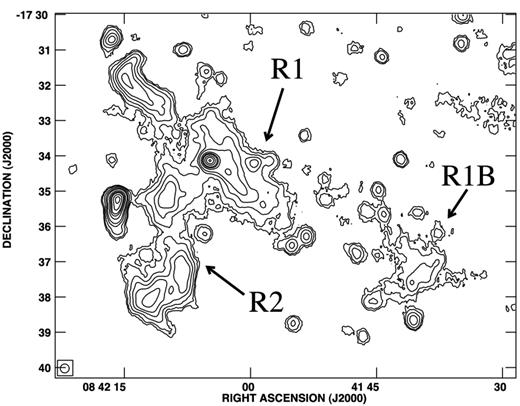
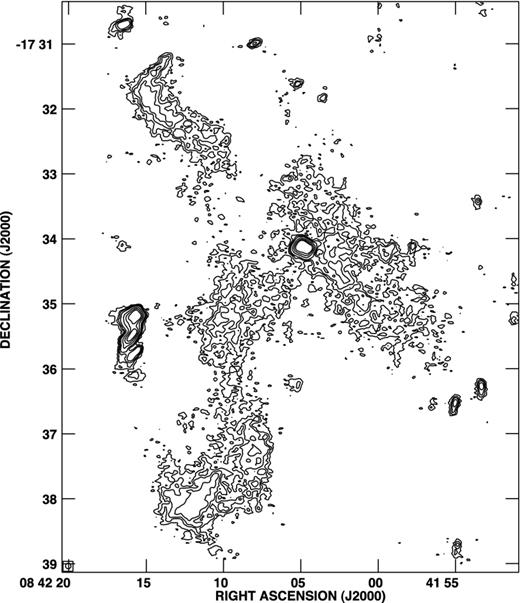
Contour image of the A3411–A3412 region. The HPBW is 15 arcsec. The contours are 0.04, 0.07, 0.15, 0.3, 0.5, 1, 1.5, 2, 3, 4 and 5 mJy beam−1; the noise level is 0.02 mJy beam−1. R1, R1B and R2 refer to the radio structures discussed in the text.
The R2 diffuse structure starts from the A3412 region and extends outwards, in the direction of the A3411–A3412 connecting line (Fig. 4). Its size is ∼860 kpc S to A3412.
Both radio structures if observed at high resolution (Fig. 5) show a uniform brightness distribution with no filamentary substructure typical of relic sources. At this high angular resolution the low-brightness structure R1B to the west side of R1 is completely resolved; for this reason in Fig. 5, we show a smaller field of view.
Contour map of the diffuse emission regions R1 and R2 (see the text). The HPBW is 5 arcsec. The levels are 0.04, 0.07, 0.1, 0.15, 0.3, 0.5 and 0.7 mJy beam−1; the noise level is 0.016 mJy beam−1.
The discrete sources imbedded in the extended radio source are only a few and not relevant: a discrete source is present at the A3412 cluster centre (see Fig. 5). This discrete radio source is located at the X-ray peak emission and we identify it as the brightest cluster galaxy of A3412. This source could be the origin of the compact X-ray emission, we note however that the radio power (see Section 4.3.3) is significantly lower than 3C radio sources with a similar X-ray luminosity (see e.g. Massaro et al. 2013) and significantly lower than that expected from the correlation between X-ray and radio luminosity discussed by Balmaverde, Capetti & Grandi (2006). Therefore, we tentatively identify the X-ray emission present here, with the compact cluster A3412. One more extended discrete radio source is at the periphery of A3412's east side, just outside the diffuse, non-thermal source (Fig. 5). It could be a head–tail or double source according to the optical identification.
A few additional sub-mJy, slightly extended discrete sources are visible. All discrete sources have been subtracted before measuring the radio parameters of the diffuse, non-thermal source.
Van Weeren et al. (2013) distinguish in the diffuse emission five elongated components (see their fig. 3, left), even if they classify this complex as a radio relic. From the comparison of our Figs 4 and 5, we do not find a clear evidence of different subcomponents, but connected regions with a slightly higher and lower brightness, as expected (and found) in many diffuse sources (haloes and relics), correlated to the turbulence and/or shock waves in the hot interstellar medium.
4.2 Polarized emission
The extended diffuse, non-thermal source is strongly polarized. In Fig. 6, we show the total intensity image with superimposed polarization vectors (no correction was applied to their orientation). In this figure, the extreme region at SW (R1B) does not appear since no polarization is detected here.
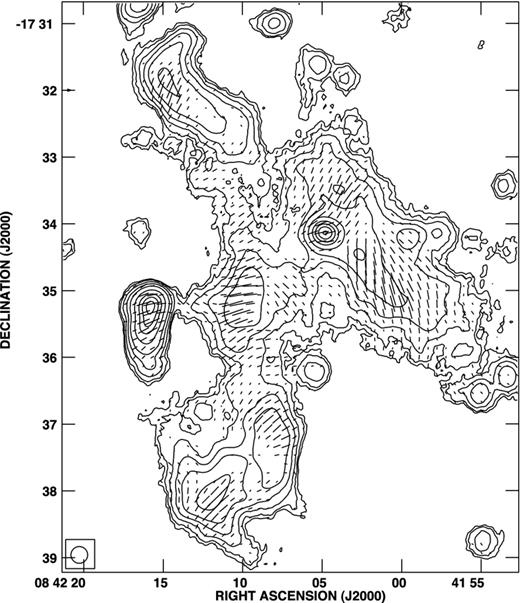
Contour image of the diffuse radio source (total intensity). The HPBW is 15 arcsec; levels are 0.03, 0.05, 0.1, 0.2, 0.4, 1, 2, 3, 4 and 5 mJy beam−1. Overimposed are vectors oriented as the polarization angle, with a length proportional to the polarized intensity: 1 arcsec = 1.25 × 10⁻⁵ Jy beam−1.
The average polarization percentage in R1 = 18 per cent; in the external R1B region, we can give only an upper limit: <12 per cent. The R2 average polarization percentage is 17 per cent. The polarized vectors in R1 are oriented on the average at ∼20° in the SW region and at ∼−25° in the NE region. In R2 vector orientation moves from ∼90° to −45°.
The polarization vectors show no preferential orientation. There are several changes of direction on scales of 1–2 arcmin. This could suggest the presence of significant rotation measure effects, due to a magnetized ICM. Being very distant from the A3411 centre, this ICM has to be related to the presence of A3412.
4.3 Diffuse and discrete source parameters
4.3.1 The R1 and R2 structures
The total flux density of the R1+R2 structure is 67 ± 5 mJy (corresponding to log P = 24.71 W Hz−1), after the subtraction of discrete sources. We note that: (1) the flux density uncertainty is not due to the noise or zero level in the image, but due to the problem to include or not some peripheral regions, (2) the only relevant discrete sources are the ones at the centre of A3412 and the peripheral extended source just outside the region R2. Other discrete sources are sub-mJy sources. We have measured the flux density in images with different angular resolutions and results are consistent. Most of the flux density is in the R1 structure (considering also the R1B structure): 38 mJy (log P = 24.47 W Hz−1), for R2 we measured 28 mJy (log P = 24.34 W Hz−1). The total extension of R1 is ∼11 arcmin corresponding to ∼1.9 Mpc and ∼5 arcmin for R2 corresponding to ∼0.86 Mpc. As expected, these values are in agreement within the uncertainties with Van Weeren et al. (2013).
4.3.2 The halo source in A3411
In low-resolution images a diffuse, non-thermal source is present coincident with the central region of A3411. We identify this emission as a diffuse small-size halo source. The total flux density from this region is ∼5 mJy (in agreement with Van Weeren et al. 2013); however, after an accurate subtraction of unrelated discrete sources selected in the high-resolution image, we estimate a total flux density of the halo source = 1.9 ± 0.3 mJy (corresponding to log P = 23.16 W Hz−1). No polarized flux has been detected in this region. We estimate a size of ∼2.5 arcmin, corresponding to ∼430 kpc (see Fig. 3). This measure is very uncertain the halo brightness being at a few sigma level and affected by confusion. The estimated radio power, halo linear size and X-ray luminosity are in agreement with the X-ray luminosity–radio power and halo linear size–radio power correlations (see Feretti et al. 2012).
4.3.3 The two discrete sources in A3412
The discrete source present at the centre of A3412 shows a double morphology with a total flux density of 8.5 mJy (log P = 23.82 W Hz−1) and a size ∼10 arcsec (∼30 kpc). It is not polarized at a level of <5 per cent.
The second discrete source at the periphery of R2 shows a double or head–tail morphology, with a total flux density = 12.1 mJy (log P = 23.97 W Hz−1) and a size ∼45 arcsec (∼120 kpc). The average polarized flux percentage is ∼7 per cent.
5 DISCUSSION
5.1 The giant diffuse non-thermal source
The non-thermal properties of this region are very complex. Van Weeren et al. (2013) identify the complex diffuse radio emission as a radio relic broken into five fragments suggesting that the shock responsible for the radio emission has been broken up due to interaction with a large-scale galaxy filament connected to A3411 or other substructures.
Observational data presented here suggest that the elongated structure R1 is a diffuse non-thermal source associated with A3411, with many properties similar to relic sources: elongated shape and polarization properties. This interpretation is supported by the presence of a secondary peak in the X-ray emission of A3411 confirming that R1 is located outwards of a merging structure. However, the origin of the extended feature R2 is puzzling. Although the radio properties (elongated shape and polarization) suggest its identification as a relic source too, its extension aligned with the A3411–A3412 structure as visible in the X-ray image requires a more complex dynamical scenario. We remember that most (all) known elongated relics show the major axis roughly perpendicular to the direction of the cluster centres (see e.g. Brüggen et al. 2011).
Some radio properties of these sources are consistent with the properties of the relics (see e.g. Feretti et al. 2012) and in agreement with the known correlations (e.g. radio power versus linear size and radio power versus X-ray luminosity). R1 would be one of the largest relic sources. However, we note that R1 and R2 are diffuse complex radio sources which are clearly connected and thus of similar origin and nature. We also note that, when observed at high resolution, R1 and R2 are diffuse, homogeneous regions with no evidence of substructures. A sharp edge in the brightness distribution, expected if the radio emission is the tracer of shocks in merger events, is not present. Shock waves are expected to accelerate radio emitting electrons, and to amplify and order local magnetic fields. In R1 and R2, we have a highly polarized emission with vectors locally ordered, but changing orientation on scales of 1–2 arcmin.
The morphology and properties of the diffuse, non-thermal source can be explained by the presence of a complex condition with accretion shocks able to accelerate electrons, combined with turbulence in the thermal gas connected to the presence of A3412. The multiple mergers of the A3411–A3412 structures could be the origin of the R1+R2 diffuse source, with R2 oriented along the giant filament merging into A3411. The R2 structure could be powered by accretion shocks as material falls on to the filament, as e.g. suggested by Brown & Rudnick (2011) for the relic present in the Coma cluster. We remember that in the Coma cluster, hosting a radio halo and a relic source, also an Mpc-scale radio bridge connecting the halo to the relic and elongated in the same direction of the giant Coma-A1367 supercluster (Kim et al. 1989) is present.
Alternatively, Van Weeren et al. (2013) suggest that the complex morphology reflects the presence of electrons in fossil radio bubbles that are reaccelerated by a shock. In their fig. 3, five regions are individuated. We think unlikely to this hypothesis because the presence of so many bubbles implies a strong past activity of some radio galaxies that at present should be completely radio quiet. No connection with the present two radio galaxies in A3412 is visible. Moreover, as already discussed, at high resolution the morphology of the giant non-thermal source is very homogeneous with no evidence of shocks, and at high and low resolution the whole structure is connected and likely to have a common origin.
New multifrequency observations to study the spectral index distribution and polarization properties are necessary to properly discuss these structures. The presence of one more optical condensation to the north of A3411 (see Table 1) suggests a possible more-complex structure even if the present data do not show radio or X-ray emission from this region.
5.2 The central halo source in A3411
A diffuse, non-thermal source at the centre of A3411 is present in our images. Despite the large uncertainties previously discussed, we note that in comparison with other radio haloes, the halo in A3411 is one with the lowest radio power. Only the A3562 halo (Venturi et al. 2003) is known so far to show a lower radio power (see Feretti et al. 2012, and references therein).
These two faint radio haloes follow the general correlations between X-ray luminosity, radio power and linear size for the radio haloes (see e.g. Feretti et al. 2012). It is important to increase the statistical information on these low-power radio haloes to discuss if all merging clusters host a central diffuse source (in most cases not visible with present radio telescopes because of sensitivity, see e.g. Xu et al. 2012) or if an unknown critical value of the halo radio power is present.
6 CONCLUSIONS
We have presented here the detection of a complex non-thermal source in the A3411–A3412 structure. This source has been found at the periphery of A3411, where the cluster A3412 is located, aligned with the A3411 merging structure. We suggest that this giant, diffuse and peculiar non-thermal source is related to a filamentary structure and to the presence of multiple mergers. Better optical, radio and X-ray data are necessary to investigate this complex region and to derive its physical properties. A few cases are present in the literature where intergalactic filaments have been firmly detected, and only in the Coma cluster (Kim et al. 1989) and in ZW2341.1+0000 (Bagchi et al. 2002 and Giovannini et al. 2010) a non-thermal emission has been found. To increase the number of these sources it is important to understand the physical conditions required in forming cosmological structures. We expect that the new generation of radio telescopes [Square Kilometre Array (SKA) and SKA-precursors] will increase the detection of these diffuse sources allowing us to extend our knowledge of non-thermal emission from clusters to filaments.
Moreover, we have found that the radio halo at the centre of A3411 has a low power, despite of the large uncertainties related to its low brightness. It is important to increase the number of known low-power radio haloes to confirm whether they follow the general correlation between X-ray luminosity and radio power of Mpc-scale radio haloes or not.
The presence of this source is related to an active merger well evident in the X-ray image. Data from the new generation of radio telescopes are needed to better study low-power radio haloes.
The National Radio Astronomy Observatory is operated by Ass. Univ., Inc., under cooperative agreement with the National Science Foundation. This research has made use of the NASA/IPAC Extragalactic Database which is operated by the Jet Propulsion Laboratory, California Institute of Technology, under contract with the National Aeronautics and Space Administration. We thank the Referee and the Scientific Editor for useful suggestions and comments.
