


Abstract
We obtained Very Large Telescope/FOcal Reducer and low dispersion Spectrograph spectra of the optical counterparts of four high-luminosity (LX ≥ 1040 erg s−1) Ultraluminous X-ray sources (ULX) candidates from the catalogue of Walton et al. We first determined accurate positions for the X-ray sources from archival Chandra observations and identified counterparts in archival optical observations that are sufficiently bright for spectroscopy with an 8 m telescope. From the spectra we determine the redshifts to the optical counterparts and emission line ratios. One of the candidate ULXs, in the spiral galaxy ESO 306−003, appears to be a bona fide ULX in an H ii region. The other three sources, near the elliptical galaxies NGC 533 and NGC 741 and in the ring galaxy AM 0644−741, turn out to be background active galactic nuclei (AGN) with redshifts of 1.85, 0.88 or 1.75 and 1.40, respectively. Our findings confirm the trend of a high probability of finding background AGN for systems with a ratio of log(FX/Fopt) in the range of −1–1.
INTRODUCTION
Ultraluminous X-ray sources (ULXs) are off-nuclear X-ray sources in galaxies with an X-ray luminosity above the Eddington luminosity of a 10 M⊙ black hole (BH), or ∼1039 erg s−1. Several scenarios have been proposed to explain their high luminosities. Geometrical (King et al. 2001) or relativistic (Körding, Falcke & Markoff 2002) beaming may allow for the observation of super-Eddington luminosities. In some sources, there is evidence for a new state with truly super-Eddington accretion rates (Gladstone, Roberts & Done 2009). Recent investigations into the X-ray luminosity function (XLF) of ULXs suggest that the majority of ULXs are formed by the high-luminosity tail of X-ray binaries and contain stellar mass BHs (Swartz et al. 2011; Mineo, Gilfanov & Sunyaev 2012). The best-fitting XLF exhibits a cut-off around 1040 erg s−1, suggesting that this may be the effective upper limit for the luminosity of the most massive objects in the sample.
However, Swartz et al. (2011) argue that if they extrapolate their best-fitting XLF, based on a complete sample of ULXs within 14.5 Mpc, to larger distances, they cannot explain the relatively large number of ULXs with luminosities above 1041 erg s−1 that have been observed. Hence, these ULXs may belong to a different class of objects. These sources would have to exceed the Eddington limit by more than a factor of 100 if they contained stellar-mass BHs. They may be good candidates to host the predicted but thus far elusive intermediate-mass black holes (IMBHs). These IMBHs may form in the collapse of a dense stellar cluster (Portegies Zwart & McMillan 2002), the collapse of Population III stars in the early Universe (Madau & Rees 2001) or the direct collapse of massive gas clouds (Begelman, Volonteri & Rees 2006). They may reside in globular clusters (Maccarone et al. 2007), but conclusive evidence for their existence there has not yet been found. For a review on IMBHs and their formation mechanisms see van der Marel (2004). The best candidate for an IMBH to date is the extremely bright source HLX-1 in ESO 243−49, which reaches maximum X-ray luminosities of ∼1042 erg s−1(Farrell et al. 2009). The recent work by Sutton et al. (2012) provides more evidence for extreme ULXs as IMBHs.
Most ULX candidates are discovered by searching for off-nuclear X-ray point sources in galaxies (e.g. from the Chandra or XMM–Newton serendipitous source catalogues; see e.g. Liu 2011; Walton et al. 2011). The ULX catalogues compiled in this way are contaminated with objects that also show up as off-nuclear, bright X-ray sources but are not accreting IMBHs or stellar-mass BHs. Background active galactic nuclei (AGN) and quasars are obvious examples, but some X-ray bright supernovae (most likely type IIn; Immler & Lewin 2003) and active foreground stars may also contaminate the catalogues. One way to identify these contaminants if the ULX candidate has a bright optical counterpart is to take an optical spectrum. If emission or absorption lines are present, the redshift to the source can be measured. In this way, we can determine whether the source is associated with the galaxy or is a background or foreground object (cf. e.g. Gutiérrez 2013).
If the X-ray source is associated with the galaxy, optical spectra can give us additional information to classify the object. Some ULXs (Pakull & Mirioni 2002; Kaaret & Corbel 2009) are surrounded by bubbles of ionized gas, which can act as calorimeters and as such tell us if the emission is strongly beamed or not. The intensity ratios of the emission lines from these regions provide information on the source of the ionizing radiation, e.g. whether they are shock ionized or X-ray photoionized (e.g. Abolmasov et al. 2007).
We selected four high-luminosity (LX ≥ 1040 erg s−1) ULX candidates from the catalogue of Walton et al. (2011) with accurate positions that we measured using archival Chandra observations and optical counterparts that are sufficiently bright for optical spectroscopy. Two of the ULX candidates are situated in elliptical galaxies (NGC 533 and NGC 741). ULX candidates in elliptical galaxies have a higher chance to be background AGN (39 per cent, compared to 24 per cent for all sources in the catalogue of Walton et al. 2011). On the other hand, IMBHs may form in dense (globular) clusters (Miller & Hamilton 2002; Portegies Zwart & McMillan 2002) and the optical counterparts to these ULX candidates could well be just that, making them interesting targets for further investigation. AM 0644−741 is a ring galaxy with a ULX candidate situated in between the nucleus and the ring. ESO 306−003 is a spiral galaxy with a ULX in the outer edge of the disc, apparently associated with an extended optical source. We obtained optical spectra of these four sources with the FOcal Reducer and low dispersion Spectrograph (FORS2) mounted on the Very Large Telescope (VLT; Appenzeller et al. 1998). The observations and data reduction steps are described in Section 2; Section 3 contains the results. In Section 4, we discuss our findings.
OBSERVATIONS AND DATA REDUCTION
X-ray observations
We use archival Chandra observations to get exact source positions for the ULX candidates in NGC 533, NGC 741, AM 0644−741 and ESO 306−003. Table 1 lists the details of all observations.
The Chandra observations of the four ULX candidates.
| Galaxy | Observation ID | Exposure time | Source on CCD | Off-axis angle | Observation date |
|---|---|---|---|---|---|
| (kiloseconds) | (arcmin) | (ut) | |||
| NGC 533 | 2880 | 38.1 | ACIS S3 | 0.85 | 2002-07-28 |
| NGC 741 | 2223 | 30.74 | ACIS S3 | 2.74 | 2001-01-28 |
| AM 0644−741 | 3969 | 39.97 | ACIS S3 | 0.57 | 2003-11-17 |
| ESO 306−003 | 4994 | 22.75 | ACIS I3 | 6.60 | 2004-03-10 |
Notes.Chandra observation ID number, exposure time in kiloseconds, CCD on which the source was detected, the off-axis angle of the source in arcminutes and the observation date.
We use ciao version 4.4 to process the Chandra observations, with the calibration files from caldb version 4.5.0. We treat the Chandra observations as follows: first we update the event files with ACIS_PROCESS_EVENTS, then we use WAVDETECT to find the position of the ULX candidate. Sources within 3 arcmin of one of the Advanced CCD Imaging Spectrometer (ACIS) aimpoints have a 90 per cent confidence error circle around the absolute position with a radius of 0.6 arcsec; this is valid for the ULX candidates in NGC 533, NGC 741 and AM 0644−741. The candidate in ESO 306−003 has 25 counts and was observed at 6.6 arcmin off-axis, which means it has a 95 per cent confidence error circle with a radius of ∼1.5 arcsec (Hong et al. 2005). For the sources in NGC 533, NGC 741 and AM 0644−741 we extract the source counts in a circle with 6 pixel radius (90 per cent encircled energy fraction) around the source positions using SPECEXTRACT. For the ULX candidate in ESO 306−003, we use a circle with a radius of 10 pixels to get the same encircled energy fraction, since it was observed at 6.6 arcmin off-axis. As background regions, we use circles with 80 pixel radius on the same CCD but not containing any sources. We use xspec version 12.6.0 to fit an absorbed power law (pegpwrlw) to the data in the 0.3–8 keV range. We then extrapolate to get the 0.2–12 keV flux to compare this with the values reported by Walton et al. (2011). For consistency, we adopt the same model parameters: a photon index of 1.7 and NH = 3 × 1020 cm−2, and allow only the flux to vary. We find that all Chandra fluxes are consistent with those from XMM–Newton as reported by Walton et al. (2011). The positions of the X-ray sources and their fluxes are summarized in Table 2.
The positions and unabsorbed 0.2–12 keV X-ray fluxes of the ULX candidates.
| Host galaxy | Right ascension | Declination | Source flux |
|---|---|---|---|
| (erg cm−2 s−1) | |||
| NGC 533 | 01:25:33.63 | +01:46:42.6 | 2.9 ± 0.2 × 10⁻¹⁴ |
| NGC 741 | 01:56:16.14 | +05:38:13.2 | 2.5 ± 0.3 × 10⁻¹⁴ |
| AM 0644−741 | 06:43:02.24 | −74:14:11.1 | 3.5 ± 0.2 × 10⁻¹⁴ |
| ESO 306−003 | 05:29:07.21 | −39:24:58.4 | 2.4 ± 0.4 × 10⁻¹⁴ |
Notes. The positions of the ULX candidates in NGC 533, NGC 741 and AM 0644−741 are accurate to within 0.6 arcsec (90 per cent confidence level), for the source in ESO 306−003 this value is 1.3 arcsec. We fit the fluxes assuming an absorbed power law with photon index 1.7 and NH = 3 × 1020 cm−2 for consistency with the method used by Walton et al. (2011).
Source properties of the background AGN.
| Source name | In galaxy | z | Line | FWHM | Log(FX/Fopt) |
|---|---|---|---|---|---|
| (km s−1) | |||||
| CXOU J012533.3+014642 | NGC 533 | 1.8549 ± 0.0003 | CIV | 2300 ± 70 | 0.0 ± 0.5 |
| C iii] | 7800 ± 200 | ||||
| Mg ii | 5700 ± 200 | ||||
| CXOU J015616.1+053813 | NGC 741 | 0.8786 ± 0.0006 or | Mg ii or | 8400 ± 200 | 0.0 ± 0.5 |
| 1.7535 ± 0.0009 | C iii] | ||||
| CXO J064302.2−741411 | AM 0644−741 | 1.3993 ± 0.0001 | C iii] | 5100 ± 70 | 0.7 ± 0.1 |
| Mg ii | 4220 ± 40 |
Notes. Lines used for the redshift determination to the quasars, their FWHM in km s−1 and the X-ray to optical flux ratio of these sources. The X-ray to optical flux ratios are calculated using the XMM–Newton 0.2–12 keV fluxes from Walton et al. (2011) and the r′-band (for NGC 533 and NGC 741) or V-band (for AM 0644−741) optical fluxes.
Optical images and photometry
To find the optical counterparts of the ULX candidates we use archival optical observations of their host galaxies. NGC 533 and NGC 741 were observed as part of the Sloan Digital Sky Survey (SDSS), and we use the SDSS r′-band images to identify the optical counterparts to the ULX candidates in these galaxies (Fig. 1). There is no photometric information for the source in NGC 533, so we use the aperture photometry tool in gaia to estimate the r′-band magnitude. SDSS does provide u′, g′, r′, i′ and z′ magnitudes for the object in NGC 741, but these are incorrect because the source is too close to the edge of the frame. Therefore, we also use gaia to estimate the r′-band magnitude for this source. For both optical counterparts we find that r′ = 21 ± 1.
![The finders and FORS2 spectra of the three ULX candidates that are background AGN. The 90 per cent confidence error circles around the X-ray positions have a radius of 0.6 arcsec, for NGC 533 and NGC 741 we plot a larger circle for visual clarity. Left: the SDSS r′-band image of NGC 533 with a 1.2 arcsec radius circle around the Chandra position of the ULX candidate and the spectrum in which the C iv, C iii] and Mg ii emission lines, redshifted by z = 1.85, are marked. The absorption features at 6200 Å are caused by interstellar absorption, and those at 6900 and 7600 Å are telluric in origin. Middle: the SDSS r′-band image of NGC 741 with a 1.2 arcsec radius circle around the Chandra position of the ULX candidate and the spectrum of the optical counterpart. The marked emission line can be either Mg ii λ2798 line redshifted by z = 0.88 or C iii] at z = 1.75. Right: an HST ACS V-band image of AM 0644−741 with the 0.6 arcsec radius error circle around the Chandra position of the ULX candidate, and the spectrum with the Mg ii and C iii] lines, redshifted by z = 1.40, are marked.](https://oup.silverchair-cdn.com/oup/backfile/Content_public/Journal/mnras/433/1/10.1093_mnras_stt756/1/m_stt756fig1.jpeg?Expires=1750251233&Signature=QWLEBq--YGP82NRN8nKsgyFRw8W7YsY-yVQ8-A4IvUacDCFa23DB1OAy6KUc8GTOc9wGewDiVhROFpOPd~Y3~Jo~DRcXV8OzxmFFrqyQEp0sJEgOv-7jnD81q2Xl98fOuyL~Zm1WOalyiU9M2oBFUNzWCM5K-yy-~VONIr2xZJihTnsi9AiIfodOePeDo21upcUZjeBR7HY2Xx7YDNzPQNPEXCIeORTyGprRKx9~Z-PWg1jLXWz645oH61Kxjl5PYMRGwxh0-L-7urlIfXYFja2b1d6p33l8XzohQo~YM79YC2abuRAbikVaMYBbrskcnDjp8~OQ1h9DbLxlPiw6Kw__&Key-Pair-Id=APKAIE5G5CRDK6RD3PGA)
The finders and FORS2 spectra of the three ULX candidates that are background AGN. The 90 per cent confidence error circles around the X-ray positions have a radius of 0.6 arcsec, for NGC 533 and NGC 741 we plot a larger circle for visual clarity. Left: the SDSS r′-band image of NGC 533 with a 1.2 arcsec radius circle around the Chandra position of the ULX candidate and the spectrum in which the C iv, C iii] and Mg ii emission lines, redshifted by z = 1.85, are marked. The absorption features at 6200 Å are caused by interstellar absorption, and those at 6900 and 7600 Å are telluric in origin. Middle: the SDSS r′-band image of NGC 741 with a 1.2 arcsec radius circle around the Chandra position of the ULX candidate and the spectrum of the optical counterpart. The marked emission line can be either Mg ii λ2798 line redshifted by z = 0.88 or C iii] at z = 1.75. Right: an HST ACS V-band image of AM 0644−741 with the 0.6 arcsec radius error circle around the Chandra position of the ULX candidate, and the spectrum with the Mg ii and C iii] lines, redshifted by z = 1.40, are marked.
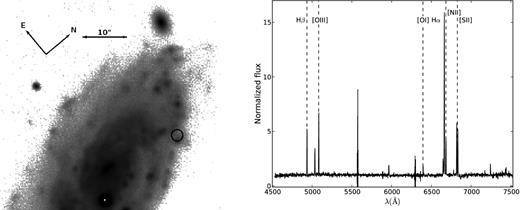
Left: the FORS2 g′-band acquisition image of ESO 306−003 with the 1.3 arcsec radius (90 per cent confidence) error circle around the position of the ULX candidate. Right: the FORS2 spectrum of the candidate optical counterpart to the X-ray source. Several emission lines, redshifted by z = 0.016, are marked.
![[O i] λ6300/Hα versus [O iii] λ5007/Hβ line ratios for H ii regions, AGN (low-ionization nuclear emission-line regions and Seyferts) and transition objects (figure adapted from Ho 2008). The black dot represents the line ratios for the ULX in ESO 306−003.](https://oup.silverchair-cdn.com/oup/backfile/Content_public/Journal/mnras/433/1/10.1093_mnras_stt756/1/m_stt756fig3.jpeg?Expires=1750251233&Signature=l6fJnPNaCT~U1Iyf4j65rwCcJJ8exXhDEbPZcjnfLWa757bDSO8cWuBaByWqOzBlBURcZByD4BjDcP1h6s4r2onkLe~6d~8S4t2nY0kdYF1eaYHa6g~Gc3ntzbQ3MXOmXm0OUyxQU8ByIgENfWlyIr2OeRW3w-GMfqW1dDC4Np2KgdRhY2CVhVLF0MR8UR-dZedxsTOISkSbun1req07lRy7usM~~yy8jbejm2~j04kDfhpXkE5zW56CtVWMpTbiUqI2u6V-0~OxZPRs2iEiwe4YCnnzxXGhRwLyrtzSV76Gy3eFi9bbk-XsZBs5LvFzgXr32cUCR-lkcg2XFuEhOA__&Key-Pair-Id=APKAIE5G5CRDK6RD3PGA)
[O i] λ6300/Hα versus [O iii] λ5007/Hβ line ratios for H ii regions, AGN (low-ionization nuclear emission-line regions and Seyferts) and transition objects (figure adapted from Ho 2008). The black dot represents the line ratios for the ULX in ESO 306−003.
The Hubble Space Telescope (HST) archive contains several observations of AM 0644−741 made with the Advanced Camera for Surveys (ACS). We use the V-band (F555W) image with exposure identifier j8my05o2q, observed on 2004-01-16 with an exposure time of 2200 s (see Fig. 1). We visually compare the position of point sources from the USNO CCD Astrograph Catalog (UCAC) 3 (Zacharias et al. 2009) with their counterparts in the HST image and find that the astrometric calibration of the image does not need to be improved. The ULX candidate has a counterpart that is in the daophot source list of this HST image in the Hubble Legacy Archive.1 It has a V-band magnitude of 21.79 ± 0.05.
We identify the optical counterpart to the ULX candidate in ESO 306−003 in a 480 s R-band observation made on 2004-01-25 ut with VLT/VIsible MultiObject Spectrograph (VIMOS) that we retrieved from the ESO archive. Its R-band magnitude is approximately 21, with the caveat that this is an extended source in a region with a very high background level due to the galaxy, which means that this measurement is not very accurate. We also obtained a g′ band, 120 s exposure of this galaxy in our VLT/FORS2 run (see Fig. 2), of which we visually inspected the astrometric solution by comparing the positions of bright stars with those in the UCAC 3.
Optical spectroscopy
We obtained VLT/FORS2 observations of NGC 741 (3 × 1800 s), AM 0644−741 (3 × 1800 s) and ESO 306−003 (2 × 2700 s) on 2011-12-03 UT under programme 088.B-0076A using the GRIS_600V grism and a 1 arcsec slit width. This configuration covers the wavelength range 4430–7370 Å with a dispersion of 0.74 Å pixel−1, yielding a resolution of 4.25 Å for the 1 arcsec slit (measured at 6300 Å). This allows us to observe the Hα, [N ii] complex and the Hβ and [O iii] lines if the sources are located at the same distance as their apparent host galaxies, with high enough resolution to separate them. The night was photometric so we also observed several spectrophotometric standard stars to perform a flux calibration. The seeing varied between 0.7 and 1.1 arcsec. The spectra of NGC 533 (3 × 1500 s) were made in service mode on 2012-01-16 ut with the GRIS_300V+10 grism and a 0.5 arcsec slit width, giving a wavelength coverage from 4450 to 8700 Å with a dispersion of 1.68 Å pixel−1 and a spectral resolution of 6.4 Å for the 0.5 arcsec slit (measured at 6300 Å). The seeing varied during the night and we have no observations of spectrophotometric standards.
To reduce the spectra we use the starlink software package figaro and the pamela package developed by Tom Marsh.2 We follow the steps outlined in the pamela manual to extract the spectra, using Keith Horne's optimal extraction algorithm (Horne 1986). We then use the software package molly, also by Tom Marsh2, to perform the wavelength calibration and, for the data taken on 2011-12-03, the flux calibration. We do not correct for telluric absorption. Because we have multiple spectra of each source, we average them to get a better signal-to-noise ratio. The two observations of ESO 306−003 were taken under varying seeing conditions. Because of this the continuum level is different in the two spectra, so we normalize these spectra before averaging them. We use molly's MGFIT task to fit Gaussian profiles to the emission lines in the spectra to determine the full width at half-maximum (FWHM) of the lines and the redshift to the sources.
RESULTS
NGC 533
NGC 533 is the dominant elliptical galaxy in a group with the same name at z = 0.0185 (Smith et al. 2000). The ULX candidate is located at 78 arcsec from the centre of the galaxy that has a semiminor axis of 90 arcsec (based on the D25 isophote; Nilson 1973). The X-ray source has an unresolved optical counterpart that is visible in the image of the SDSS, with r′-band magnitude ≈21. Fig. 1 shows the galaxy with the position of the ULX candidate and the FORS2 spectrum of the source.
Three broad emission lines are visible. We identify these as C iv, C iii] and Mg ii at z = 1.8549 ± 0.0003 (see Table 3). This proves the ULX candidate to be a background AGN, not associated with NGC 533. The 0.2–12 keV X-ray luminosity calculated for this source by Walton et al. (2011) was (2 ± 1) × 1040 erg s−1, assuming a distance to the ULX of 73.8 Mpc. The true distance to this source is 4730 Mpc (using H0 = 75 km s−1 Mpc−1 for consistency with Walton et al. 2011), which gives this AGN an X-ray luminosity of (7 ± 4) × 1043 erg s−1 using the flux as measured with XMM–Newton.
NGC 741
NGC 741 is an elliptical galaxy located at z = 0.0185 with a (D25) semimajor axis of 92.7 arcsec (de Vaucouleurs et al. 1991). The ULX candidate is located 78 arcsec West of the centre of NGC 741 and has a counterpart that is unresolved in the SDSS image. Its r′-band magnitude is ∼21. Fig. 1 shows the SDSS r′-band image of NGC 741 with the position of the ULX candidate and the FORS2 spectrum of the counterpart.
The spectrum shows one broad emission line, with a FWHM of 147 Å. We cannot say with certainty which line this is. The most likely options are that it is either the Mg ii λ2798 line or the C iii] λ1909 line (see Table 3). In the first case, this ULX candidate would be a background AGN at a redshift of z = 0.8786 ± 0.0006 with an X-ray luminosity of (1.6 ± 0.6) × 1043 erg s−1. In the second case, it would be at z = 1.7535 ± 0.0009, with LX = (4.2 ± 1.5) × 1043 erg s−1. In both cases, the source is not a ULX but a background AGN, unconnected to NGC 741.
AM 0644−741
AM 0644−741 is a ring galaxy at z = 0.022 that shows signs of recent interaction with a smaller galaxy (Few, Arp & Madore 1982; Lauberts & Valentijn 1989). The ULX candidate in this galaxy is located in between the core of the galaxy and the ring. A point-like object with a V-band magnitude of 21.8 is visible at the position of the X-ray source in archival HST images (see Fig. 1).
The FORS2 spectrum of the counterpart shows two emission lines that we identify as Mg ii and C iii] at z = 1.3993 ± 0.0001 (see Table 3). This ULX candidate is another background AGN with a 0.2–12 keV luminosity of (8.1 ± 0.8) × 1043 erg s−1.
ESO 306−003
The spiral galaxy ESO 306−003, at z ≈ 0.016 (Couto da Silva & de Souza 2006), contains a ULX candidate that is located on the edge of the spiral structure (see Fig. 2). An optical source is visible on the edge of the error circle. Visual inspection shows the profile of the counterpart to be more extended than that of point sources in the same image, but because of the high-background level and steep gradient it is not possible to perform an acceptable fit to the profile. The FWHM of point sources in this image (provided by the seeing) is 0.8 arcsec. At the distance of ESO 306−003 this yields a lower limit to the size of the source of 240 pc. The two spectra that we obtained of this source show slightly different line ratios and continuum levels (e.g. the Hβ/Hα ratio changes by 10 per cent). This can be explained by seeing variations if the optical counterpart to this source is extended, then slit losses can cause the small changes in the line ratios if there are intrinsic spatial variations in the line ratios in the extended source.
The spectrum is similar to that of an H ii region, with narrow hydrogen emission lines and strong forbidden lines. The redshift of the lines equals that of the centre of the galaxy, indicating that if the X-rays are associated with this optical source, this is a bona fide ULX with a luminosity of 1.4 ± 0.3 × 1040 erg s−1 based on the XMM–Newton flux measured by Walton et al. (2011). The X-ray flux is constant between the XMM–Newton and Chandra observations. The X-ray to optical flux ratio of the source is log(FX/Fopt) = 0.3 ± 0.5, based on the XMM–Newton 0.2–12 keV flux from Walton et al. (2011) and the r′-band flux. The line ratios, especially the [O i] λ6300/Hα ratio, place the source among the transition objects in the diagnostic diagrams of Ho (2008) (see Fig. 3). The He ii λ4686 emission line has been detected in several ULX nebulae (Pakull & Mirioni 2002; Kaaret & Corbel 2009), but we do not detect it here, possibly because the sensitivity of the detector drops off steeply towards the blue end. The 2σ upper limit for the equivalent width of this line is 1.0 Å. This corresponds to a flux of ∼10−17 erg cm−2 s−1or a luminosity of ∼5 × 1036 erg s−1.
DISCUSSION
We obtained VLT/FORS2 spectra of the optical counterparts of four bright ULX candidates with accurate positions obtained by us from archival Chandra observations. Two of these are located in elliptical galaxies NGC 533 and NGC 741. Another candidate is situated in AM 0644−741, a ring galaxy that recently interacted with a small elliptical galaxy, and in the spiral galaxy ESO 306−003. Three of our four targets turn out to be background AGN with X-ray luminosities ranging from 1 to 8 × 1043 erg s−1; one (in ESO 306−003) seems to be a bona fide ULX.
The fraction of background AGN in our sample is higher than the fraction estimated by Walton et al. (2011) for their catalogue. Although this can be due to small number statistics since we only investigate four sources, it is in line with results from other spectroscopic studies of ULX candidates. Optical spectroscopy of a sample of 23 ULX candidates in total yielded 20 background AGN and three foreground stars (Gutiérrez & López-Corredoira 2005, 2007; Gutiérrez 2006, 2013). Another study that targeted 17 ULX candidates from the catalogue of Colbert & Ptak (2002) found that 15 were background AGN and the other two objects were foreground stars (Wong, Chornock & Filippenko 2008).
All these studies mainly target ULX candidates that are relatively isolated and have a bright optical counterpart, a selection effect induced by the relative ease with which spectroscopic observations can be carried out for these sources. Sources located in crowded areas, like the spiral arms of late-type galaxies, are more difficult targets for ground-based optical spectroscopic observations. This means that spectroscopic studies are aimed at ULX candidates that have a low X-ray to optical flux ratio and that are situated relatively far away from their suspected host galaxies. As the authors of these previous papers also note, these selection criteria introduce a bias towards background AGN.
A possible method to select ULX candidates that are most likely to be real ULXs is to calculate the expected contribution of background sources based on the known density of AGN in X-ray and optical observations (López-Corredoira & Gutiérrez 2006; Sutton et al. 2012). Alternatively, it may be possible to use the X-ray to optical flux ratios of ULX candidates to select targets for future spectroscopic studies. All our sources have X-ray to optical flux ratios log(FX/Fopt) in the range between −1 and 1, typical for AGN (e.g. Barger et al. 2003). Most ULXs show values for log(FX/Fopt) ranging from 2 to 3 (Tao et al. 2011, 2012; Sutton et al. 2012). The low value that we find for the ULX in ESO 306−003 can be explained if we assume that we do not resolve the ULX counterpart but instead observe the optical flux of the entire H ii region that it resides in, thus, lowering log(FX/Fopt).
However, if we were to select candidates for spectroscopy on the basis of their X-ray to optical flux ratios only we run the risk of missing interesting sources. For instance, ULXs may display different values for log(FX/Fopt) when observed in the high and low states, as was shown for M101 ULX-1 and M81 ULS1 (Tao et al. 2011). For both sources log(FX/Fopt) is between 2 and 3 during the high state, but around 0 during the low state, well inside the range of optical to X-ray flux ratios found for AGN. Therefore, other source properties should be taken into account as well, such as galaxy morphology, the distance of the ULX to its apparent host galaxy and the absolute magnitude of its optical counterpart. The source in AM 0644−741 is a good example of a candidate with such favourable properties: situated in a ring galaxy, which is a strong sign of a recent interaction phase that triggered star formation, often linked to ULXs (e.g. Swartz et al. 2004), and close to the centre of its apparent host galaxy, decreasing the chance that it is a background AGN (Wong et al. 2008). It has an optical counterpart of such magnitude that it is consistent with being a bright globular cluster if it is at the distance of AM 0644−741. Nevertheless our optical spectrum showed it to be a background object.
The ULX in ESO 306−003
The X-ray source in ESO 306−003 is the only one of the four candidates in our sample that appears to be a bona fide ULX. The extended nature of the source is confirmed by the fact that the emission line spectrum is consistent with that of an H ii region. However, the [O i]/Hα ratio indicates that some of the ionizing flux could come from an X-ray source. Potentially, we have found a ULX embedded in an H ii region. Another possibility is that this ULX candidate is a background AGN shining through an H ii region in ESO 306−003. The X-ray to optical flux ratio is similar to that of the other AGN in our sample, so we would expect to see a contribution of redshifted emission lines from the AGN in the optical spectrum. The fact that we do not detect this makes this scenario implausible.
We find a 2σ upper limit for the flux of an He ii λ4686 line of 10−17 erg cm−2 s−1. This corresponds to an upper limit to the luminosity in the line of ∼5 × 1036 erg s−1. The presence of this line would be a strong indication of ionization by an X-ray source. We can compare this upper limit with the strength of the He ii λ4686 line in other ULX nebulae. For Holmberg II X-1, Pakull & Mirioni (2002) report a luminosity of 2.5 × 1036 erg s−1. Kaaret & Corbel (2009) report a flux for this line from the ULX in NGC 5408 of 3.3 × 10⁻¹⁶ erg cm−2 s−1, which translates to a luminosity of 9 × 1035 erg s−1 at the distance to NGC 5408 (4.8 Mpc; Karachentsev et al. 2002). Both these ULXs have an X-ray luminosity of ∼1040 erg s−1– similar to ESO 306−003 – and an He ii λ4686 to X-ray luminosity ratio of ∼10−4. If the same is true for ESO 306−003 then we would expect an He ii λ4686 flux of a few times 10−18 erg cm−2 s−1, which is just below our 2σ upper limit. New observations of this source with greater sensitivity at the wavelength of the He ii λ4686 line are needed to determine if the nebula is X-ray photoionized or not.
PGJ and MAPT acknowledge support from the Netherlands Organization for Scientific Research. GM acknowledges support from the Spanish Plan Nacional de Astronomía y Astrofísica under grant AYA2010-21490-C02-02. This research is based on observations made with ESO Telescopes at the La Silla Paranal Observatory under programme ID 088B-0076A. This research has made use of software provided by the Chandra X-ray Center (CXC) in the application package ciao and of the software packages pamela and molly provided by Tom Marsh.
Observations based on European Southern Observatory (ESO) programme 088.B-0076A.
