


Abstract
Modern radio pulsar surveys produce a large volume of prospective candidates, the majority of which are polluted by human-created radio frequency interference or other forms of noise. Typically, large numbers of candidates need to be visually inspected in order to determine if they are real pulsars. This process can be labour intensive. In this paper, we introduce an algorithm called Pulsar Evaluation Algorithm for Candidate Extraction (peace) which improves the efficiency of identifying pulsar signals. The algorithm ranks the candidates based on a score function. Unlike popular machine-learning-based algorithms, no prior training data sets are required. This algorithm has been applied to data from several large-scale radio pulsar surveys. Using the human-based ranking results generated by students in the Arecibo Remote Command Center programme, the statistical performance of peace was evaluated. It was found that peace ranked 68 per cent of the student-identified pulsars within the top 0.17 per cent of sorted candidates, 95 per cent within the top 0.34 per cent and 100 per cent within the top 3.7 per cent. This clearly demonstrates that peace significantly increases the pulsar identification rate by a factor of about 50 to 1000. To date, peace has been directly responsible for the discovery of 47 new pulsars, 5 of which are millisecond pulsars that may be useful for pulsar timing based gravitational-wave detection projects.
INTRODUCTION
Radio pulsars are unique celestial objects that are used as probes to study a wide range of physics and astrophysics (see, e.g., Blandford et al. 1993; Lorimer & Kramer 2005; Lyne & Graham-Smith 2006). Studies of pulsar emission have shed light on the properties of the interstellar medium and the physics of ultrarelativistic plasmas under high-magnetic field conditions. The statistical properties of the pulsar population give us important information on the late stages of stellar evolution, the equation of state of exotic material, and the formation and evolution of binary and multiple star systems. The stable rotation of radio pulsars allows for unique tests of gravitation theories as well as the positive detection of ultra low-frequency gravitational waves. In all cases, the greater the number of pulsars that are discovered, the more physics and astrophysics we are able to study.
As of 2013, more than 2000 pulsars have been found (ATNF Pulsar Catalogue; Manchester et al. 2005). Since pulsar population models predict that the number of detectable pulsars in the Galaxy should be about 10 times higher than this (assuming a luminosity threshold of 0.1 mJy kpc2; Faucher-Giguère & Kaspi 2006; Lorimer et al. 2006), several major radio observatories around the world are conducting large-scale blind searches for more of these objects. Typically, pulsar surveys are performed by pointing the telescope at a region of the sky for several minutes to hours, then moving to another region and repeating. Sophisticated analysis software packages, like presto or sigproc (Lorimer 2001; Ransom 2001), are applied to the data to search for periodic signals while taking into account the effects of dispersion by the interstellar medium as well as Doppler shifts due to the binary orbital motion. These search algorithms produce a possible series of ‘candidates’ (i.e. files or plots containing the identified periodic signals and their properties). One can find detailed information about pulsar searching techniques from the standard references (Lorimer & Kramer 2005; Lyne & Graham-Smith 2006). Visual inspection, usually aided by graphical tools (Faulkner et al. 2004; Keith et al. 2009), is still required to determine if a particular candidate is indeed a pulsar, as opposed to radio frequency interference (RFI). After inspection, the good candidates are re-observed in order to confirm their astrophysical origin.
Surveys produce millions of candidates. As an example, the North High Time Resolution Universe (HTRU North) pulsar survey, being conducted with the 100-m Effelsberg radio telescope, is expected to produce 14 million pulsar candidates (Barr 2011). The multibeam survey currently ongoing at the Arecibo Radio Observatory, known as the Pulsar Arecibo L-band Feed Array survey (PALFA; Cordes et al. 2006), generates over half a million pulsar candidates per year. The Green Bank Northern Celestial Cap (GBNCC) pulsar survey, currently being performed at the Robert C. Byrd Green Bank Radio telescope, produces candidates at about the same rate. The Green Bank Telescope 350MHz Drift scan pulsar survey (GBT Drift; Boyles et al. 2013; Lynch et al. 2013) generated over 1.2 million candidates. Assuming that it takes about one second to inspect a candidate by eye, one needs over 250 person hours to evaluate one million candidates. The number of candidates is beyond the ability of a single person. There are two natural ways to solve the problem: (1) apply more person power, (2) use computer-based methods to reduce the number of candidates needing inspection.
In an effort to gather the necessary person power and increase the rate at which pulsars are identified, the Arecibo Remote Command Center (ARCC) programme, developed at the University of Texas at Brownsville (UTB), trains students to search through a large number of candidates from these pulsar surveys. In order to increase the rate of pulsar discoveries, the ARCC students have developed a pulsar viewing software package known as arcc explorer, which contains a set of web applications that allows multiple users to visually inspect and rank pulsar candidates. Further details of the arcc explorer will be described elsewhere (Stovall et al., in preparation), while in this paper we focus on one part of the arcc explorer that analyzes the candidates generated by pulsar search pipelines and ranks them according to how ‘pulsar-like’ they are. We call this tool the Pulsar Evaluation Algorithm for Candidate Extraction (peace).
There are currently two major techniques used to reduce the amount of the candidates to inspect. The first type is to select suitable candidates based on several selection rules. For example, graphical tools (Faulkner et al. 2004; Keith et al. 2009) have been developed to help the visual selection. The second method (Eatough 2009; Keith et al. 2009; Lee 2009; Eatough et al. 2010; Bates et al. 2012) is to use computers to automatically select and rank the candidates. peace, which is a tool of the second type, calculates a score for each of the candidates, where the score is a measurement of the degree to which a candidate matches certain pulsar-like features. Based on the score from peace, the arcc explorer prioritizes and distributes the candidates to the students for evaluation. In this way, the pulsar-like candidates are given to the students earlier than the rest of the candidates. At the time of writing this paper, peace, has helped to identify a total of 47 new pulsars in PALFA, GBNCCand HTRU North, five of which are millisecond pulsars. Students in the ARCC programme at UTB and University of Wisconsin–Milwaukee identified PALFA and GBNCC candidates as pulsars, and they were later re-observed and confirmed.
This paper describes the details of the algorithms used by peace and the techniques used to evaluate its efficiency in prioritizing candidates. The details of the pulsars found by peace will be discussed elsewhere. The algorithms are described in Section 2. In Section 3, the current implementation is discussed in detail, together with instructions on how to obtain and install peace. In this section, we also discuss the efficiency of the current implementation, which is evaluated by comparing its ranking of GBNCC survey candidates against the human-based ranking generated by ARCC students. We discuss these results, and conclusions are presented in Section 4.
METHOD TO RANK CANDIDATES
In this section, we explain the algorithm implemented in peace to rank candidates. peace has two major parts. First, it analyzes the candidate files from pulsar search packages (e.g. presto and sigproc) and, secondly, calculates several statistics such as the signal-to-noise ratio (S/N), the pulse profile width, etc. We refer to these statistics as quality factors. From these quality factors peace computes a score, which is then used to rank the candidates. We define the quality factors and describe how to calculate them in Section 2.1. The pulsar ranking technique is then presented in Section 2.2.
Quality factors
Empirical experience has shown that one needs to inspect several features of a pulsar candidate in order to properly characterize it. In peace, we have implemented six quality factors, which are described below. For further details of the implementation, we refer readers to the documents in the code repository.1 These scores inevitably introduce selection effects in the searching process; we delay the related discussions to Section 4.
The S/N of the folded pulse profile.
The S/N is a measure of the significance of the signal present in the data. There are various definitions of S/N. Here, we define the S/N in relation to the pulse profile, where the S/N is the ratio between peak and root-mean-square (rms) values. peace reads in the pulse profile data, determines the peak amplitude from the pulse profile. To avoid biasing the rms estimation by outliers, we sort the profile data by intensity values and exclude the top 10 per cent. The S/N is calculated as the ratio between the amplitude and the rms value. Although such definition of S/N depends on the number of bins used to fold the profile, where fewer bins give higher S/N, we did not find significant correlation between S/N and pulsar period in the GBNCC data set. There are other definitions for the S/N e.g. the S/N in terms of the mean flux, the reduced χ2, the standard deviation of profile, etc. Any of these quantities can be used to quantify the strength of pulsed signals, because they contain similar information. But one needs to find appropriate score functions or weights, as we will discuss below.
The topocentric period of the source (ptop).
Pulsar search codes are designed to detect a periodic signal. As a result, each candidate has an associated signal period, the value of which can be indicative of the signal's origin. For example, RFI signals due to air traffic control radar typically have periods of a few seconds and RFI induced by power systems have characteristic frequencies of 50/60 Hz depending on the geographical location of the telescope. peace reads the period directly from the candidate file.
The width of the pulse profile (w).
The pulse width, w is defined as the width of the pulse normalized by the candidate period. Therefore, w ranges from 0 to 1. Typically, one measures the full width at half-maximum (FWHM). However, the FWHM is not a robust measure of the pulse signal width for our application, which may deal with the RFI and signals with low S/N. In order to robustly measure the width, we first fit the pulse profile to multiple Gaussian components (Kramer et al. 1994). Overlapping components are combined. w is then calculated using an amplitude-weighted sum of the FWHM of each component. The width is thus a useful parameter to discriminate pulsar candidates from RFI, since measured pulsar pulse widths are usually less than 10 per cent (Rankin 1983; Lyne & Manchester 1988; Maciesiak, Gil & Ribeiro 2011) and RFIs usually result in broad waveforms. Admittedly this breadth can be comparable to that seen in millisecond pulsars, however.
The persistence of the signal in the time domain (ηT).
The persistence of the signal in the time domain is a measure of the fraction of the observation in which the candidate signal is present. The candidate file usually contains a three-dimensional data cube, i.e. the signal intensity as the function of the time index, the frequency index and the pulse phase index. From the candidate file, peace reads in the folded pulse profile for each subintegration (i.e. the pulse profile at each time index) and then calculates the on- and off-pulse amplitude ratio rT:where the on-pulse window is defined as that region of pulse phase that lies within the FWHM region of each profile component and the off-pulse window covers the remainder. Using rT calculated for each subintegration, peace then computes ηT:(1)\begin{equation} r_{ {\rm T}}=\frac{{\rm Average of signal level in the pulse window}}{ {\rm Average of signal level outside the pulse window} }\,, \end{equation}Here αT is a preset threshold, whose default value is 1 in peace. By definition, ηT ∈ [0, 1]. Since the pulsar signal is expected to persist for most of the observing session, true pulsar signals should have a high value of ηT.(2)\begin{equation} {\eta _{\rm T}}=\frac{{\rm Number of subintegrations with } r_{ {\rm T} }>\alpha _{\rm T} }{ {\rm Total number of subintegrations}}\,. \end{equation}The persistence of the signal in the radio frequency domain (ηF).
The persistence of the signal in the radio frequency domain is a measure of that fraction of the bandwidth in which the candidate signal is present. Similar to the calculation of the rT, peace reads in the folded pulse profile for each subband, then computes the on-and-off pulse amplitude ratio rF. ηF is then computed aswhere the threshold αF is set to a default value of 1 in peace. As with ηT, ηF ∈ [0, 1]. Since the pulsar signal is expected to be broad-band, true pulsar signals should have a high value of ηF.(3)\begin{equation} {\eta _{\rm F}}=\frac{{\rm Number of subbands with } r_{ {\rm F}}>\alpha _{\rm F} }{ {\rm Total number of subbands}}\,, \end{equation}The ratio between the pulse width and the dispersion measure (DM) smearing time (ηDM).
peace reads the barycentric period (pbar), the frequency channel width (Δfc), the centre frequency (f) and the DM from the candidate file, then calculates the dispersive smearing time across a single frequency channel:Together with the fractional pulse width w, ηDM is calculated as(4)\begin{equation} \Delta \tau =8.3 \, \mu{\rm s} \left(\frac{\Delta f_{\rm c}}{\rm MHz}\right) \left(\frac{f}{\rm GHz}\right)^{-3} \left(\frac{DM}{\rm cm^{-3}\,pc}\right). \end{equation}Since the pulse width of any true astronomical signal must be greater than the dispersive smearing time across a single frequency channel, ηDM is expected to be greater than 1 for a real pulsar signal. Due to the small difference between the pbar and the ptop, either can be used in the above calculation.(5)\begin{equation} \eta _{\rm DM}=\frac{p_{\rm bar} w}{\Delta \tau }\,. \end{equation}This simple definition of DM score neglects the effects of sampling time. This does not have a significant impact on the peace ranking, because the sampling time effect only increases the measured width w of a pulse profile, which increases the ranking score rather than decreasing it.
Scores
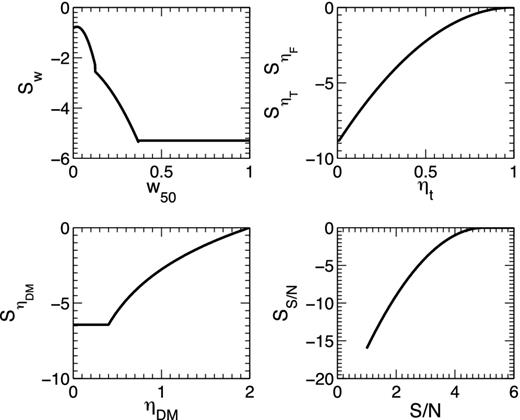
The functions |$S_{\rm {S/N}}, S_{\rm {w}}, S_{{\eta _{\rm T}}}, S_{{\eta _{\rm F}}}$| and |$S_{{\eta _{\rm DM}}}$| used by peace to determine the overall candidate score.
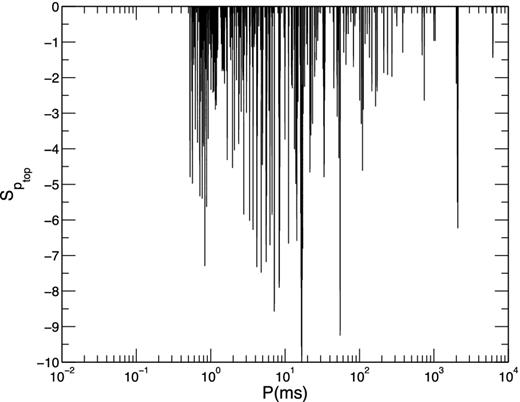
|$S_{p_{\rm top}}$| for the GBNCC survey. The x-axis is the topocentric period in milliseconds and the y-axis is the value of |$S_{p_{\rm top}}$|.
The use of |$S_{p_{\rm top}}$| was inspired by the ‘birdie-list zapping technique’ (e.g. Lorimer & Kramer 2005), where one removes all of the candidates with ptop in the period range where RFI often appears.2 Instead of completely removing such candidates, peace only reduces their final score. If other qualities are good, peace can still rank such a candidate highly. This allows for the discovery of pulsars with periods similar to the local RFI. A particular example is shown in Fig. 3: although the period of the candidate is close to the RFI, peace still gives the candidate a high final score to make the candidate stand out against the RFI because of the other scores.
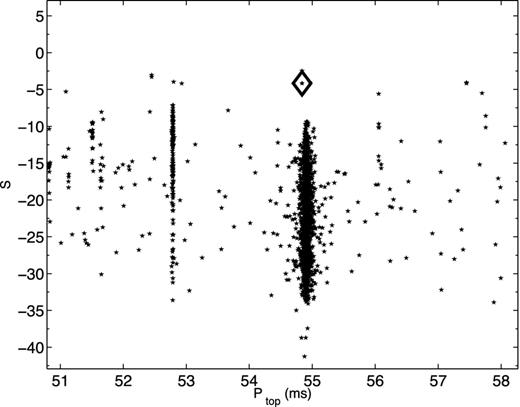
The peace score and periods for a subset of candidates. The dots are all identified as RFIs, while the diamond symbol is the candidate later identified to be a pulsar. Although the periods are similar, the peace score of the candidate is still higher than the scores of RFI.
IMPLEMENTATION AND APPLICATION
Implementation
The source code for peace is located at http://sourceforge.net/projects/pulsareace/. Currently, there exist three versions of peace where the only difference between these is the type of candidate file it analyzes. One version analyzes presto candidate files (.pfd), one for pdmp (Hotan, van Straten & Manchester 2004) candidate files (.ar) and one for image plots (.png). For .png files, peace scans user-defined regions of the image to determine the pulse profile, subintegrations and subband data. These regions can be specified in the command line with the pixel coordinates of the left, right, top and bottom of each panel. The idea behind the .png version of peace is to extend its ability to analyse candidates generated in alternative pipelines, where the users measure the geometry parameters just once and they can process all the image with an identical command line. The values of the candidate period and DM are entered via command-line arguments upon execution. If these are not given, peace ignores |$S_{p_{\rm top}}$| and |$S_{{\eta _{\rm DM}}}$|, when calculating the score.
As discussed before, peace uses several statistical thresholds together with several preset constants (i.e. |$\alpha _{\rm T}, \alpha _{\rm F}, \beta _{\rm {S/N}}, \beta _{p_{\rm top}}, \beta _{\rm {w}}, \beta _{{\eta _{\rm T}}}, \beta _{{\eta _{\rm F}}}$| and |$\beta _{{\eta _{\rm DM}}}$|) to calculate the score. peace allows the user to override each of these parameters via command-line arguments. For example, one can increase |$\beta _{p_{\rm top}}$| for data with comparatively worse RFI.
Evaluation
ARCC students have visually inspected over 105 candidates from a part of the GBNCC survey and have identified over 70 confirmed pulsars (including previous discoveries). This data set is complete and unbiased, because all the candidates have been visually inspected at least once. Such a unique data set is very valuable to evaluate the effectiveness of automatic pulsar ranking systems such as peace.
The ideal candidate sorting algorithm would score all real pulsars higher than all other candidates. Therefore, the distribution of all the known pulsars in the list of candidates ranked by score is a good measure of the effectiveness of the ranking algorithm. Here, we used the pulsars, which are identified by ARCC students in GBNCC survey, as tracers to evaluate the peace performance. The measured detection rate of peace is shown in Fig. 4, where 68 per cent of confirmed pulsars are in the top 0.17 per cent of peaceranked candidates, 95 per cent are in the top 0.34 per cent, and all are in the top 3.7 per cent. These results indicate that inspecting candidates in order of decreasing peace score will significantly increase the rate of pulsar identification. For this evaluation, the statistical thresholds and preset constants were set to their default values as described above.
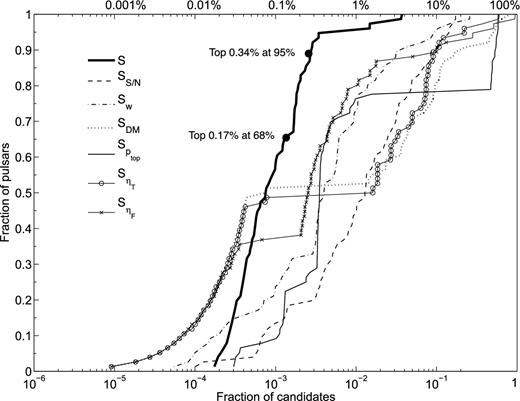
In order to determine the efficiency of peace, candidates are sorted in descending order according to the score generated by peace. In the above figure, the fraction of top ranked candidates is plotted versus the fraction of confirmed pulsars in those candidates. The thick solid, dashed, dot–dashed, dotted, solid, circled and cross-marked curves are for the ranking using the score |$S, S_{{\rm S/N}}, S_{{\rm w}}, S_{{\rm DM}}$|, |$S_{p_{\rm top}}$|, |$S_{{\eta _{\rm T}}}$| and |$S_{{\eta _{\rm F}}}$|, respectively. We can see that using the final score (S) is better than using the individual ones. The ranking using the final score S puts 68 per cent of confirmed pulsars in the top 0.17 per cent of ranked candidates, 95 per cent are in the top 0.34 per centand all are in the top 3.7 per cent.
For most of the time, the processing speed of peace is limited by the time of reading in files. An Intel® 2.4 GHz processor with 6 Mb cache usually processes a candidate file within 100 to 500 ms, which corresponds to 0.2 to 1 million candidates per processor per day.
DISCUSSIONS AND CONCLUSIONS
In this paper, we have described peace, a software package for post-analysis processing of pulsar survey candidates. peace uses a set of algorithms to analyse a pulsar candidate and calculate a score, which is a measure of how likely a candidate is to be a real pulsar. These algorithms are described and the effectiveness of peace has been evaluated. Using candidates generated by the peace survey and inspected by students in the ARCC programme, it was shown that peace significantly increases the rate of identifying pulsars. For example, four million candidates require approximately 103 person hours in order to visually inspect each one. If one pre-sorts these candidates according to their peace score, 100 per cent of the pulsars are expected to be in the top 150 thousand candidates. Inspecting these candidates only requires 40 person hours. Such efficiency will, hopefully, help the pulsar surveys using future large telescopes, such as the Five-hundred-metre Aperture Spherical Radio Telescope (Nan et al. 2006; Smits et al. 2009b) and the Square Kilometre Array (Kramer & Stappers 2010; Smits et al. 2009a).
peace uses six quality factors to determine a candidate's score. These are the S/N, the candidate period, the pulse width, the signal's persistence in the time and the frequency domains, and the pulse width to DM smearing time ratio. These quality factors are chosen because they are readily available from standard pulsar searching pipelines (e.g. presto and sigproc). Also, human experience has shown that these particular quality scores are helpful in differentiating between pulsar candidates and RFI. As shown in Fig. 4, there is no single quality factor dominating the final score. For example, typical survey analyses will remove candidates whose periods lie within RFI-dominated regions (e.g. the ‘birdie-list zapping technique’). peace simply reduces the score of such candidates. Thus, it is still possible to find pulsars within the RFI-dominated regions.
Beside the six quality factors used in this paper, there are other possibilities. For example, Eatough (2009) and Eatough et al. (2010) find that the χ2 of the fit to the theoretical DM–S/N curve and other factors can be useful for neural network algorithms in identifying pulsars. From our experience with PALFA and HTRU North surveys, the score function for the DM–S/N curve fitting χ2 will not be a simple shape. In this way, a more complex scoring scheme with more quality factors may further improve the current performance of peace.
peace is fully pre-determined and does not require any training data sets. This is different from other approaches that use neural networks (Eatough 2009; Eatough et al. 2010; Bates et al. 2012), which determine the strategy for ranking candidates by ‘learning’ knowledge from training data sets. Although peace does not require such initial training data sets, it can be further fine-tuned when such data become available.
As a caveat, using peace introduces selection effects in the searching. For machine-learning algorithms, it is hard to quantify the selection effects, since they are inherited from the training data sets. For peace, we know exactly what the selection effects are and the users can adjust the score weights to adapt to particular purposes. As indicated in Fig. 1, peace prefers candidates with small pulse widths, high S/N, wide-band signals and persistent pulses. It also down-weights the candidates with pulse profiles narrower than the channel DM smearing widths. Using multiple scores reduces the chance of missing good candidates to a certain degree, although it may still give low scores for the candidates with wide pulse profiles and low S/N. For certain pulsars, the pulse energy can decrease by a factor of 10 or more over a short time-scale and then increase just as sharply afterwards (Backer 1970). Such ‘nulling’ pulsar may get a lower score due to the persistence score ηT. Similarly, in the radio frequency domain, signals can scintillate due to the interstellar medium (Rickett 1990), which reduces the score ηF.
peace can be a starting point for machine-learning algorithms. Since we have demonstrated that the quality factors calculated by peace effectively quantify how likely a candidate is of being a pulsar, more advanced algorithms may further improve peace's scoring performance.
KJL gratefully acknowledges support from ERC Advanced Grant ‘LEAP’, Grant Agreement Number 227947 (PI: Michael Kramer). KS, FJ and the students in the ARCC programme acknowledge the support from NSF AST 0545837 & 0750913. Pulsar research at UBC is supported by an NSERC Discovery Grant and Discovery Accelerator Supplement, by CANARIE and by the Canada Foundation for innovation. The work of CMB, MR, JF, AW, SB, and XS was partially supported by the Office for Undergraduate Students at the University of Wisconsin – Milwaukee and the NSF through CAREER award number 0955929, PIRE award number 0968126 and award number 0970074. PL acknowledges the support of IMPRS Bonn/Cologne and NSERC PGS-D. We thank R. Eatough, D. Nice and J. P. W. Verbiest for reading the manuscript and for the helpful comments.
The software can be downloaded from http://sourceforge.net/projects/pulsareace/
There is a major difference between the birdie-list and the period scoring technique. The birdie list is usually used before the harmonic summing, while the |$S_{p_{\rm top}}$| is applied to the final candidates.
