


Abstract
In this paper we analyse multi-epoch very long baseline interferometry water maser observations carried out with the Very Long Baseline Array towards the high-mass star-forming region AFGL 2591. We detected maser emission associated with the radio continuum sources VLA 2 and VLA 3. In addition, a water maser cluster, VLA 3-N, was detected ∼0.5 arcsec north of VLA 3. We concentrate the discussion of this paper on the spatio-kinematical distribution of the water masers towards VLA 3-N. The water maser emission towards the region VLA 3-N shows two bow-shock-like structures, northern and southern, separated from each other by ∼100 mas (∼330 au). The spatial distribution and kinematics of the water masers in this cluster have persisted over a time span of 7 yr. The northern bow shock has a somewhat irregular morphology, while the southern one has a remarkably smooth morphology. We measured the proper motions of 33 water maser features, which have an average proper motion velocity of ∼1.3 mas yr−1 (∼20 km s−1). The morphology and the proper motions of this cluster of water masers show systematic expanding motions that could imply one or two different centres of star formation activity. We made a detailed model for the southern structure, proposing two different kinematic models to explain the three-dimensional spatio-kinematical distribution of the water masers: (1) a static central source driving the two bow-shock structures and (2) two independent driving sources, one of them exciting the northern bow-shock structure, and the other one, a young runaway star moving in the local molecular medium exciting and moulding the remarkably smoother southern bow-shock structure. Future observations will be necessary to discriminate between the two scenarios, in particular by identifying the still unseen driving source(s).
1 INTRODUCTION
In the last few decades great progress has been made in the understanding of how low-mass stars form, through multi-wavelength observations and detailed theoretical models. It is now relatively well understood that during the early stages of evolution of low-mass stars, a system is formed with a central protostar, surrounded by a rotating accretion disc at scales of ∼100 au and ejecting a highly collimated jet along the polar axis of the disc. While the disc is the reservoir from which the protostar accretes further matter, the ejected outflow removes angular momentum and magnetic flux from the system, allowing the accretion to proceed until the central star is assembled (e.g., Lada 1995; McKee & Ostriker 2007; Machida, Inutsuka & Matsumoto 2008; Armitage 2011; Williams & Cieza 2011). However, the processes that give rise to massive stars (≳8 M⊙) are still not well understood. Several well-differentiated mechanisms for forming massive stars have been proposed. For example, via an accretion disc (as low-mass stars, but with a higher accretion rate), via competitive accretion in a protocluster environment or via mergers in very dense systems of lower mass stars (Bally & Zinnecker 2005). Distinguishing between these possible scenarios is a very difficult observational task, essentially because massive young stars are rare and more distant compared to low-mass young stars. Furthermore, massive stars form in clusters in highly obscured regions, making it difficult to identify individual massive young stellar objects (YSOs) for detailed studies (see, e.g., Hoare & Franco 2007; Hoare et al. 2007; Zinnecker & Yorke 2007 and references therein). In this sense, recent interferometer observations at cm and (sub)mm wavelengths with angular resolutions of ∼0.1 arcsec (∼100 au at 1 kpc distance) suggest that stars with masses at least up to ∼20 M⊙ may form via the accretion disc scenario, in a similar way as low-mass stars do, although the number of massive disc–protostar–jet systems identified and studied at scales of ∼1000 au is still very small (e.g. Patel et al. 2005; Jiménez-Serra et al. 2007; Torrelles et al. 2007; Zapata et al. 2009; Carrasco-González et al. 2010, 2012; Davies et al. 2010; Fernández-López et al. 2011).
Within this context, observations of maser transitions of several molecular species (e.g. H2O, OH, CH3OH) in the proximity of high-mass protostellar objects (HMPOs) provide a powerful diagnostic tool to investigate the first stages of the evolution of massive star formation (e.g. Sanna et al. 2010a,b; Bartkiewicz & van Langevelde 2012). In particular, the use of very long baseline interferometry (VLBI) techniques for observing maser emission with angular resolution ≲ 1 mas ( ≲ 1 au at 1 kpc distance) allows us to study some of the main properties of the densest and hence most obscured portions of molecular clouds where the new massive stars are born. In addition, it is possible to derive the three-dimensional (3D) velocity distribution of the masing gas very close to HMPOs (e.g. Goddi et al. 2006; Matthews et al. 2010; Goddi, Moscadelli & Sanna 2011; Torrelles et al. 2011; Chibueze et al. 2012), and through polarization measurements, the distribution and strength of the magnetic field in the cores of star-forming regions (e.g. Vlemmings et al. 2006, 2010; Surcis et al. 2011a,b, 2012). Moreover, the detection of outflow activity by means of VLBI maser observations also allows us to identify new, previously unseen centres of massive star formation, some of them associated with unexpected phenomena such as ‘short-lived’ episodic ejection events characterized by kinematic ages of a few tens of years in the earliest stages of evolution of HMPOs (Torrelles et al. 2001a,b, 2003, 2011; Gallimore et al. 2003; Surcis et al. 2011a; Chibueze et al. 2012; Sanna et al. 2012).
AFGL 2591 is one of the most extensively studied high-mass star-forming regions in our Galaxy (e.g. van der Tak et al. 2006; Jiménez-Serra et al. 2012 and references therein). Located in the Cygnus X region, its distance has been recently estimated as 3.33 ± 0.11 kpc, via measurements of the trigonometric parallax of masers (Rygl et al. 2012). It appears completely obscured at optical wavelengths, but it has a very high luminosity in the infrared (IR) (Lbol ≃ 2 × 10⁵ L⊙; Sanna et al. 2012). Three radio continuum sources have been detected towards AFGL 2591 within an area of ∼6 arcsec × 6 arcsec (∼0.1 pc), VLA 1, VLA 2 and VLA 3 (Campbell 1984; Trinidad et al. 2003). Of these, VLA 3 is believed to be the youngest (∼2 × 10⁴ yr; Tofani et al. 1995; Doty et al. 2002; Stäuber et al. 2005) and more massive object (mass in the range 20–38 M⊙), dominating the IR emission of the region (Sanna et al. 2012). Submillimeter Array (SMA) observations carried out by Jiménez-Serra et al. (2012) show that VLA 3 is surrounded by a hot molecular core and that the global kinematics of the molecular gas is consistent with Keplerian-like rotation around a central source of ∼40 M⊙. In addition, a powerful molecular outflow aligned along the east–west direction has been observed in the region (Bally & Lada 1983; Torrelles et al. 1983; Lada et al. 1984; Mitchell, Maillard & Hasewaga 1991), with VLA 3 being its most likely driving source candidate (Trinidad et al. 2003). On the other hand, VLA 1 and VLA 2 are optically thin H ii regions excited by early B-type stars (Trinidad et al. 2003).
Water maser emission is observed towards this massive star-forming region, mainly associated with sources VLA 2 and VLA 3 (Tofani et al. 1995; Trinidad et al. 2003). Trinidad et al. (2003) detected with the Very Large Array (VLA; beam size ≃0.08 arcsec) two well-differentiated clusters of water masers in the vicinity of VLA 3, one peaking at (and probably excited by) this massive YSO, and the other located ∼0.5 arcsec (∼1600 au) north from it (see Fig. 1). These authors suggest that the latter cluster is excited by an independent, still undetected embedded YSO located ∼0.5 arcsec north from VLA 3. This interpretation has been recently supported by Sanna et al. (2012) with VLBI multi-epoch water maser observations (angular resolution of 0.6 mas), which show that the cluster of masers to the north of VLA 3 is formed by two bow-shock-like structures separated ∼0.12 arcsec (∼400 au) and moving away from each other along the north–south direction with proper motions of ∼20 km s−1. Sanna et al. propose that a still undetected central massive protostar(s) (probably a late B-type star, based on the luminosity of the masers) is ejecting a jet that generates the two bow shocks at its tips. The short kinematic age of the expanding motions traced by the water masers (a few tens of years) also led these authors to suggest that they are probably the result of recurrent pulsed jet events rather than of a steady jet from the central protostar(s). Therefore, this could represent an important new case providing indications that massive objects are characterized by recurrent outflow events during the early stages of their evolution (e.g. Martí, Rodríguez & Reipurth 1995; Curiel et al. 2006).
![VLA 3.6 cm continuum contour map of the high-mass star-forming region AFGL 2591, showing the radio continuum sources VLA 1, VLA 2 and VLA 3, all of them excited by massive stars (see Section 1). The plus symbols indicate the positions of the VLA 22 GHz water masers detected in the region [figure from Trinidad et al. (2003)]. The region analysed and discussed in this paper is VLA 3-N (enclosed by a dashed square), located ∼0.5 arcsec north of VLA 3. This is the region where Trinidad et al. (2003) proposed that an internal source other than VLA 3 is exciting these water masers.](https://oup.silverchair-cdn.com/oup/backfile/Content_public/Journal/mnras/430/2/10.1093_mnras_sts707/1/m_sts707fig1.jpeg?Expires=1749741342&Signature=gNp--QH9dWqG8GcITqBoirIru1aEBZovCM0Cjw4ZhTLqo64LiiA1EDKMLnIszzhPLzv0x-CcEEk7YEHsoUhcrQk4NrxJHgj3d4ANe7jhNdq8q05Mp5I~aSKmysYIQQuk5Se9kRoPfPIHRrLlL2ju7qtCRLdEUdkI5YnU6~i2nkxEncuAZZGPbRBGFdsymfxvvWQXCWmx7vkq6WFgYUFKbjkPhkMisHLpS~1HT8YmVE1KR~qhkjGITCtAMRrlKxY9OLa7hckhjSZXKmjOIyrWKo53q49EE3BN5-ci90auR99y92xDBa-3XaBWaRvejm45Y872Qu3G7rzMzZeUG8Nc4g__&Key-Pair-Id=APKAIE5G5CRDK6RD3PGA)
VLA 3.6 cm continuum contour map of the high-mass star-forming region AFGL 2591, showing the radio continuum sources VLA 1, VLA 2 and VLA 3, all of them excited by massive stars (see Section 1). The plus symbols indicate the positions of the VLA 22 GHz water masers detected in the region [figure from Trinidad et al. (2003)]. The region analysed and discussed in this paper is VLA 3-N (enclosed by a dashed square), located ∼0.5 arcsec north of VLA 3. This is the region where Trinidad et al. (2003) proposed that an internal source other than VLA 3 is exciting these water masers.
In this paper we present (Section 2) VLBI multi-epoch water maser data observed towards AFGL 2591, about seven years before (2001–2002 epochs) than those observed by Sanna et al. (2012) (2008–2009 epochs). Our data show a water maser spatio-kinematical distribution that is globally consistent with that reported from the 2008–2009 epoch data, but less extended and smoother. We analyse the 3D kinematical and spatial distribution of the maser structures following their evolution during the time span of 7 yr (Section 3), modelling the formation and evolution of these maser structures in terms of two possible scenarios: (1) a single static central massive YSO, ejecting a jet driving the two bow-shock maser structures; (2) two embedded driving sources, one exciting the northern bow shock, and the other one a young runaway star moving in the local medium at ∼20 km s−1 and exciting the smoother southern bow-shock structure observed in our data (Section 4). The main conclusions are presented in Section 5.
2 OBSERVATIONS
Multi-epoch water maser observations were carried out with the Very Long Baseline Array (VLBA) of the National Radio Astronomy Observatory (NRAO)1 towards AFGL 2591 at three epochs (2001 December 2, 2002 February 11 and 2002 March 5). We observed the 616–523 water maser transition (rest frequency = 22 235.08 MHz) with a bandwidth of 8 MHz sampled over 512 channels (spectral resolution 15.625 kHz = 0.21 km s−1) and centred at VLSR = −7.6 km s−1. All 10 VLBA stations of the array were available and recorded data during an observing time of 6 h per epoch. The data were correlated at the NRAO Array Operations Center.
The amplitude and phase calibration of the observed visibilities, as well as further imaging, were made with the NRAO Astronomical Image Processing System (aips) package. The sources 3C 45, B2007+777, BL Lac and 3C 454.3 were used for delay and phase calibration, while bandpass corrections were made using 3C 345, BL Lac and 3C 454.3. An isolated maser spot, with a point-like morphology and with high intensity (≃10 Jy) in all three epochs, was chosen to self-calibrate the data and to obtain a first and preliminary coordinate alignment between the three observed epochs. This reference maser spot has a radial velocity of VLSR = −18.8 km s−1 and it is located towards VLA 3, with absolute coordinates α(J2000.0) = |$20^{\rm h}29^{\rm m}24{.\!\!^{{\mathrm{s}}}}879$|, δ(J2000.0) = 40°11′19| ${.\!\!\!\!\!\!^{\prime\prime}}$|47 (±0| ${.\!\!\!\!\!\!^{\prime\prime}}$|01).
As a first step to identify the subregions of AFGL 2591 with water maser emission, we produced large maps with low angular resolution for each of the three observed epochs. These maps had 8192 × 8192 pixels of 1 mas each, over 512 velocity channels, covering a region of 8.2 arcsec × 8.2 arcsec centred on the reference maser spot. From them, three subregions with maser emission were identified, one associated with VLA 2, second with VLA 3 and the third one located ∼0.5 arcsec north of VLA 3. We did not detect maser emission in the region ∼2 arcsec south-west of VLA 3, where water maser emission was previously identified with the VLA (Trinidad et al. 2003; see Fig. 1). We then obtained simultaneously, for each epoch, full-resolution maps (8192 × 8192 pixels of 0.1 mas each, over 512 channels) of these fields, as well as of an additional subregion where Sanna et al. (2012) also identified water maser emission (the subregion named in that paper as MW, and located ∼0.6 arcsec west of VLA 3). The resulting synthesized beam size was ∼0.45 mas for the three observed epochs. The rms noise level of the maps ranges from ∼5 mJy beam−1 in the channel maps with weak signal to ∼250 mJy beam−1 in the channels with the strongest maser components.
Finally, each velocity channel map was searched for maser spots. We refer to a maser spot as emission that occurs at a given velocity channel and with a distinct spatial position. The threshold for the maser spot detection was taken to be equal to 10σ in each velocity channel, using the maser spot search procedure described in Surcis et al. (2011a). Clusters of maser spots were detected in the subregions around VLA 2, VLA 3 and ∼0.5 arcsec north of VLA 3. We did not detect any emission in the middle-west (MW) region, where Sanna et al. (2012) found water maser emission about seven years later. We fitted all the maser spots detected with two-dimensional elliptical Gaussians, determining their position, flux density and radial velocity. The water maser emission in the AFGL 2591 region spans a velocity range from VLSR ≃ −31 to −2 km s−1. We estimated that the 1σ accuracy in the relative positions of the maser spots at each epoch is better than ∼0.01 mas (beam/[2 × SNR]; Meehan et al. 1998). In this paper, we will concentrate on the spatio-kinematical distribution of the masers found ∼0.5 arcsec north of VLA 3 (hereafter VLA 3-N), where Sanna et al. (2012) identified two bow-shock-like structures (see Section 1). The other two observed clusters of masers associated with VLA 2 and VLA 3 will be presented and discussed elsewhere.
In Table A1 (published online) we list the positions, local standard of rest (LSR) radial velocity and intensity of all the maser spots detected in the region VLA 3-N for the three observed epochs. From this list of maser spots (Table A1) we identified maser features for proper motion measurement purposes. We refer to a maser feature as a group of three or more maser spots coinciding within a beam size (∼0.4 mas), and each of them appearing in consecutive velocity channels (0.21 km s−1). Table 1 contains the main parameters of the 33 maser features from which we measured proper motions using the three observed epochs (2001 December 2, 2002 February 11 and 2002 March 5). For the alignment of our three observed epochs with the data set of Sanna et al. (2012) to make a proper comparison (main goal of this work), we identify a maser feature clearly persisting in the two sets of data: S17 listed by Sanna et al. (2012) (which has a relatively small proper motion), identified in our data set as the maser feature ID 28 (both having similar radial velocities; Tables 1 and 2). We have corrected the positions of the feature ID 28 as a function of time (and therefore to all our data set of 2001–2002), extrapolated from the position and proper motion of the maser S17 (Sanna et al. 2012), assuming that it has moved with constant velocity through the time span of ∼7 yr. After this alignment, proper motions listed in Table 1 were estimated by a linear fitting to position of the masers of the three different epochs as a function of time. The fact that after this alignment, the whole maser structure of our observations is within that reported by Sanna et al. (2012) and that the estimated shift in position of our observed masers for a time span of 7 yr coincides with the angular separation between the structures observed in 2001–2002 (this paper) and those of 2008–2009 (Sanna et al. 2012) (see below, Section 3) gives our alignment and proper motion estimates an additional measure of robustness.
Proper motions of the VLBA water maser features in AFGL2591 VLA 3-N (2001–2002 epochs).
| Feature ID | Detected epochs | VLSR (km s−1) | Intensity (Jy beam−1) | Δx (mas) | Δy (mas) | Vx (km s−1) | Vy (km s−1) |
|---|---|---|---|---|---|---|---|
| 1 | 1,2,3 | −6.1 | 0.6 | −8.27 | 373.46 | 9.8 ± 0.8 | 0.5 ± 0.6 |
| 2 | 1,2,3 | −5.7 | 1.2 | −10.05 | 370.12 | 11.6 ± 0.3 | −6.9 ± 0.2 |
| 3 | 1,2,3 | −6.5 | 0.1 | −10.23 | 369.92 | 10.9 ± 0.2 | −4.5 ± 0.3 |
| 4 | 2,3 | −6.1 | 0.1 | −11.19 | 368.78 | 12.2 | −8.8 |
| 5 | 1,2,3 | −7.1 | 0.4 | −12.41 | 367.97 | 10.8 ± 1.3 | −10.0 ± 1.1 |
| 6 | 1,2,3 | −7.5 | 3.8 | −15.37 | 366.31 | 11.6 ± 0.2 | −12.2 ± 0.2 |
| 7 | 2,3 | −7.8 | 1.5 | −16.37 | 365.85 | −1.6 | −24.2 |
| 8 | 1,2,3 | −7.3 | 4.3 | −17.08 | 365.76 | −6.7 ± 3.1 | −20.2 ± 1.6 |
| 9 | 1,2,3 | −7.3 | 1.7 | −18.36 | 365.54 | −3.8 ± 1.9 | −19.2 ± 1.1 |
| 10 | 1,2,3 | −6.7 | 0.3 | −22.98 | 366.20 | −10.5 ± 2.3 | −14.4 ± 0.5 |
| 11 | 1,2,3 | −7.4 | 0.8 | −23.51 | 366.22 | −0.8 ± 0.2 | −16.9 ± 0.2 |
| 12 | 1,2,3 | −7.7 | 0.4 | −26.26 | 367.30 | −23.9 ± 0.3 | −11.3 ± 0.3 |
| 13 | 1,2,3 | −8.0 | 6.6 | −27.53 | 368.20 | −10.9 ± 1.1 | −13.1 ± 0.9 |
| 14 | 1,2,3 | −8.9 | 5.1 | −28.12 | 368.77 | −11.3 ± 0.1 | −9.7 ± 0.1 |
| 15 | 1,2,3 | −8.0 | 2.8 | −31.20 | 371.62 | −12.5 ± 0.3 | −10.6 ± 0.5 |
| 16 | 1,2,3 | −7.3 | 0.7 | −36.38 | 397.36 | −4.8 ± 0.3 | 11.9 ± 0.3 |
| 17 | 2,3 | −6.3 | 0.2 | −30.78 | 434.50 | 12.2 | 0.3 |
| 18 | 1,2,3 | −6.5 | 0.2 | −30.88 | 435.01 | 7.7 ± 0.8 | 8.9 ± 1.7 |
| 19 | 1,2,3 | −6.4 | 1.5 | −13.36 | 444.58 | −26.4 ± 0.9 | −5.6 ± 0.2 |
| 20 | 1,2,3 | −11.5 | 0.1 | 0.96 | 453.10 | 0.3 ± 0.2 | −0.6 ± 0.3 |
| 21 | 1,2,3 | −11.9 | 0.3 | −3.35 | 460.43 | −3.3 ± 1.7 | 8.3 ± 0.6 |
| 22 | 1,2,3 | −8.7 | 0.5 | −8.54 | 461.33 | −2.0 ± 0.6 | 7.2 ± 1.3 |
| 23 | 1,2,3 | −9.8 | 2.0 | 8.03 | 462.80 | 3.0 ± 0.2 | 11.7 ± 0.6 |
| 24 | 1,2,3 | −9.1 | 4.3 | 11.94 | 463.19 | −6.6 ± 1.1 | 9.8 ± 0.6 |
| 25 | 1,2,3 | −9.0 | 20.6 | 17.78 | 462.57 | 10.5 ± 0.1 | 10.6 ± 0.6 |
| 26 | 2,3 | −2.3 | 0.4 | 17.56 | 461.44 | 39.7 | 0.5 |
| 27 | 1,2 | −5.2 | 0.1 | 19.86 | 455.09 | 12.7 | 0.6 |
| 28 | 1,2,3 | −5.3 | 1.2 | 21.16 | 454.90 | −2.5 | 4.4 |
| 29 | 1,2,3 | −5.4 | 1.3 | 21.96 | 454.71 | 1.7 ± 0.1 | 2.2 ± 0.3 |
| 30 | 1,2,3 | −6.5 | 0.7 | 48.37 | 461.49 | 2.8 ± 0.2 | 6.4 ± 0.2 |
| 31 | 1,2,3 | −6.7 | 0.8 | 49.03 | 461.31 | 0.8 ± 1.9 | 8.6 ± 0.5 |
| 32 | 1,2,3 | −6.8 | 0.1 | 53.52 | 458.35 | −3.1 ± 1.6 | 32.8 ± 3.1 |
| 33 | 1,2,3 | −6.7 | 0.4 | 54.16 | 456.04 | 12.2 ± 0.5 | 20.0 ± 0.8 |
Notes. The water maser features where proper motions have been measured are numbered in column 1 for identification purposes. For each feature, the different epochs of detection are given in column 2 (epoch 1: 2001 December 2; epoch 2: 2002 February 11; epoch 3: 2002 March 5). Columns 3 and 4 give, respectively, the LSR radial velocity and peak intensity of the maser features as observed in the first epoch of detection. The offset positions of the features (referred to the mean epoch of the epochs where the features are detected) are given in columns 5 and 6, while their proper motions are reported in columns 7 and 8. All the offset positions are relative to the maser spot position (0,0) used for self-calibrating the data of the first epoch, with absolute position RA(J2000) = 20h 29m 24|$.\!\!^{ {\mathrm{s}}}$|879, Dec.(J2000)= 40° 11′ 19| ${.\!\!\!\!\!\!^{\prime\prime}}$|47 (± 0| ${.\!\!\!\!\!\!^{\prime\prime}}$|01) and VLSR = −18.8 km s−1. This maser spot used for self calibrating the data is associated with the radio continuum source VLA 3 (Trinidad et. al. 2003), ∼0.5 arcsec south from the region subject of the study in this paper. For the alignment of the different observed epochs, we used the maser feature S17 observed by Sanna et al. (2012) (see Table 2) and identified in our data set with maser feature ID 28 (this table), assuming that it has a constant velocity through the time span of ∼7 yr between our observations (2001–2002 epochs) and those of Sanna et al. (2008–2009 epochs). Consequently, for the maser feature ID 28, and for those detected only in two epochs (IDs 4, 7, 17, 26 and 27), there are not uncertainty estimates for the proper motion values (linear fitting). We estimate that the accuracy in the relative positions of the maser features is ∼0.10 mas. The positions, LSR radial velocity and intensity of all the maser spots observed in this region in the three epochs are listed in Table A1 (published online; see Section 2) and represented in Figs 5 and 6.
We note that the maser feature ID 28 is not the maser used to self-calibrate our data, which is associated with the radio continuum source VLA 3 (∼0.5 arcsec south of VLA 3). All the offset positions of the masers given in this paper (tables and figures) are relative to the maser spot position (0,0) used for self-calibrating the data of our first epoch of observations (2001 December 2; see above). For comparison purposes, further analysis and full discussion of all the results obtained in this region, we also list in Table 2 the 19 water maser features where proper motions have been measured by Sanna et al. (2012) for the 2008–2009 epochs in VLA 3-N (all the positions listed in Table 2 are also given with respect to our reference position [0,0], α [J2000] = 20h29m24|$.\!\!^{ {\mathrm{s}}}$|879, δ [J2000]= 40°11′19| ${.\!\!\!\!\!\!^{\prime\prime}}$|47 ± 0| ${.\!\!\!\!\!\!^{\prime\prime}}$|01).
Proper motions of the VLBA water maser features in AFGL2591 VLA 3-N (2008–2009 epochs).
| Feature ID | Detected epochs | VLSR (km s−1) | Intensity (Jy beam−1) | Δx (mas) | Δy (mas) | Vx (km s−1) | Vy (km s−1) |
|---|---|---|---|---|---|---|---|
| S17 | a,b,c,d | −5.0 | 22.2 | 20.04 | 456.77 | −2.5 ± 1.8 | 4.4 ± 2.1 |
| S18 | a,b,c,d | −9.2 | 6.0 | 19.17 | 468.30 | −7.5 ± 1.7 | 13.2 ± 2.0 |
| S19 | a,b,c,d | −12.6 | 5.4 | −15.26 | 446.41 | −7.5 ± 2.0 | 4.3 ± 2.5 |
| S20 | a,b,c,d | −7.5 | 4.5 | −12.26 | 359.10 | 0.3 ± 2.2 | −12.5 ± 2.4 |
| S21 | a,b,c,d | −8.8 | 2.9 | −6.31 | 463.47 | −13.2 ± 2.1 | 2.8 ± 2.1 |
| S22 | a,b,c,d | −8.8 | 2.3 | −7.33 | 463.42 | −5.5 ± 1.7 | 5.2 ± 2.0 |
| S24 | a,b,c | −8.4 | 2.0 | 24.30 | 468.13 | 11.3 ± 4.2 | 16.0 ± 4.3 |
| S26 | a,b,c,d | −7.5 | 1.6 | −22.49 | 358.24 | −14.3 ± 1.8 | −11.3 ± 2.2 |
| S28 | a,b,c,d | −7.1 | 0.7 | −5.86 | 366.28 | 8.5 ± 1.8 | −1.7 ± 2.1 |
| S30 | a,b,c,d | −5.0 | 0.5 | 17.83 | 457.38 | −4.0 ± 2.0 | 3.1 ± 2.0 |
| S32 | a,b,c,d | −8.3 | 0.4 | 0.54 | 465.56 | −8.5 ± 1.8 | 5.4 ± 2.2 |
| S33 | a,b,c,d | −9.6 | 0.4 | −5.59 | 464.00 | −9.7 ± 2.1 | 6.4 ± 2.2 |
| S34 | a,b,c | −8.4 | 0.4 | 22.84 | 468.37 | 14.1 ± 3.3 | 14.0 ± 8.7 |
| S35 | a,b,c,d | −7.5 | 0.4 | −36.93 | 374.32 | −14.4 ± 1.8 | 8.5 ± 2.2 |
| S36 | b,c,d | −8.4 | 0.3 | 26.74 | 461.06 | 24.1 ± 3.0 | 5.7 ± 3.2 |
| S37 | a,b,c | −6.3 | 0.2 | 27.34 | 463.22 | 18.0 ± 3.3 | −11.0 ± 4.7 |
| S38 | a,b,c,d | −6.7 | 0.2 | 57.85 | 459.46 | 1.4 ± 1.8 | 9.0 ± 2.2 |
| S40 | a,b,c,d | −6.7 | 0.2 | −4.16 | 373.03 | 5.8 ± 1.8 | −0.2 ± 2.1 |
| S41 | b,c,d | −7.5 | 0.2 | −10.13 | 462.80 | −6.1 ± 3.7 | 0.5 ± 3.0 |
Notes. Same as Table 1, but for the water maser features with proper motions measured by Sanna et al. (2012) for the epochs a (2008 November 10), b (2009 May 06), c (2009 May 13) and d (2009 November 13). The ID numbers of the features are the same as those listed by Sanna et al. (2012) preceded by an S. All the offset positions are with respect to the same (0,0) position given for the data of Table 1 after alignment of all the observed epochs (2001–2002 and 2008–2009; see notes in Table 1 and Section 2). In this way, the offset positions listed in columns 5 and 6 of this table were obtained by adding (−631.01 mas, +151.08 mas) to the (Δx, Δy) positions listed in columns 5 and 6 of table 2 of Sanna et al. (2012).
3 OBSERVATIONAL RESULTS
In Fig. 2 we present an integrated intensity image of the water maser emission obtained from our VLBA data towards the region VLA 3-N. The emission shows the presence of two shell-like structures of water masers with sizes ∼30 mas (∼100 au) that resemble bow shocks, named hereafter as the northern and southern bow-shock structures. These structures are observed in our three epochs of observations (2001–2002). The northern and southern bow shocks are separated from each other by ∼100 mas (∼330 au). It is worth noting that the spatial distribution of these water maser structures agrees very well with those traced by the VLBA observations reported by Sanna et al. (2012), made seven years after our observations (see below). This result implies that both the surrounding interstellar medium and the exciting source(s) of the masers have been relatively stable over this temporal scale of 7 yr.
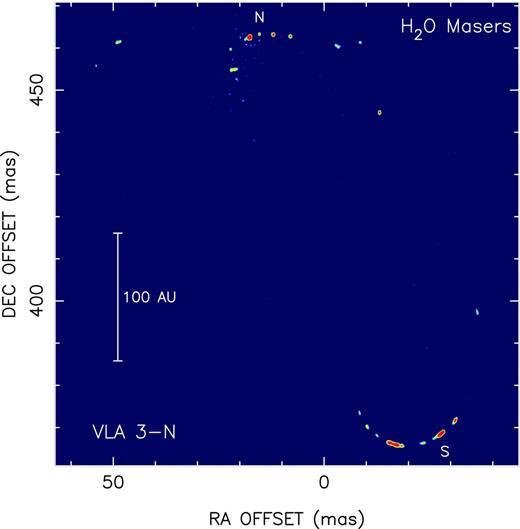
Integrated intensity image of the water maser emission in the region VLA 3-N (dashed square in Fig. 1) for the first epoch of the VLBA observations on 2001 December 2 (the spatial distribution of the water maser emission is very similar in the two other observed epochs, 2002 February 11 and 2002 March 5). The colour intensity scale is saturated at 7 Jy beam−1 (beam ≃ 0.45 mas) to show the full water emission structure. The intensity of all the water masers spots is listed in Table A1 (published online).
The northern and southern bow shocks detected with our VLBA data present significant morphological differences. In fact, while the northern bow shock has a somewhat irregular morphology, the southern one has a remarkable smooth morphology (not so evident in the data presented by Sanna et al. 2012), which has remained stable during our three epochs of VLBA observations. This is more clearly seen in Fig. 3, where we show, as close-ups, the integrated intensity contour maps of the two bow-shock structures.
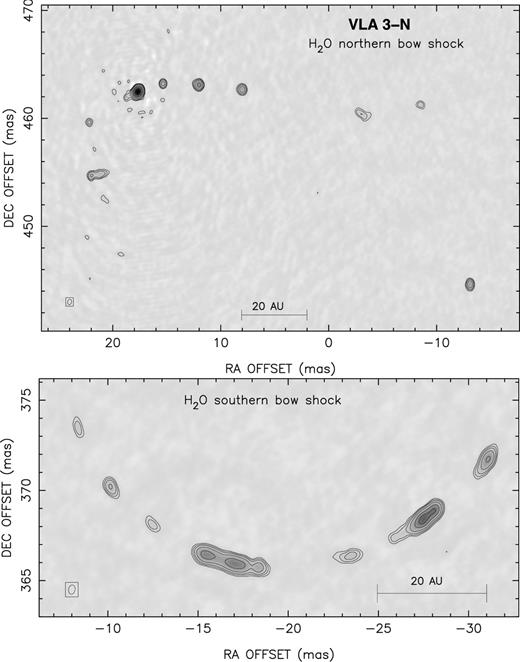
Close-up of the integrated water maser emission in VLA 3-N (shown in Fig. 2) for the northern (upper panel) and southern (lower panel) bow-shock structures for the first epoch of the VLBA observations on 2001 December 2 (the spatial distribution of the water maser emission is very similar in the two other observed epochs, 2002 February 11 and 2002 March 5). Contours levels are 0.7, 1.2, 2, 4, 10, 20 and 60 Jy beam−1 (beam ≃ 0.45 mas).
The water maser emission in VLA 3-N spans a velocity range from VLSR ≃ −13 to −2 km s−1, and flux densities range from ∼0.05 to 30 Jy beam−1 (Tables A1 and 1). Most of the water maser emission appears blueshifted with respect to the systemic velocity of the extended ambient molecular cloud of the AFGL 2591 massive star formation region (VLSR ≃ −6 km s−1; van der Tak et al. 1999). However, the centre of the velocity range covered by the masers is closer to the LSR velocity of the HC3N line emission from the hot molecular core in VLA 3 (VLSR ≃ −7 to −8 km s−1), measured with the SMA with an angular resolution of ∼0.4 arcsec (Jiménez-Serra et al. 2012). The water maser spectrum of the whole VLA 3-N region is dominated by two main velocity components (∼40 Jy), at VLSR ≃ −9.0 and −7.5 km s−1, arising from the northern and southern bow-shock structures, respectively (see Fig. 4).
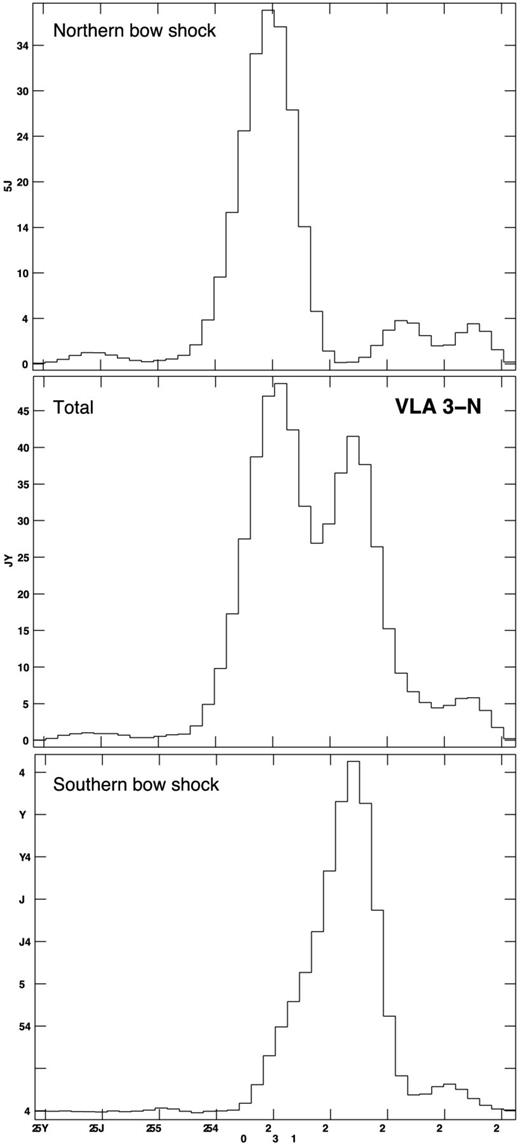
Water maser spectra of the northern (top panel) and southern (bottom panel) bow-shock structures observed with the VLBA towards VLA 3-N (see Figs 1 and 2) on 2001 December 2 (the spectra in the other two observed epochs are similar). The total spectrum obtained for the full region VLA 3-N (∼0.1 arcsec size) is also shown (central panel).
We measured the proper motions of 33 water maser features located in the VLA 3-N region (Table 1), resulting in average tangential velocities of ∼20 km s−1 (∼1.3 mas yr−1). In Fig. 5 we plotted the positions of all the water maser spots measured with the VLBA at epochs 2001–2002 (Table A1), together with the proper motion vectors of these 33 maser features (Table 1). We also plotted in this figure the 19 maser features measured by Sanna et al. (2012) in 2008–2009, as well as their proper motions. The colour scale of the symbols represents their LSR radial velocities.
![Positions of all the water maser spots measured with the VLBA in the region VLA 3-N in epochs 2001–2002 (plus signs; this paper, Table A1) and in epochs 2008–2009 (filled circles; Sanna et al. 2012). The colour scale represents the LSR radial velocity of the masers. The arrows (solid and dashed lines for epochs 2001–2002 and 2008–2009, respectively) represent the proper motion vectors of the maser features listed in Tables 1 and 2. The length of the arrows corresponds to the estimated proper motions over the total time span of 7 yr [time span between our VLBA observations and those of Sanna et al. (2012)]. Note that the positions of all the maser spots detected in 2001–2002 fall within the area circumscribed by the masers detected in 2008–2009. The northern and southern bow-shock structures are separated from each other by ∼100 mas (∼330 au) for epochs 2001–2002, and by ∼120 mas (∼400 au) for epochs 2008–2009 (see Sections 3 and 4).](https://oup.silverchair-cdn.com/oup/backfile/Content_public/Journal/mnras/430/2/10.1093_mnras_sts707/1/m_sts707fig5.jpeg?Expires=1749741342&Signature=VdNUyT21TXcINj3suTNMw8tQ8ZvP7H9Pywnyk4wWA0BhVwXgF4tu~L-L~4nUA2YIGsD2s-7iL7NX8PqNSWooFQHOcwL-KFkCU0g~wH8irKKOtVsCY2-g7R8I6EIfebVV0C16~f3rKsTXFXlW4FNOgs9wSpDgl0CK8ZyxoSP5qgl7PEtqakM3Nnrmw4JBaq9Wvic15-WlUpAfJaT0~6nSINw2Btsv1wQpjY6Bnmo7zyJ6HBhj6bR9Pz6lZqW1y4hXb~X4Aw1KAwe6dRG0J37QxqJdC6GUsDy-NVBi4N-J6ILKRDJsd51QB5GqQXg0IoxKUtaTe8ButuKIHO0f~lyi9g__&Key-Pair-Id=APKAIE5G5CRDK6RD3PGA)
Positions of all the water maser spots measured with the VLBA in the region VLA 3-N in epochs 2001–2002 (plus signs; this paper, Table A1) and in epochs 2008–2009 (filled circles; Sanna et al. 2012). The colour scale represents the LSR radial velocity of the masers. The arrows (solid and dashed lines for epochs 2001–2002 and 2008–2009, respectively) represent the proper motion vectors of the maser features listed in Tables 1 and 2. The length of the arrows corresponds to the estimated proper motions over the total time span of 7 yr [time span between our VLBA observations and those of Sanna et al. (2012)]. Note that the positions of all the maser spots detected in 2001–2002 fall within the area circumscribed by the masers detected in 2008–2009. The northern and southern bow-shock structures are separated from each other by ∼100 mas (∼330 au) for epochs 2001–2002, and by ∼120 mas (∼400 au) for epochs 2008–2009 (see Sections 3 and 4).
Fig. 5 shows that the northern masers of VLA 3-N are moving essentially northwards, while the southern masers are moving southwards (epochs 2001–2002). This is fully consistent with the results reported by Sanna et al. (2012) for epochs 2008–2009. In addition, we found that the two main water maser structures detected in epochs 2001–2002 in VLA 3-N (i.e. the northern and southern bow shocks) fall within the corresponding structures observed in epochs 2008–2009. In fact, the northern and southern bow-shock structures are separated from each other by ∼100 mas (∼330 au) in epochs 2001–2002, while they are separated by ∼120 mas (∼400 au) in epochs 2008–2009. This implies that the two bow-shock structures have increased their angular separation in the time span of 7 yr at a relative proper motion of ∼2.8 mas yr−1. If we assume expansion from a common centre, this would correspond to expanding proper motions of ∼1.4 mas yr−1 (equivalent to a velocity of ∼22 km s−1). This velocity is consistent with the proper motion values we have measured for the individual water maser features. This is more clearly seen from Fig. 6, where we show as a close-up the proper motions in the northern and southern bow-shock structures. The magnitudes of individual proper motions, represented by the arrow lengths, roughly coincide with the rate of increase in angular separation between the structures observed in 2001–2002 and those of 2008–2009. This is especially remarkable for the southern bow-shock structure.
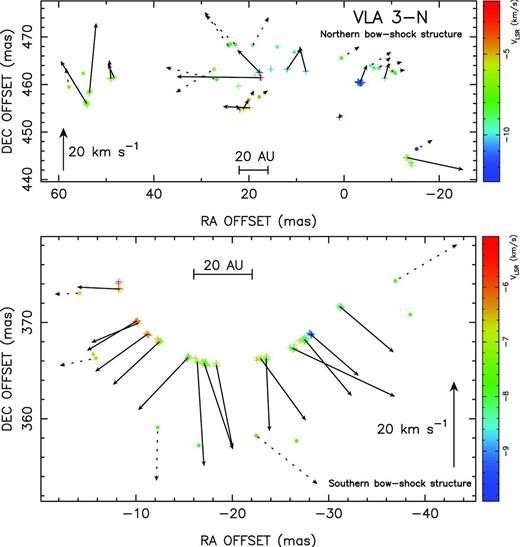
Same as in Fig. 5, but showing a close-up of the water maser proper motions of the northern (top panel) and southern (bottom panel) bow-shock structures in VLA 3-N. Note that the lengths of the solid arrows indicating the estimated shift in position for a time span of 7 yr roughly coincide with the angular separation between the structures observed in 2001–2002 (this paper) and those of 2008–2009 (Sanna et al. 2012), more noticeable for the southern bow-shock structure. This is consistent with the structures moving at almost constant velocities during the time span of 7 yr.
All these characteristics are consistent with the structures moving at almost constant velocities during a time span of 7 yr. Considering that the difference between the radial velocities of the northern and southern bow-shock structures is a few km s−1 (Fig. 4), and their radial velocities are relatively close to the radial velocity of the HC3N line emission peak observed ∼0.25 arcsec north from VLA 3 within the hot molecular core (Jiménez-Serra et al. 2012), together with the large tangential velocities that we obtain (∼20 km s−1), we conclude that the water maser structures in VLA 3-N are likely moving almost on the plane of the sky. In addition, within each of the two bow-shock structures, there are also small radial velocity differences. For the southern bow shock, a small velocity shift of ∼2 km s−1 is observed, increasing west to east from VLSR ≃ −8 to −6 km s−1 (Fig. 6). For the northern bow shock, radial velocity differences are relatively larger than in the southern one, up to ∼4–5 km s−1, but these differences are distributed more irregularly.
4 DISCUSSION: THE MASER SHELL AS A STELLAR WIND BOW SHOCK
The northern and southern shell-like structures traced by the water maser emission in VLA 3-N show systematic expanding motions that could imply one or two different centres of star formation activity. Here we consider two possible scenarios to explain the spatio-kinematical distribution of these masers: (i) a static central source driving the two bow-shock structures and (ii) two independent driving sources, one of them exciting the northern bow-shock structure, and the other one, a young runaway star moving in the local molecular medium at ∼20 km s−1, exciting and moulding the smoother southern bow-shock structure. Given that the southern structure has a remarkably smooth morphology and systematic proper motions, we use this structure to develop the model.
4.1 The bow-shock model
The water masers of the southern structure detected in the VLA 3-N region trace a more or less smooth arc on the plane of the sky. When compared with the structure observed by Sanna et al. (2012), it is clear that the arc-like structure (traced by the masers) is moving as a whole, in an approximately southward direction.
Sanna et al. (2012) interpreted this arc of masers, together with the northern structure, as part of an elliptical bow shock expanding into the molecular cloud, driven by a static central source. The heating and compression of the molecular material at the shock gives rise to the observed maser emission.
We think that this bow-shock interpretation is basically correct. But here we present a generalized and more detailed model for this bow-shock scenario. Our interpretation is based on the work of Raga et al. (1997) on the proper motions of condensations in a bow-shock flow. This work presents a derivation of the basic parameters of the bow shock (such as its velocity, direction and environmental motion) from a set of observed proper motions of water maser features.
First, we assume that the bow shock has an axially symmetric shape and that it moves with a constant velocity (in magnitude and direction) with respect to the surrounding molecular cloud. As the bow shock moves, it heats, compresses and pushes the molecular cloud material, producing a thin shell of emitting gas.
The bow shock moves at a velocity vbs, directed at an angle ϕ with respect to the plane of the sky. The water masers are likely to trace the bow-shock ‘edge’ (i.e. the region in which the thin shell is tangential to the line of sight), since this is the line of maximum (local) optical depth as seen by the observer.
If we assume that the bow shock has a paraboloidal shape, the projection of the bow shock (which moves in an arbitrary direction) on the plane of the sky is also a parabola. This is demonstrated in Appendix A, in which we develop the equations describing the shape of the bow shock.
4.2 Fits to the observed bow shapes
We now use equations (A8)–(A10) to carry out an unweighted least-squares fit to the (x, y) positions of the observed masers of the southern structure (see Table A1), from which we obtain the parameters (x0, y0, θ, B) of the best-fitting parabola. Fits are done to our three observed epochs, as well as to the 2008–2009 maser positions of Sanna et al. (2012).
The fits are shown in Fig. 7, and the resulting parameters (together with their errors) are given in Table 3. As seen from the standard deviation of the values obtained for each parameter in the fits of the different epochs, quoted in the bottom line of this table, the only parameters that show significant trends with time are x0 and y0 (i.e. the position of the head of the projected bow shock), while the dispersion of values of theta and B is small, consistent with a time-independent behaviour.

Parameters of the parabolic fits to the bow shapes.
| Epoch | t (d) | x0 (mas) | y0 (mas) | θ (°) | B (mas−1) |
|---|---|---|---|---|---|
| 1 | 0 | −17.68 | 365.68 | −9.73 | 0.0536 |
| 2 | 71 | −17.64 | 365.44 | −9.90 | 0.0532 |
| 3 | 93 | −17.72 | 365.32 | −9.45 | 0.0532 |
| Sa | 2535 | −19.50 | 356.56 | −2.18 | 0.0530 |
| σb | … | 1.80 | 0.39 | 5.27 | 0.0038 |
aSanna et al. (2012).
bStandard deviations of the values obtained in the four parabolic fits.
In Fig. 8 we plot the values of x0, y0, θ and B as a function of time. For x0 and y0 we have carried out a least-squares fit to the resulting time dependences (also shown in Fig. 8), from which we obtain velocities of (−0.27 ± 0.31, −1.31 ± 0.07) mas yr−1 (in α and δ, respectively), corresponding to (−4.2 ± 4.8, −20.6 ± 1.0) km s−1 at a distance of 3.3 kpc. The full plane-of-the-sky velocity therefore is of 21.0 km s−1, which is consistent with the proper motion velocities of the fastest masers (see Tables 1 and 2).
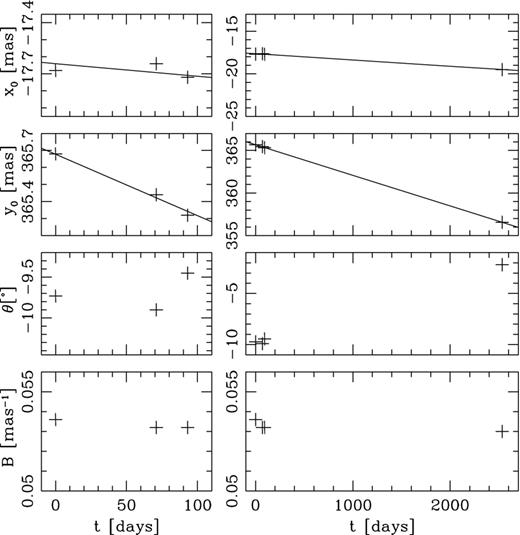
Parameters from the parabolic fits to the masers of our three epochs and the masers of Sanna et al. (2012) as a function of time (with t = 0 corresponding to our first epoch: 2001 December 2). We have obtained linear fits for the position (x0, y0) of the tip of the bow shock in the four available epochs, which are shown with solid lines in the corresponding plots (the same fits are shown in the plots of the left and right columns). The graphs of the right column show the four epochs, and the left column graphs show our three epochs with an expanded time-axis.
We have to note that a similar fit for the observed masers of the northern structure is not possible because this structure shows a somewhat irregular morphology. However, we think that the nature of this structure is similar to that of the southern bow shock and that the observed morphological differences could be due to a non-uniform VLA 3-N ambient medium, being the density or turbulence larger in the northern parts. We also cannot rule out that the northern structure is more evolved and it has begun to disperse.
4.3 The motions of the individual masers
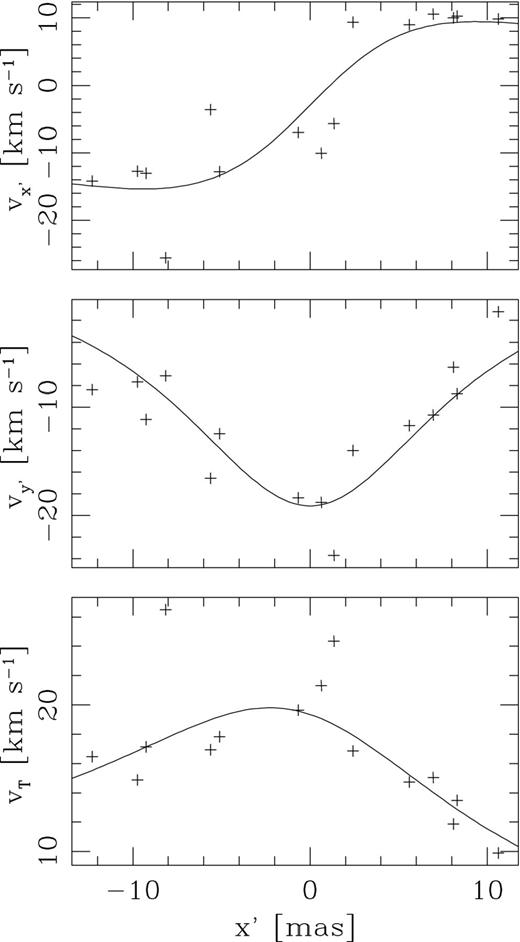
The crosses show the proper motions |$v_{x^{\prime }}$|, |$v_{y^{\prime }}$| and |$v_{\rm T}=\sqrt{v_{x^{\prime }}^2+v_{y^{\prime }}^2}$| of the individual maser spots as a function of the x′ coordinate (measured perpendicular to the axis of the projected bow shapes; see Fig. A1). The solid lines correspond to the least-squares fit described in the text.
If we subtract this environmental motion from the velocity of the tip of the bow shock (−4.2 and −20.6 km s−1 along the x and y coordinates, calculated above from the fits to the observed bow shapes), we obtain a (−0.57, −24.24) km s−1 velocity (in α and δ, respectively) of the bow shock with respect to its surrounding environment. This corresponds to a full plane-of-the-sky motion of 24.25 km s−1 of the bow shock with respect to the molecular cloud, which is consistent with the values of vbscos ϕ obtained from the fits to the |$v^0_{x^{\prime }}$| and |$v^0_{y^{\prime }}$| versus x′ dependences (see equations 1 and 2).
In this way, we find that the proper motions derived from parabolic fits to the bow shapes (in the four different epochs) and the proper motions of the individual masers are all consistent with a single, parabolic bow-shock model with a ‘shape parameter’ B = 0.0533 mas−1 (see equation A8) with a plane-of-the-sky motion of (−0.6, 24.2) km s−1 (along α and δ) with respect to an environment with a (−3.6, 3.7) km s−1 plane-of-the-sky motion (see equation 3).
Now, if the maser spots are located in the leading edge of the projected bow shock, we expect their line-of-sight velocities to be zero. The observed small LSR velocity shift of the masers in the southern bow-shock structure, with velocities between −8 and −6 km s−1 (see Section 3.1 and Table 1), therefore indicates that the environment molecular gas has radial velocities in this range. This result is in agreement with the millimetre CO and submillimetre HC3N observations of van der Tak et al. (1999) and Jiménez-Serra et al. (2012), respectively.
4.4 Parameters of the stellar wind: the runaway star scenario
The fact that the northern and southern bow-shock structures detected with our data present significant morphological differences, with the southern one showing a remarkably smoother morphology, led us to consider an alternative scenario in which we have two embedded driving sources in VLA 3-N (instead of a single static central driving source). One exciting the most irregular northern bow-shock structure and the other one exciting the smoother southern bow shock.
Let us now assume that the southern bow shock is produced by the interaction of a spherical wind from a runaway star with a uniform molecular environment (while the northern bow shock is produced by another different driving source). This problem has been studied, e.g., by Cantó, Raga & Wilkin (1996), who give an analytic expression for the shape of the bow shock. This shape will remain unchanged as the star moves through the cloud, moving together with the star (consistent with the fact that the observed ‘shape parameter’ B is approximately constant; see Table 3).
Parameters of the bow shock for different orientations.
| ϕ (°) | R0 (au) | vbs (km s−1) | R′0 (mas) |
|---|---|---|---|
| 0 | 18.6 | 24.0 | 5.6 |
| 30 | 16.1 | 27.7 | 5.4 |
| 45 | 13.1 | 33.9 | 5.2 |
| 60 | 9.3 | 48.0 | 4.9 |
| 90 | 0.0 | ∞ | 4.7 |
| ϕ (°) | R0 (au) | vbs (km s−1) | R′0 (mas) |
|---|---|---|---|
| 0 | 18.6 | 24.0 | 5.6 |
| 30 | 16.1 | 27.7 | 5.4 |
| 45 | 13.1 | 33.9 | 5.2 |
| 60 | 9.3 | 48.0 | 4.9 |
| 90 | 0.0 | ∞ | 4.7 |
As expected, for ϕ = 90° there is no information about the bow-shock velocity. Interestingly, the position of the star with respect to the observed bow-shock tip (R′0) is limited to a range between 4.7 and 5.6 mas (for all values of ϕ). The narrowness of this interval is a consequence of the weak dependence of R′0 on the orientation angle ϕ (see equation 9).
To estimate the stellar wind parameters, we have to fix a value for R0 and use equation (4). Let us take R0 ≈ 15 au and vbs = 30 km s−1 (corresponding to ϕ ∼ 37°), which are representative values for a bow shock with an angle ϕ (with respect to the plane of the sky) not exceeding ∼60° (see Table 4). This velocity is highly supersonic with respect to the ≤1 km s−1 sound speed of the molecular cloud, and the shock is therefore strong.
4.5 Summary
We find that the proper motions derived from parabolic fits to the observed southern arc and the proper motions of the individual masers are consistent with a bow shock (with a time-independent shape) moving at a velocity of ∼24 km s−1 within an environment with a velocity of ∼5 km s−1 (both on the plane of the sky).
If we model this bow shock as the interaction of an isotropic stellar wind with a homogeneous, streaming environment, we find that the observations are consistent with a wind with a velocity of vw ∼ 100 km s−1 and a mass-loss rate of |${\dot{M}_w}\sim {\rm 10^{-8}\, M_{\odot }\,yr^{-1}}$|. Therefore, the source producing the observed maser arc structure could be a normal low-mass, young star, moving at a velocity of ∼24 km s−1 on the plane of the sky.
Interestingly, the stellar wind bow-shock model predicts that the position of the star should lie ≈ 4.7-5.6 mas approximately north of the apex of the bow shock (the range of possible distances corresponding to different possible values of the unknown angle ϕ between the bow-shock axis and the plane of the sky). In an attempt to detect a radio continuum source at the predicted position by the model, we analysed the VLA archive data of project AJ337. This project includes observations made in the A (2007 July 26), B (2008 January 18) and C (2008 March 9) configurations at 3.6 cm and 7 mm. The data were reduced following the NRAO recommendations and the different configurations were concatenated to obtain images of good quality. We clearly detect VLA 3 at both wavelengths, but we fail to detect a source towards VLA 3-N with 3σ upper limits of 0.036 mJy beam−1 (λ = 3.6 cm; beam ≃0.24 arcsec) and 0.20 mJy beam−1 (λ = 7 mm; beam ≃0.15 arcsec). Future searches with higher sensitivity of the emission from this source will show whether or not our bow-shock model works well in its present form.
It is important to note that a detailed model was not made for the water masers tracing the northern bow-shock structure. As has been mentioned, these masers are not showing a remarkably smooth morphology; instead, they are tracing a structure with a somewhat irregular morphology, opening the possibility that it is excited by another different YSO and in a possibly more turbulent region.
5 CONCLUSIONS
We have performed and analysed multi-epoch VLBA water maser observations towards the high-mass star-forming region AFGL 2591 with an angular resolution of 0.45 mas. Clusters of masers were detected towards the massive YSOs VLA2, VLA 3 and ∼0.5 arcsec (∼1700 au) north of VLA 3, identifying a new centre(s) of star formation by its outflow activity (VLA 3-N). The water maser emission in VLA 3-N is distributed in the form of two bow-shock-like structures separated from each other by ∼100 mas (∼330 au). The northern bow-shock-like structure is moving essentially northwards, while the southern one is moving southwards. These water maser structures observed in epochs 2001–2002 are contained within the area circumscribed by the corresponding structures observed by Sanna et al. (2012) in epochs 2008–2009, implying that these structures have persisted during the time span of 7 yr but increasing their angular separation at a relative proper motion of ∼2.8 mas yr−1. We find that while the northern bow-shock-like structure has a somewhat irregular morphology, the southern one has a remarkably smooth morphology. We have considered two alternative scenarios to explain these structures: (1) a single, static YSO ejecting a jet and driving the two bow-shock-like structures and (2) at least two YSOs, each of them exciting one of the structures.
In particular, we made a detailed modelling for the southern structure and found that its spatio-kinematical distribution fits very well with a bow shock with a time-independent shape. We have modelled this bow shock as the interaction of an isotropic stellar wind from a runaway YSO with a homogeneous, streaming environment. The YSO moves at a velocity of ∼24 km s−1 on the plane of the sky. Our model predicts that the position of this driving YSO (with vw ∼ 100 km s−1 and |${\dot{M}_w}\sim {\rm 10^{-8}\, M_{\odot }\,yr^{-1}}$|) should lie ∼5 mas north of the apex of the southern bow shock.
Future, sensitive radio continuum observations are necessary to discriminate between the different scenarios, in particular to identify the still unseen driving source(s) and determine its (their) nature.
We would like to thank our referee for the very careful and useful report on our manuscript. GA, CC-G, RE, JFG and JMT acknowledge support from MICINN (Spain) AYA2011-30228-C03 grant (co-funded with FEDER funds). JC and ACR acknowledge support from CONACyT grant 61547. SC acknowledges support from CONACyT grants 60581 and 168251. LFR acknowledges the support of DGAPA, UNAM and CONACyT (México). MAT acknowledges support from CONACyT grant 82543. RE and JMT acknowledge support from AGAUR (Catalonia) 2009SGR1172 grant. The ICC (UB) is a CSIC-Associated Unit through the ICE (CSIC).
The NRAO is a facility of the National Science Foundation operated under cooperative agreement by Associated Universities, Inc.
REFERENCES
APPENDIX A: BOW-SHOCK MODEL
A1 The shape of the bow shock
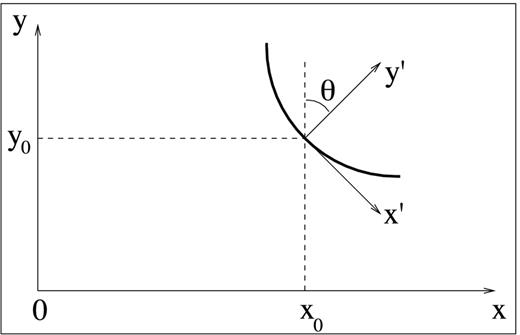
Schematic diagram showing the observer's plane-of-the-sky reference frame (x, y) and the (x′, y′) reference frame aligned with the projected bow-shock shape (with the y′-axis parallel to the symmetry axis of the bow shock, and y′ = 0 at the projected tip of the bow shock). The position on the plane of the sky of the projected bow-shock tip is (x0, y0).
Parameters of the water maser spots detected in AFGL 2591 VLA 3-N (VLBA: 2001-2002 epochs). The full version of the table is available as Supporting Information in the online version of this paper.
| Epoch | δx (mas) | δy (mas) | VLSR (km s−1) | Intensity (Jy beam−1) |
|---|---|---|---|---|
| 1 | −36.35 | 397.28 | −6.97 | 0.15 |
| 1 | −36.34 | 397.26 | −7.18 | 0.41 |
| 1 | −36.33 | 397.24 | −7.39 | 0.62 |
| 1 | −36.32 | 397.22 | −7.60 | 0.52 |
| 1 | −31.09 | 371.73 | −7.81 | 2.19 |
| 1 | −31.09 | 371.74 | −7.60 | 1.21 |
| 1 | −31.09 | 371.73 | −8.02 | 2.78 |
| … | … | … | … | … |
| … | … | … | … | … |
A2 The velocity field
SUPPORTING INFORMATION
Additional Supporting Information may be found in the online version of this article:
Table A1. Parameters of the water maser spots detected in AFGL 2591 VLA 3-N (VLBA: 2001-2002 epochs). (Supplementary Data).
Please note: Oxford University Press are not responsible for the content or functionality of any supporting materials supplied by the authors. Any queries (other than missing material) should be directed to the corresponding author for the article.
