


Abstract
The accretion of minor satellites is currently proposed as the most likely mechanism to explain the significant size evolution of the massive galaxies during the last ∼10 Gyr. In this paper, we investigate the rest-frame colours and the average stellar ages of satellites found around massive galaxies (Mstar ∼ 1011 M⊙) since z ∼ 2. We find that the satellites have bluer colours than their central galaxies. When exploring the stellar ages of the galaxies, we find that the satellites have similar ages to the massive galaxies that host them at high redshifts, while at lower redshifts they are, on average, ≳1.5 Gyr younger. If our satellite galaxies create the envelope of nearby massive galaxies, our results would be compatible with the idea that the outskirts of those galaxies are slightly younger, metal-poorer and with lower [α/Fe] abundance ratios than their inner regions.
1 INTRODUCTION
There is a growing consensus that the strong size evolution observed among the massive galaxies (e.g. Daddi et al. 2005; Trujillo et al. 2006, 2007; Longhetti et al. 2007; Buitrago et al. 2008) is mainly dominated by the continuous accretion of satellites, which would increase the size (by a factor of ∼4) and the mass (by a factor of ∼2) of the galaxies since z ∼ 2. The theoretical expectations associated with this mechanism suggests a growth in size compatible with the observations (e.g. Nipoti, Londrillo & Ciotti 2003; Khochfar & Burkert 2006; Hopkins et al. 2009; Naab, Johansson & Ostriker 2009; Oser et al. 2012). In this scheme, the infalling satellites would represent the building blocks of the external parts of the most massive galaxies.
A direct way of probing the above minor merging scenario is to explore the evolution of the satellites around massive galaxies with cosmic time (e.g. Williams, Quadri & Franx 2011; Newman et al. 2012; Quilis & Trujillo 2012). Several papers in the last few years have calculated the frequency of satellites around massive galaxies and have quantified how this fraction changes with cosmic time. This work has been done in the nearby Universe (see e.g. Chen 2008; Liu et al. 2011) and up to z ∼ 1 using mostly samples of central galaxies less massive than 1011 M⊙ (de Ravel et al. 2011; Nierenberg et al. 2011). Recently, Mármol-Queraltó et al. (2012, hereafter Paper I) expanded the previous analysis exploring the fraction of massive galaxies (Mstar ∼ 1011 M⊙) with satellites up to z ∼ 2. They probed two different redshift ranges: up to z = 1, to explore the fraction of massive galaxies with satellites having 0.01 < Msat/Mcentral < 1 (1:100), and up to z = 2, to study the fraction of massive galaxies with satellites within the mass range 0.1 < Msat/Mcentral < 1 (1:10). The results of that paper support a picture where the fraction of massive galaxies with satellites, within a projected radius of 100 kpc, has not changed with time since z ∼ 2. This fraction remains around ∼15 per cent for galaxies with satellites with mass Mstar ≳ 1010 M⊙ and around ∼30 per cent if we explore satellites with masses Mstar ≳ 109 M⊙ up to z = 1.
In this paper, we investigate the stellar population properties of the satellites around massive galaxies found in Paper I in an effort to characterize the satellites that eventually could be accreted to form the outskirts of the massive galaxies that we find in the local Universe. Using the Rainbow data base (Pérez-González et al. 2005, 2008a; Barro et al. 2011a) we analyse the evolution of the rest-frame colours, as well as the average stellar ages of the satellites in comparison with their central galaxies.
This paper is structured as follows. In Section 2 we describe our sample of massive galaxies and the photometric catalogue we have used to identify their satellites and their properties. A summary of our criteria to identify the satellites is presented in Section 2.1. We present in Section 3 the results of this work related to the rest-frame colours (Section 3.1), colour–magnitude diagrams (Section 3.2) and average stellar ages (Section 3.3). Finally, a summary and discussion of our findings is provided in Section 4. In this paper we adopt a standard Λ cold dark matter cosmology, with Ωm = 0.3, ΩΛ = 0.7 and H0 = 70 km s−1 Mpc−1. All magnitudes are in the AB system (Oke 1974).
2 THE DATA
We have used as the reference catalogue for the central galaxies the compilation of 629 massive (Mstar ∼ 1011 M⊙) galaxies presented in Paper I. These galaxies were selected from the sample of massive objects published in Trujillo et al. (2007, hereafter T07) based on the near-infrared Palomar/DEEP-2 survey (Bundy et al. 2006; Conselice et al. 2007) over 710 arcmin2 in the Extended Groth Strip (EGS). T07 estimated (circularized) half-light radius (re) and Sérsic indices n (Sérsic 1968) using the ACS I-band filter for all the galaxies in our sample. These authors tested the accuracy of the parameter determination running a set of simulations of artificial galaxies uniformly generated at random, matching the observed structural parameter distribution of their galaxies. Moreover, they simulated the real conditions of their observations (the background sky and the observed point spread function). They obtained that the uncertainties of the structural parameters were δre/re < 30 per cent and δn/n < 38 per cent.
The satellites around our massive objects were extracted from the EGS IRAC-selected galaxy sample from the Rainbow Cosmological Database1 published by Barro et al. (2011a) (see also Pérez-González et al. 2005, 2008a). This data base covers an area of 1728 arcmin2 centred on the EGS and provides spectral energy distributions (SEDs) ranging from the ultraviolet (UV) to the mid-infrared (MIR) regime plus well-calibrated and reliable photometric redshifts and stellar masses (Barro et al. 2011b). For the ∼10 per cent of the galaxies in this catalogue, spectroscopic redshifts are also available. From the Rainbow data base we have selected all the galaxies with z < 2.2 and an estimated stellar mass 108 < Mstar < 1012 M⊙. A total of ∼55 000 objects were selected in the whole EGS area following these criteria. We refer to this resulting sample as the Rainbow catalogue.
There are 629 galaxies up to z = 2 from T07 for which the Rainbow catalogue allows the study of satellites down to a 1:10 mass ratio (0.10 < Msat/Mcentral < 1). Down to 1:100 mass ratio (0.01 < Msat/Mcentral < 1) and z < 1, the number of galaxies that can be explored is 194. These final samples are given by the stellar mass limit (75 per cent complete) at each redshift of the Rainbow data base (see fig. 1 of Paper I), so that we only consider central galaxies that could have satellites down to 1:10 (and 1:100 for z < 1) mass ratio in the Rainbow catalogue. More information of this selection is detailed in Paper I. Briefly, we compared the data for the massive galaxies (redshifts and stellar masses) from T07 and the Rainbow catalogue to build a sample of 694 massive galaxies, of which 317 have photometric redshifts from Rainbow and 377 have spectroscopic redshifts (340 from the Rainbow catalogue and 37 from T07). After this selection, we applied a final cut in this sample of galaxies to assure that the fraction of galaxies with satellites along our explored redshift range is not biased by the stellar mass completeness limit of the Rainbow data base (Pérez-González et al. 2008a, see their fig. 4) in the redshift range 0 < z < 2. The mean stellar mass of our sample is M⋆ = 1.3 × 10¹¹ M⊙ [Kroupa initial mass function (IMF)].
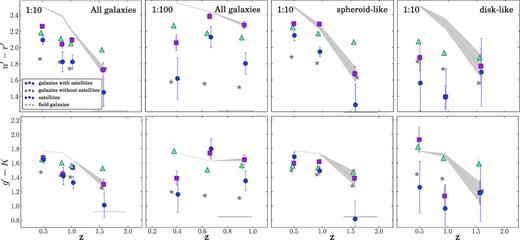
Evolution of the rest-frame u′ − r′ and g′ − K colours with redshift. The mean colours of central galaxies with (magenta squares) and without (cyan triangles) satellites are plotted together with the mean colours of the detected satellites (blue circles) and the field galaxies (grey stars). Grey shadows represent the passive evolution based on the colours of the average population of the massive galaxies with satellites at the higher redshift.
Finally, our sample of massive galaxies is large enough that we can explore whether the properties of the satellites around the massive galaxies depend on the morphological type of our objects. We have used the Sérsic index as a proxy to the galaxy morphology, since in the nearby universe, galaxies with n < 2.5 are mostly disc-like objects, whereas galaxies with n > 2.5 are mainly spheroids (e.g. Andredakis, Peletier & Balcells 1995; Blanton et al. 2003; Ravindranath et al. 2004). We have used the published Sérsic indices provided by T07 to separate our galaxies into two subsamples, i.e. spheroid- and disc-like galaxies, in our whole redshift range.
2.1 Search for satellites around the massive galaxies
In this work, we will use the results already presented in table 1 of Paper I related to the fraction of massive galaxies with satellites. Summarizing, we counted as satellites those galaxies found in the Rainbow catalogue that (1) are within a projected radial distance to our central galaxies of Rsearch = 100 kpc (corresponding to 0.3 and 0.2 arcmin for z = 0.5 and 2.0, respectively). The search is also restricted to distances larger than 1 arcsec (∼8 kpc), which is the deblending limit of sources in the Rainbow data base; (2) the difference between their photometric redshifts and the redshift of the central galaxies is lower than the 1σ uncertainty in the estimate of the photometric redshifts of the Rainbow data base (using the same uncertainties than in the selection of the sample, i.e. Δzphot = 0.070 for 0.0 < z < 0.5, Δzphot = 0.061 for 0.5 < z < 1.0 and Δzphot = 0.083 for 1.0 < z < 2.5); and (3) the stellar mass of these objects should be within 0.1 < Msat/Mcentral < 1.0 for the galaxies in the range 0 < z < 2, and within 0.01 < Msat/Mcentral < 1.0 for the galaxies in the range 0 < z < 1. We considered different redshift bins to explore the evolution of the fraction, Fsat, of massive galaxies with satellites. The width of these bins (see Table 1) were chosen to include a similar number of massive galaxies in each bin and have a similar statistics among them.
Stellar age differences between central and satellite galaxies.
| Redshift range | Agecentral−Agesatellite |
|---|---|
| (Gyr) | |
| All galaxies | |
| 0.10 < Msat/Mcentral < 1.00 | |
| 0.20 < z < 0.75 | 0.92 ± 0.06 |
| 0.75 < z < 0.90 | 1.04 ± 0.13 |
| 0.90 < z < 1.10 | 0.37 ± 0.07 |
| 1.10 < z < 2.00 | −0.20 ± 0.15 |
| 0.01 < Msat/Mcentral < 1.00 | |
| 0.20 < z < 0.55 | 1.76 ± 0.33 |
| 0.55 < z < 0.73 | 1.11 ± 0.07 |
| 0.73 < z < 1.10 | 0.83 ± 0.06 |
| Spheroid-like (n > 2.5) galaxies | |
| 0.10 < Msat/Mcentral < 1.00 | |
| 0.20 < z < 0.75 | 0.99 ± 0.06 |
| 0.75 < z < 1.10 | 1.00 ± 0.04 |
| 1.10 < z < 2.00 | 0.01 ± 0.15 |
| Disc-like (n < 2.5) galaxies | |
| 0.10 < Msat/Mcentral < 1.00 | |
| 0.20 < z < 0.75 | 0.41 ± 0.43 |
| 0.75 < z < 1.10 | −0.73 ± 0.30 |
| 1.10 < z < 2.00 | −0.19 ± 0.42 |
Although redshifts, either from photometric or spectroscopic measurements, are available for all the galaxies in this study, there are a number of objects identified as satellites that are actually contaminants that satisfy the above criteria but are not gravitationally bound to our massive galaxies. It is important to note that in ultimate case it is not the accuracy of the redshift estimate which limits the determination of pure gravitationally linked systems (e.g. Patton et al. 2000; Patton & Atfield 2008; Lotz et al. 2011), but the deviation from the Hubble flow associated with the peculiar velocities of the galaxies. This effect is particularly relevant in dense environments as clusters of galaxies, and its contribution is difficult to estimate (e.g. Liu et al. 2011; Paper I).
To quantify the contamination, we follow the method presented in Paper I. Briefly, the method consists on placing a number of mock massive galaxies (equal to our central galaxies) randomly through the volume of the catalogue. In our simulations, the number of mock galaxies that are within each redshift bin is the same than in our sample and we keep fixed the parameters of the massive galaxies. Once we have placed our mock galaxies through the catalogue, we count which fraction of these mock galaxies have satellites around them taking into account the searching criteria explained above. This procedure is repeated one million times to have a robust estimate of the fraction of mock galaxies with satellites. We consider this value, Ssimul, to be representative of the background affecting our real central sample. In addition, these simulations allowed us to estimate the scatter in the fraction of galaxies that have contaminants. We use this scatter as an estimate of the error of our real measurements.
2.2 Rest-frame colours
For all the galaxies in the Rainbow catalogue, including the massive galaxies, there are available measurements of their rest-frame colours. These quantities were obtained from the fitting to the observed UV-to-MIR photometry [from the UV wavelengths probed by GALEX to the far-infrared (FIR) observed by Spitzer] compiled for each galaxy in the Rainbow catalogue. The fit is based on a set of empirical templates computed from pegase 2.0 models (Fioc & Rocca-Volmerange 1997) assuming a Salpeter (1955) IMF (Mstar = 0.1–100 M⊙), a Calzetti et al. (2000) extinction law and the FIR photometry (MIPS 24 and 70 μm) of dust emission models of Chary & Elbaz (2001) and Dale & Helou (2002) (we refer the reader to Barro et al. 2011b for specific details of these fittings).
With these data, Barro et al. (2011b) provide with rest-frame colours in different filters, not corrected by internal extinction and measured over the best-fitted templates of the SED for each galaxy. Here we will use the colours u′, g′ and r′ of the Sloan Digital Sky Survey (SDSS) system, and Ks of the Two Micron All Sky Survey, given by the Rainbow data base for each galaxy.
3 RESULTS
For the central galaxies with satellites, it is also necessary to take into account that it is a priory unknown which central galaxies have real satellites and which ones have only fake satellites. Since this is the same problem that we face for the properties of the satellites, again we will use equation (2) to estimate the mean properties of the central objects. In this case, to model the mean properties of the galaxies with fake satellites we use the mean properties of the central galaxies without satellites. For both the satellites and their central galaxies, two sources of error are considered: the error in their mean values and the error in the estimate of the fraction of galaxies with satellites.
Finally, for the massive galaxies without detected satellites, we simply compute the mean value of their properties for all the galaxies in each redshift bin. The associated errors in this case are the errors in their mean values.
3.1 Evolution of the rest-frame colours with redshift
We study in this section the evolution of the average colours of the central galaxies and their satellites. We focus on u′ − r′, which mainly traces young stellar populations, and g′ − K, which takes into account the evolved stellar populations. The results are shown in Fig. 1.
We find that massive galaxies with and without satellites have similar u′ − r′ and g′ − K colours, and they are redder than their satellites. This is in agreement with previous works in the local Universe (e.g. Weinmann et al. 2009, using data from the SDSS, also pointed to bluer colours for satellites than central galaxies in our stellar mass ranges) and up to z = 1 (e.g. Grutzbauch et al. 2011, using DEEP-2 data). We see that at low redshift, our satellites have redder u′ − r′ (and g′ − K) colours than the field galaxies, in agreement with recent works in the local Universe (e.g. Van Den Bosch et al. 2008; Wang & White 2012), while at higher redshifts our satellites and the field galaxies present similar colours.
When we segregate the central galaxies depending on their morphological type, we see that the massive spheroid-like galaxies have redder u′ − r′ colours than their satellites, while they present similar g′ − K. Moreover, disc-like massive galaxies and their satellites, in general, are bluer that the massive spheroid-like galaxies and their satellites.
In these figures we have also included the expected colours for the passive evolution of the galaxies. For doing that, we measure the colours over the single stellar population models of Charlot & Bruzual (in preparation) at different ages, assuming solar metallicity and a Kroupa IMF, and we chose that model with closer colour to our galaxies at higher redshift with satellites. Then, we plot the colour evolution from that initial value. In addition, the errors in the colours were also considered, giving the upper and lower limits represented in the figure. If we compare our data with these colours, we find that the u′ − r′ of the central galaxies at lower redshifts is not compatible with a passive evolution. This is not surprising since the u′ − r′ colour is mostly tracing the young stellar population that could be formed along their lifetime. However, the passive evolution of the g′ − K values is more compatible with the colours of the central galaxies since this colour is showing the evolved stellar population that was born at similar ages. The evolution of u′ − r′ and g′ − K colours points to that new star formation is been produced at all redshifts among the different galaxy types, including the spheroid-like objects (see also Pérez-González et al. 2008b).
3.2 Colour–magnitude diagrams
In the local Universe, the bimodality of galaxies found in the colour–magnitude diagram is well known, where early types (E/S0) populate a narrow red sequence that is separated from bluer, star-forming spirals by a green valley (Strateva et al. 2001; Hogg et al. 2003; Baldry et al. 2004; Balogh et al. 2004 and references therein). A similar division extends at least up to z ∼ 1 (e.g. Lin et al. 1999; Bell et al. 2004; Weiner et al. 2005; Willmer et al. 2006; Wang et al. 2010) and beyond (Giallongo et al. 2005; Brammer et al. 2009; Pannella et al. 2009; Whitaker et al. 2011). Here we present the colour–magnitude diagram for the massive spheroid- and disc-like galaxies in our sample in comparison with their satellites to explore whether our objects are in the red sequence or in the blue cloud and to probe whether there is a hint of any evolution.
In Fig. 2, we present the u′ − r′ rest-frame colour versus Mr diagram in the three redshift ranges of study. Since the separation between the red sequence and the blue cloud evolves with redshift (e.g. Bell et al. 2004), we also present the histograms of the galaxies in the Rainbow data base in each redshift range to identity the red sequence and the blue cloud in our data. We fit a double Gaussian to these histograms as a first-order approximation to obtain these two populations in our sample. This separation is shown as a dashed line in Fig. 2. We find that for galaxies with z < 1.10, the massive central spheroids and their satellites are in the red sequence, although there is a trend of satellites getting bluer as redshift increases. Moreover, the massive disc-like galaxies at z < 1.10 are mainly in the red sequence, while their satellites are in the blue cloud. Finally, the satellites of both the spheroid-like galaxies and the discs at 1.10 < z < 2.00 are in the blue cloud, while the massive galaxies, independently of their type, are in the red sequence. For disc galaxies, the results are very uncertain due to the low statistics.
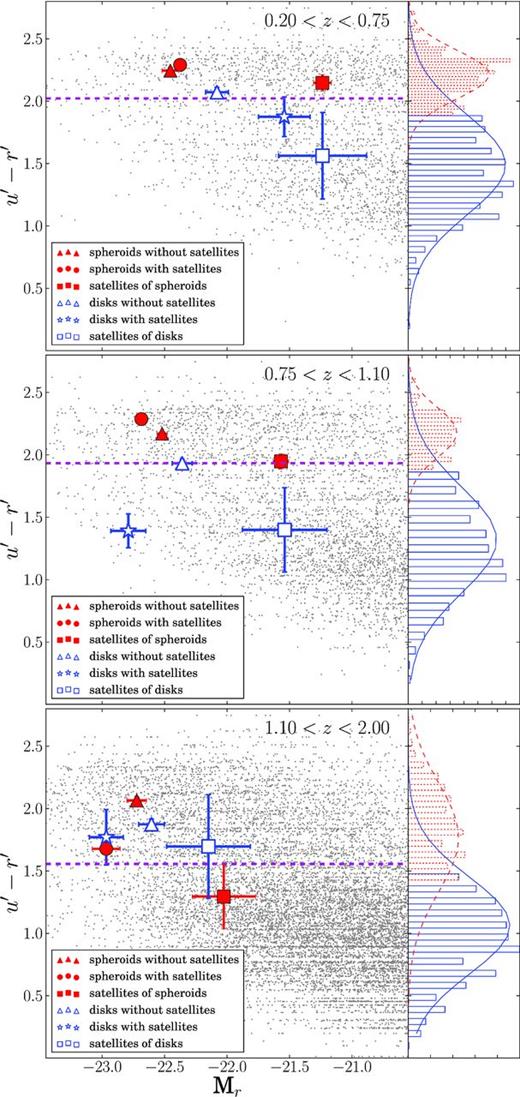
Colour–magnitude diagram for the galaxies in this study, showing u′ − r′ rest-frame colours versus r-band absolute magnitudes. Red filled circles represents massive spheroid-like galaxies, while blue open stars represents massive discs. Their satellites are represented with filled and opened squares of the same colours. The dashed magenta line corresponds to the separation for the red sequence and the blue cloud in our sample, obtained from a double Gaussian fit to the histograms of the Rainbow data in each redshift range, presented on the right.
These colour–magnitude diagrams suggest that mergers involving massive objects at higher redshifts (1.10 < z < 2.00) would be mixed mergers (i.e. a massive galaxy in the red sequence and a satellite in the blue cloud) for both spheroid- and disc-like central galaxies. Moreover, we could expect mixed mergers for disc-like galaxies at lower redshifts. Finally, the satellites of massive spheroids at 0.2 < z < 0.75 are more located towards the red sequence, and therefore, mostly dry mergers would be expected at those redshifts.
3.3 Stellar ages of the satellite galaxies
In Table 1 and Fig. 3, we summarize the difference in age of the central galaxies and their satellites for the redshift bins considered in this study. In all the cases, we find that galaxies at higher redshifts present similar average ages, while satellites are younger than their central galaxies when the redshift decreases. This tendency is clear for galaxies with satellites in both 1:10 and 1:100 mass ratios (the left-hand panel in Fig. 3). A linear fit indicates that satellites at z = 0 would be ≳ 1.5 Gyr younger than their central galaxies.
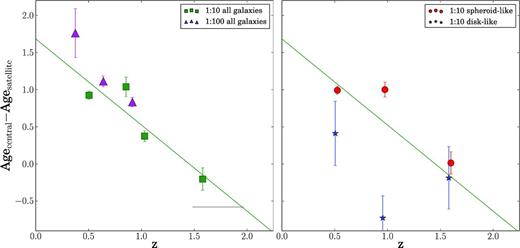
Difference in stellar age between the central galaxies and their satellites. In the left-hand panel, we plot the case of the whole sample exploring satellites down to 1:10 mass ratio (green squares) and down to 1:100 mass ratio (magenta triangles). Results for spheroid-like (red circles) and disc-like (blue stars) central galaxies are presented in the right-hand panel.
When we separate the sample depending on their morphological type (the right-hand panel in Fig. 3), we find the same result for the satellites around spheroid-like galaxies, being ≳1.5 Gyr younger at z = 0. This is not the case for disc-like galaxies and their satellites which present similar ages within the errors at all the redshifts.
4 SUMMARY AND DISCUSSION
Simulations of minor merging suggest that new accreted stars from satellites are mainly added to the outer parts of the central galaxies (e.g. Nipoti et al. 2003; Naab et al. 2009; Hopkins et al. 2010). This produces an efficient growth in size compatible with the observations (Hopkins et al. 2009; Naab et al. 2009; Trujillo, Ferreras & de La Rosa 2011). If the satellites are significantly different in stellar content than their central galaxies, the imprints of these satellites might be found in the outer parts of massive galaxies in the local Universe. In this paper, we explore several properties of the satellite galaxies in comparison with their central galaxies to characterize the galaxies that eventually could be accreted by the massive galaxies at different redshifts.
Our sample of central galaxies is formed by 629 massive (Mstar ∼ 1011 M⊙) galaxies at 0.2 < z < 2.0 presented in Paper I. We searched for satellites within a projected radial distance of 100 kpc around the massive galaxies that have mass ratios of galaxies in two regimes: 0.01 < Msat/Mcentral < 1 (1:100) up to z = 1 and 0.1 < Msat/Mcentral < 1 (1:10) up to z = 2.
When exploring rest-frame colours, we find that satellite galaxies are bluer than their central galaxies, with and without satellites. This result is in agreement with the recent works by Wang et al. (2010) (data from the GOODS survey; Giavalisco et al. 2004) and Newman et al. (2012) (results from the CANDELS survey; Gronin et al. 2011), who also explored the colours of satellite galaxies around galaxies. Although with different samples and analysis, their studies agree in the bluer colours for the satellites when comparing with their central galaxies. Furthermore, the satellites at low redshift have redder u′ − r′ colours than galaxies in the field (Fig. 1). Several works in the local Universe also point out to redder colours for the satellites than for galaxies in the field. For example, using data from the Galaxy And Mass Assembly (GAMA) survey (Driver et al. 2011), Prescott et al. (2011) studied the fraction of red satellites around massive galaxies at 0.01 < z < 0.15. They found that the fraction of red satellites is higher around massive galaxies than in more isolated regions. Therefore, the satellites would be redder in average than the field galaxies in their study, in good agreement with our results.
We also find clear differences between the satellites and their central galaxies when we split the sample depending on their Sérsic indices. Within the error bars, the satellites of disc-like galaxies present a similar evolution of the colours with redshift than their central galaxies. In addition, there is no clear differences in their mean ages. However, if we focus on the u′ − r′ colour, the satellites of spheroid-like galaxies seem to be quite different, since they are clearly bluer than their central galaxies and redder than the field galaxies. Moreover, the spheroid-like galaxies become significantly older than their satellites at low redshift (Fig. 3).
The colour–magnitude diagrams presented in Fig. 2 suggest that at z > 1 the satellites of the spheroid-like massive galaxies could be future candidates for mergers involving gas-rich satellites more than just dry mergers, while at lower redshift we find that satellites would be more located towards the red sequence. These results are in agreement with Newman et al. (2012), who indicated that a significant fraction of mergers at z > 1, even for red hosts, are not completely dry (i.e. mergers of massive spheroid-like galaxies with disc-like satellites are observed), although they did not find it at lower redshifts (0.4 < z < 1). However, López-Sanjuan et al. (2011) also found that 35 per cent of their massive early-type galaxies (red galaxies) since z ∼ 1 present a blue companion, and therefore, they would represent a future mixed merger. Although the mean values of the satellites of the massive spheroid-like objects seem to be more located in the red sequence at 0.75 < z < 1.10, our colour–magnitude diagram shows that they are significantly bluer than their central galaxies.
When investigating the ages of the satellites in comparison with their central galaxies (Fig. 3), we find that the satellites have similar ages than their hosts at high redshift (z > 1.5), and therefore both massive and satellite galaxies at those redshifts would have formed the bulk of their stars at z > 2 (e.g. Thomas et al. 2005). For galaxies at lower redshifts, we find that satellites are in average ∼1.5 Gyr younger than the massive galaxies at z = 0. This is contrary to the results presented by Pasquali et al. (2010) in the nearby universe, who did not find significant differences in the age of their satellite and central galaxies with stellar masses as the ones considered in this study. However, their classification of satellite and central galaxies lies on the identification of the most massive (or most luminous) group member as the central galaxy. Yang et al. (2005) and Skibba et al. (2011) showed that a significant fraction of central galaxies might actually be a satellite galaxy. Due to this potential uncertainty, the results by Pasquali et al. (2010) could be underestimating the true differences between the properties of centrals and satellites. Furthermore, massive galaxies at higher redshift (up to z ∼ 2) also present negative colour gradients (bluer in the outskirts of the galaxies, e.g. Moth & Elston 2002; Wu et al. 2005; McGrath et al. 2008; van Dokkum et al. 2010; Cassata et al. 2011; Guo et al. 2011; Gargiulo et al. 2012). This also points out to a picture of younger and/or more metal-poor galaxies forming the envelopes of massive galaxies after being accreted.
Are the imprints of the high-z satellites found in the outskirts of the present-day massive galaxies? Since we find that satellites are younger than their centrals at lower redshifts, we should expect an age gradient in these massive galaxies. We note, however, that due to the small difference at all redshifts between the satellites and the central galaxies, the age gradient (if any) would be very mild. Actually, an age gradient was suggested by Tortora et al. (2010) within the errors in their measurements, although other authors (e.g. Sánchez-Blázquez et al. 2007; Greene et al. 2012) found very shallow or no age gradients. From the well-known correlation of stellar mass (or velocity dispersion) with metallicity (e.g. Sánchez-Blázquez et al. 2007; Kuntschner et al. 2010; Spolaor et al. 2010; Tortora et al. 2010), our satellites should have lower metallicities than the massive galaxies, and therefore, negative metallicity gradients would be expected in massive galaxies as it is already found (e.g. Sánchez-Blázquez et al. 2007; Greene et al. 2012).
In addition, since our satellites have lower stellar masses than the central galaxies, a more extended star formation history is expected (Thomas et al. 2005). This would imply lower [α/Fe] values for the satellites than for the central galaxies. While massive elliptical galaxies in the nearby universe have high central values of [α/Fe] (∼0.4 dex; see e.g. Sánchez-Blázquez et al. 2007; Kuntschner et al. 2010; Greene et al. 2012), less massive galaxies have [α/Fe] ∼ 0.2 dex. For example, Spolaor et al. (2010) found [α/Fe] ∼ 0.15 ± 0.11 dex for elliptical galaxies with 3 × 10¹⁰ M⊙ (see also Kuntschner et al. 2010), and late-type galaxies could have even lower values (e.g. Ganda et al. 2007). Then, it is reasonable to assume that our satellites have similar abundance ratios, i.e. [α/Fe] ≲ 0.2 dex, and we would expect to find slightly negative gradients of [α/Fe] in the nearby massive galaxies. Recently, Greene et al. (2012) have shown that the stars in outer parts of their massive galaxies are metal-poor and [α/Fe]-enhanced (∼0.2 dex), as it would be expected if our satellite population is eventually accreted by their central galaxies, suggesting that the outer parts of these galaxies are built up via minor merging with a ratio of ∼1:10. The results presented here also support this scenario and they are a benchmark for future detailed studies of the outskirts of local massive galaxies.
We thank the anonymous referee for a constructive reading of the manuscript that helped us to improve the quality of the paper. Authors are grateful to Alexandre Vazdekis, Elena Ricciardelli and Ignacio Ferreras for fruitful discussions. This work has been supported by the ‘Programa Nacional de Astronomía y Astrofísica’ of the Spanish Ministry of Science and Innovation under grant AYA2010-21322-C03-02. PGP-G, GB and VV acknowledge support from the Spanish Programa Nacional de Astronomía y Astrofísica under grants AYA2009-10368, AYA2009-07723-E and CSD2006-00070. This work has made use of the Rainbow Cosmological Surveys Database, which is operated by the Universidad Complutense de Madrid (UCM).
