


Abstract
Our long-term photometric monitoring of southern nova-like cataclysmic variables with the 1.3-m Small and Moderate Aperture Research Telescope System (SMARTS) telescope found BB Doradus fading from V∼ 14.3 towards a deep low state at V∼ 19.3 in 2008 April. Here we present time-resolved optical spectroscopy of BB Dor in this faint state in 2009. The optical spectrum in quiescence is a composite of a hot white dwarf with Teff= 30 000 ± 5000 K and a M3–M4 secondary star with narrow emission lines (mainly of the Balmer series and He i) superposed. We associate these narrow profiles with an origin on the donor star. An analysis of the radial velocity curve of the Hα emission from the donor star allowed the measurement of an orbital period of 0.154 095 ± 0.000 003 d (3.698 28 ± 0.000 07 h), different from all previous estimates. We detected episodic accretion events which veiled the spectra of both stars and radically changed the line profiles within a time-scale of tens of minutes. This shows that accretion is not completely quenched in the low state. During these accretion episodes the line wings are stronger and their radial velocity curve is delayed by ∼0.2 cycle, similar to that observed in SW Sex and AM Her stars in the high state, with respect to the motion of the white dwarf. Two scenarios are proposed to explain the extra emission: impact of the material on the outer edge of a cold, remnant accretion disc, or the combined action of a moderately magnetic white dwarf (B1≲ 5 MG) and the magnetic activity of the donor star.
1 INTRODUCTION
The highest mass transfer rates among cataclysmic variables (CVs) are found in the nova-like class. Nova-likes are non- or weakly-magnetic CVs typically found in a state of high accretion rate with a hot, steady-state disc. As a consequence of the high accretion rate, the accretion disc in these systems is usually too bright to allow the detection of the white dwarf (WD) and the donor star, thus preventing dynamical studies aimed at measuring fundamental binary parameters from being done. Fortunately, nova-likes are occasionally caught in faint states, when their brightness can drop by ∼3–5 mag. Their observation during these low states (also known as VY Scl states) is the only practical opportunity to study the WDs and donor stars in these binary systems, especially the magnetic activity of the fast rotating donors, their solar-like activity cycles and the interplay with the WD magnetic field or a remnant accretion disc if present.
Of particular interest are the low states of nova-like CVs which gather in the 3–4 h orbital period regime. They lie just at the upper boundary of the period gap, where donor stars are predicted to become fully convective and orbital angular momentum loss via magnetic wind braking is expected to greatly diminish or even cease (e.g. Rappaport, Joss & Verbunt 1983). Furthermore, at least 50 per cent of all CVs in that period range belong to the SW Sex class (Rodríguez-Gil et al. 2007b), characterized by having large average mass transfer rates leading to very hot WDs (Townsley & Bildsten 2003; Araujo-Betancor et al. 2005; Townsley & Gänsicke 2009).
While it is generally accepted that mass transfer from the donor star to the WD through the inner Lagrangian (L1) point temporarily stops or is greatly decreased during a low state, the exact mechanism is not known. Livio & Pringle (1994) have proposed that accumulation of starspots in the vicinity of the L1 point may inhibit Roche lobe overflow. With the main mass transfer channel suppressed, the luminous accretion disc would not be fed as efficiently as in the high state. The survival of the accretion disc during the low state is still a matter of debate. Leach et al. (1999) and Hameury & Lasota (2002) have invoked a truncated accretion disc to explain the absence of dwarf nova outbursts during the decay to the low state. The former authors propose irradiation of the inner accretion disc by the hot WD as a means of keeping the internal parts of the disc in a hot, viscous state, while the latter suggest the total absence of the inner parts due to the action of a magnetic WD. Both scenarios suggest that the accretion disc conserves most of the mass it contained in the high state. However, observations show no contribution of accretion discs to the optical light of the binary system in the low state. In this regard, Gänsicke et al. (1999) studied the low state of TT Ari and found that any remnant accretion disc should be optically thin up to a distance from the WD of 12 WD radii and have an effective temperature less than 3000 K to be consistent with the low-state optical spectra. Similarly, the modelling of the spectra of MV Lyr in the low state reported in Linnell et al. (2005) did not require an accretion disc. In case a disc existed in MV Lyr during the low state it would be cooler than 2500 K to avoid discrepancy with their optical spectra.
Under low state conditions, only gas expelled from the donor star due to, for example, magnetic activity or the stellar wind would then be available for accretion (e.g. Hessman, Gänsicke & Mattei 2000). The presence of a WD with an intense magnetic field (B1≳ 1 MG) interacting with that of the donor star would lead to an alternative accretion channel. In fact, entanglement of the magnetic fields of both stars has been proposed to explain the line emission patterns observed in AM Her, the prototypical magnetic CV, during low states (see Kafka et al. 2008, and references therein).
It is known that about half the nova-likes which have experienced a low state (collectively named as the VY Sculptoris stars) are SW Sex stars (Rodríguez-Gil et al. 2007b). In addition, there is increasing evidence of the presence of magnetic WDs in this class of CV provided by the detection of variable circular polarization (Rodríguez-Gil et al. 2001, 2002; Rodríguez-Gil, Martínez-Pais & de La Cruz Rodríguez 2009), variable X-ray emission (Baskill, Wheatley & Osborne 2005) and emission-line flaring (Rodríguez-Gil et al. 2007b, and references therein). The potential similarities between the behaviour in the low state of the strongly magnetic polar CVs and the SW Sex stars led us to start a long-term monitoring campaign to search for low states in the latter. Once in the low state with a negligible contribution of an accretion disc, the component stars and any other accretion processes are open to study.
In this paper we present the results of such a study for the nova-like CV BB Doradus. BB Dor (= EC 05287−5857) was first identified as a CV in the Edinburgh–Cape Blue Object Survey (Stobie et al. 1987). Chen et al. (2001) classified BB Dor as a low-inclination VY Sculptoris star based on long-term photometry, which showed the system undergoing distinct low and high brightness states (ΔB∼ 2.5) as well as rapid variability at times. No coherent orbital modulation was found in their photometric light curves. However, a very uncertain orbital period of P= 0.107 ± 0.007 d was estimated from the analysis of radial velocities. Patterson et al. (2005), as part of a long-term photometric campaign to search for positive superhump CVs, reported a likely orbital period of 0.149 23 d, finding no signal detection near the period reported by Chen et al. (2001). Time-resolved optical spectroscopy of BB Dor in the high state (Schenker, private communication), although of poor quality, showed single-peaked Hα line emission with very broad wings extending up to ∼±2000 km s−1. This is a well-known characteristic of moderate to low inclination SW Sex stars (e.g. Casares et al. 1996; Rodríguez-Gil et al. 2001; Rodríguez-Gil, Schmidtobreick & Gänsicke 2007a). Finally, modelling of Far Ultraviolet Spectroscopic Explorer (FUSE) spectra of BB Dor taken long before the decline to the low state yielded an upper limit to the WD temperature of 40 000 K and a distance to the system of ∼650 pc (Godon et al. 2008).
2 LONG-TERM LIGHT CURVE
We have an ongoing photometric monitoring programme of a group of nova-like CVs which uses the 0.82-m IAC80 telescope on Tenerife, Spain, the 1.3-m Small and Moderate Aperture Research Telescope System (SMARTS) telescope on Cerro Tololo, Chile (operated by the SMARTS consortium), and the efforts of a large number of Spanish amateur astronomers. A total of six systems in the south and 70 northern systems are being monitored.
Fig. 1 presents 5.43 years of photometric monitoring of BB Dor in the interval of 2006 August–2012 January. A total of 424 V-band images were taken with the 2048 × 2048 pixel ANDICAM CCD camera on the 1.3-m SMARTS telescope. The exposure time was 60 s, but exposures of 120 s were obtained during the faintest state at V∼ 19.3. Each observation consists of two individual images, so two photometric data points are obtained every time the target is observed. The SMARTS consortium provided the images reduced with a pipeline based on iraf.1 The V-band light curve was calculated relative to the comparison star C1 (USNO–A2.0 0300−01740905). Conversion of its BA2.0 and RA2.0 magnitudes into the Landolt standard system yielded2 a V-band magnitude of 12.9 for C1. The nearby star USNO–A2.0 0300−01740223 was adopted as the check star (C2).
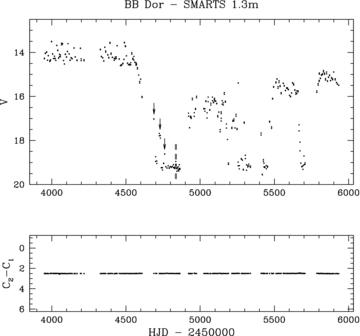
Top panel: long-term V-band light curve of BB Dor showing 5.43 years of photometric coverage with the 1.3-m SMARTS telescope on Cerro Tololo. The two vertical dashed lines mark the week of NTT spectroscopic observations on 2009 Jan 1–7. The arrows mark the brightenings observed during the decline to quiescence. Bottom panel: differential light curve of the comparison star C1 and the check star C2.
BB Dor started its decline towards the low state around 2008 April 13. In the 1.7 years prior to the onset of the low state the system was at an average magnitude of V≃ 14.2, showing quasi-periodic brightenings up to V≃ 13.5 every ∼35–40 d. A Bayesian generalization of the Lomb–Scargle periodogram (Bretthorst 1988) from all the photometric points taken before the first decline started was computed and is presented in Fig. 2. The probability density shows a peak at 0.027 45 d−1, corresponding to a period of 36.43 d. Further brightenings are also apparent during the decline phase, and even when the system settled into the low state (V∼ 19.3; see the arrows in Fig. 1). Similar quasi-periodic brightenings have been observed in other nova-like CVs in the high state with similar recurrence times (see e.g. Honeycutt, Robertson & Turner 1998; Hoard et al. 2000). The cause that produces this variability is still unknown, but mass transfer oscillations due to migration of starspots under the L1 point (Livio & Pringle 1994) and stunted dwarf nova outbursts (Honeycutt et al. 1998) are among the proposed mechanisms. With our photometric data alone we cannot go deeper into the origin of this variability in BB Dor in the high state. Simultaneous photometry and spectroscopy during several brightenings will definitely help uncover the mechanism involved.
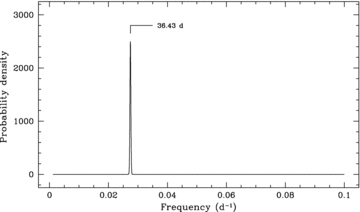
Bayesian periodogram of 1.7 years of V-band photometric measurements taken before the onset of the first observed decline to the low state.
After about one year in the low state BB Doradus started its recovery but got stuck in an ‘intermediate’ state at V∼ 16.5. Several re-brightenings and fadings took place during this phase before entering a second low state. At this second quiescence event BB Dor looked more active, exhibiting many excursions between the low and intermediate states as Fig. 1 shows. The system seems to be always fighting for accretion. In fact, a later, second attempt at returning back to the high state put the system at another intermediate state at V∼ 15.5, about 1 mag brighter than the previous intermediate level. At the time of writing this paper, BB Dor was recovering from a narrower, third low state. Note that the binary gets stuck in gradually brighter intermediate states on its way to the high state. Long-term light curves of other CVs experiencing low states can be found in the literature (see e.g. Hoard et al. 2004; Honeycutt & Kafka 2004) for comparison.
3 SPECTROSCOPIC OBSERVATIONS AND THEIR REDUCTION
We obtained time-resolved spectra with the ESO Faint Object Spectrograph and Camera (EFOSC2) on the 3.58-m New Technology Telescope (NTT) on La Silla. The slit width was fixed at 0.7 arcsec. The log of observations can be found in Table 1.
Log of the time-resolved spectroscopy.
| Night | Grism | No. of spectra | Exp. time (s) | Coverage (HJD − 245 4830) |
| 2009 Jan 1 | Gr 18 | 29 | 600 | 3.6135–3.8559 |
| 2009 Jan 2 | Gr 18 | 20 | 900 | 4.5637–4.8405 |
| 2009 Jan 3 | Gr 18 | 7 | 900 | 5.8043–5.8692 |
| 2009 Jan 4 | Gr 18 | 24 | 900 | 6.5541–6.6299 |
| 6.6811–6.8501 | ||||
| 2009 Jan 5 | Gr 18 | 15 | 900 | 7.5925–7.6683 |
| 7.8093–7.8725 | ||||
| 2009 Jan 6 | Gr 18 | 24 | 900 | 8.5834–8.8629 |
| 2009 Jan 7 | Gr 18 | 25 | 900 | 9.5924–9.8653 |
We processed all the images using standard debiasing and flat-fielding techniques. The one-dimensional spectra were subsequently extracted using conventional optimal extraction techniques in order to optimize the signal-to-noise ratio of the output (Horne 1986). Wavelength calibration was performed in molly3 by means of arc lamp spectra frequently taken to guarantee an accurate wavelength solution. The spectra were then flux calibrated using molly.
4 THE VARIABLE SPECTRUM OF BB DOR IN QUIESCENCE
4.1 Discovery of intermittent accretion events
The very first spectrum of the 7-day NTT run was taken with grism 11 (λλ3380 − 7520) in order to cover a wide wavelength range. The spectrum of BB Dor showed strong Balmer and He i emission lines on top of a blue continuum. He iiλ4686 and Bowen blend emission lines were also observed, indicating an excitation level too high for low state conditions. A second spectrum displayed the same features. The average of these two spectra is shown in Fig. 3. We switched immediately to grism 18 for better spectral resolution. A quick extraction of the first two spectra showed extended wings in the Hα and Hβ emission lines. The intensity of He iλ5876 was also increasing. These strong lines were observed in the next eight 900-s spectra, but their intensity started to decrease in the next two. The remaining spectra until the end of the first night contained much narrower Hα, Hβ and weak He iλ5876 lines characteristic of emission from the donor star (see Schmidtobreick et al. 2012, for a discussion on the narrow emission lines based on higher resolution VLT/FORS spectra), and absent He iiλ4686 and Bowen blend emission. We interpret this behaviour as sporadic accretion events in the system. Remarkably, some of the accretion events observed lasted for only one 900-s spectrum, indicating a fast transition between narrow and broader, stronger emission lines. A total of 11 accretion events were recorded during the whole run (see Table 2). Fig. 4 shows the time evolution of the accretion event that occurred on 2009 Jan 5, while Fig. 5 shows the average of all quiescent spectra compared with the average of all the spectra taken during the recorded accretion events.
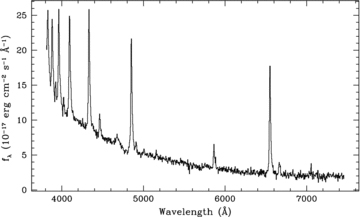
Average of the two 900-s spectra of BB Dor taken with grism 11 at the very beginning of the NTT run. Note the strong Balmer and He i emission lines with extended wings and the presence of He iiλ4686+Bowen blend emission, indicating accretion in the system.
List of accretion events.
| Date | ut | Notes |
| 2009 Jan 2 | 02:12:18a | |
| 02:42:32–04:43:18 | ||
| 08:18:31–08:31:36b | ||
| 2009 Jan 3 | 06:59:49 | Single spectrumc |
| 2009 Jan 4 | 01:51:12 | Single spectrum |
| 2009 Jan 5 | 06:18:37–08:23:18b | |
| 2009 Jan 6 | 07:24:32–08:42:27b | |
| 2009 Jan 7 | 05:13:05 | Single spectrum |
| 06:43:35–06:59:10 | ||
| 07:31:11–08:41:40b | ||
| 2009 Jan 8 | 07:27:16–08:45:11b |
aAverage of the two only spectra taken during the accretion event.
bEnd of the night.
cSingle accretion spectrum in between two quiescent ones. Quick accretion event.
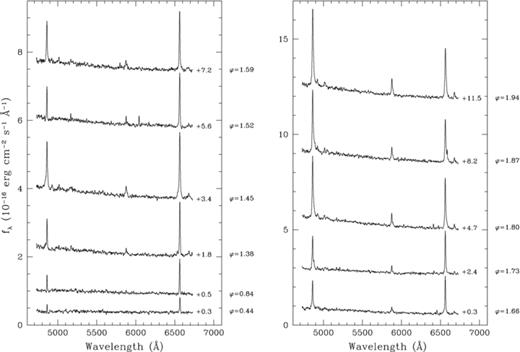
Evolution of the accretion event observed during the fourth night of the run. Time runs from bottom to top and from left to right. ϕ is the orbital phase; 0.01 cycle corresponds to 2.2 min. This shows the rapid variability of the lines. The first spectrum at ϕ= 0.44 shows how the emission lines look like before the onset of the accretion event. All the spectra were shifted in flux by the quentity shown to their right.
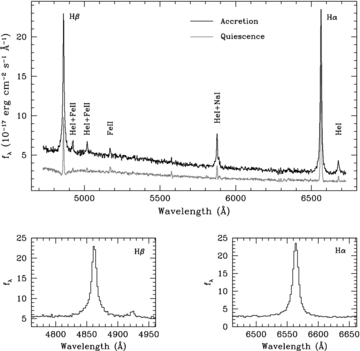
Average of all quiescent spectra (grey) compared with the average of all the spectra taken during the accretion events (black).
Careful inspection of the average spectra presented in Fig. 5 reveals the presence of further narrow emission lines. The strongest of them is the Fe iiλ5169 line, whose presence indicates that the He iλ4922 and He iλ5016 emission lines are likely blended with Fe iiλ4924 and Fe iiλ5018, respectively. The line at 5577 Å is the remnant of the subtraction of the O i sky line. In addition, Na iλ5890 emission is observed. We will discuss the origin of the emission lines in BB Dor in Section 6.
4.2 Spectrum modelling in quiescence
Fig. 6 shows the average spectrum of BB Dor in quiescence, that is, when the system is not undergoing an accretion event, constructed from four spectra obtained with grism 5. The spectra of the WD and the donor star are apparent. The narrow emission lines of the Balmer series and He i are also visible. In addition, the quiescent spectra taken with grism 11 (λλ3380–7520) showed no significant He iiλ4686 or Bowen blend emission. A WD+M-dwarf composite fit resulted in a WD temperature of 30 000 K, a mid-M (likely M3–M4) spectral type for the donor star, and a distance of 1500 ± 500 pc. Fig. 7 (left-hand panel) shows the normalized Hβ profile plus non-magnetic models for WD temperatures of (from bottom to top) 25000, 35000 and 45000 K. The limited signal-to-noise ratio of our NTT blue spectra forces us to give a conservative estimate of 30000 ± 5000 K for the WD temperature, a value in agreement with the results of Godon et al. (2008).
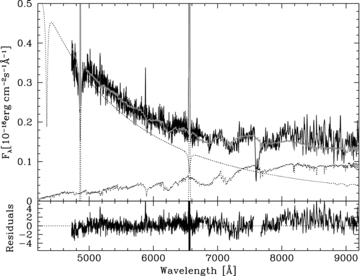
Average spectrum of BB Dor in quiescence (solid line) fitted with WD + M-dwarf templates + emission (dotted lines). The grey line is the best composite fit (see text for details).
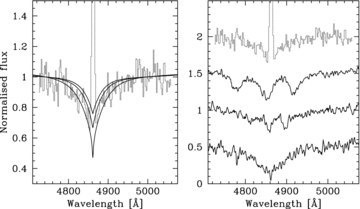
Left-hand panel: average Hβ profile in quiescence plus superimposed WD spectrum models with effective temperatures of 25 000, 35 000 and 45 000 K (from bottom to top). Right-hand panel: comparison of the BB Dor average Hβ absorption (top) with the Hβ absorption profiles of three magnetic WDs with B1 of 10.8, 5 (showing the narrow absorption characteristic of Zeeman splitting) and 4.1 MG (from top to bottom; see text for details).
There is evidence that the WDs in some SW Sex stars are magnetic, based on circular polarimetry observations (Rodríguez-Gil et al. 2001, 2002, 2009). However, the low levels of circular polarization observed suggest WD magnetic field strengths of the order or lower than those observed in the intermediate polar CVs. In order to check for any Zeeman splitting in the quiescent spectra of BB Dor we compare the normalized Hβ absorption profiles of BB Dor (the average of all quiescent spectra) and three magnetic WDs (right-hand panel of Fig. 7): SDSS J085550.67+824905.1 (Teff= 25 000 K, B1= 10.8 MG; Külebi et al. 2009); SDSS J080502.28+215320.5 (Teff= 28 000 K, B1= 5 MG; Vanlandingham et al. 2005) and SDSS J154305.67+343223.6 (Teff= 25 000 K, B1= 4.1 MG; Külebi et al. 2009). We can clearly rule out WD magnetic fields as strong as 10 MG, but could certainly have B1≲ 5 MG undetected due to the poor signal-to-noise ratio. Better quality blue spectra are needed to check for Zeeman splitting in the low state.
5 THE ORBITAL PERIOD OF BB DOR
Because the emission lines show significant changes during the accretion events, we treated the spectra taken during quiescence and accretion separately. Only the spectra taken with grism 18 were measured for radial velocities. Before measuring the velocities, the spectra were first re-binned into a common velocity scale and then continuum-normalized. Radial velocities of the quiescent Hα emission profiles were measured by cross-correlation with a single-Gaussian template with a full width at half-maximum (FWHM) of 400 km s−1. For the radial velocities of the emission line wings in the spectra taken during the accretion events, we cross-correlated with double-Gaussian templates as described in Schneider & Young (1980). In this case the Gaussian FWHM was 200 km s−1, while the separation between the two Gaussians was fixed at 1600 km s−1.
With the aim of measuring the orbital period of BB Dor we subjected the Hα radial velocities obtained for the quiescent spectra to a period analysis using the Schwarzenberg-Czerny (1996) analysis of variance method implemented in midas. The resulting periodogram is presented in Fig. 8. The highest peak is found at a frequency of 6.49 d−1, which corresponds to a period of approximately 3.70 h. A sine fit to the quiescent radial velocities provided: P= 0.154 095 ± 0.000 003 d (3.698 28 ± 0.000 07 h) and T0(HJD) = 245 4833.7779 ± 0.0003, where T0 is the time of blue-to-red crossing of the velocities. Our measurement of the orbital period differs from the one reported in Patterson et al. (2005) of 0.149 23 d, so their interpretation of the stable photometric signals should be revised. The strongest signal presented in their fig. 7 (0.149 23 d) may now be associated with a negative superhump, while the other one at 0.163 24 d may be a positive superhump. This finding may have consequences on the calibration of the superhump excess (ɛ)–mass ratio (q) relationship for superhumpers, because BB Dor was believed to have the most extreme ɛ at 0.094. With our new value of the orbital period the superhump period excess would be revised to ɛ= 0.0593 ± 0.0005.
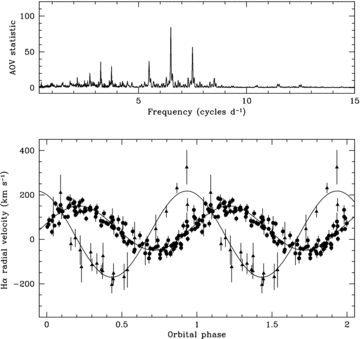
Top: analysis of variance (AOV) periodogram of the Hα radial velocities measured from the quiescent spectra only. Bottom: Hα radial velocities in quiescence (dots) and during the accretion events (triangles) folded on the orbital period. The solid lines are the respective best sine fits (see Table 3). The radial velocity curve of the line wings (triangles) is delayed by 0.18 cycle with respect to the expected motion of the WD, peaking in the blue at orbital phase ∼0.45, which is a defining characteristic of the SW Sex stars in the high state. No phase-binning has been applied. A full cycle has been repeated for clarity.
5.1 A SW Sex-like S-wave during the accretion events
As we have already shown, the emission lines get much stronger and their profiles develop extended wings during the accretion events. In fact, we witnessed a change from a quiescent spectrum to an accretion one and back in as quick as 15 min or less (see Table 2). During an accretion event the excitation level is increased as well, producing He iiλ4686 and Bowen blend emissions (see Fig. 3). As the phasing of the radial velocity curve of the Hα emission-line wings indicates (see Fig. 8), the extra emission likely originates on the WD side of the binary system, but its velocity amplitude is almost twice the amplitude observed for the Hα emission from the donor star (see Table 3). Remarkably, the wing velocities are delayed by 0.18 cycle with respect to the expected motion of the WD and reach their maximum in the blue at ϕ≃ 0.45. These features are well-known characteristics of the emission S-waves observed both in the SW Sex stars (see e.g. Rodríguez-Gil et al. 2007b) and in the strongly magnetic polar CVs (i.e. AM Her stars) in the high state (e.g. HU Aqr and V2301 Oph; Schwope, Mantel & Horne 1997; Šimić et al. 1998).
Folded radial velocity fits parameters.
| γ (km s−1) | K (km s−1) | ϕ0 | |
| Quiescence | 51 ± 1 | 99 ± 2 | – |
| Accretion (wings) | 24 ± 8 | 194 ± 10 | 0.18 ± 0.01 |
| γ (km s−1) | K (km s−1) | ϕ0 | |
| Quiescence | 51 ± 1 | 99 ± 2 | – |
| Accretion (wings) | 24 ± 8 | 194 ± 10 | 0.18 ± 0.01 |
Folded radial velocity fits parameters.
| γ (km s−1) | K (km s−1) | ϕ0 | |
| Quiescence | 51 ± 1 | 99 ± 2 | – |
| Accretion (wings) | 24 ± 8 | 194 ± 10 | 0.18 ± 0.01 |
| γ (km s−1) | K (km s−1) | ϕ0 | |
| Quiescence | 51 ± 1 | 99 ± 2 | – |
| Accretion (wings) | 24 ± 8 | 194 ± 10 | 0.18 ± 0.01 |
6 THE ORIGIN OF THE EMISSION IN QUIESCENCE
The narrow emission lines observed in BB Dor during the low state have a likely origin on the donor star, but whether they form solely via irradiation of the inner face of the donor by the WD or there are other sources of Hα emission is unclear. In Schmidtobreick et al. (2012) we report the observation of two Hα satellite emission lines which clearly detach from the line core. Unfortunately, the spectral resolution is not good enough to resolve them if present in our NTT spectra. Armed with the ephemeris calculated in the previous section we can probe the origin of the emission lines by means of their radial velocity and equivalent width (EW) curves. We will first focus on the Fe iiλ5169 emission line. In order to maximize its signal-to-noise ratio we first binned all the quiescent spectra into 10 phase intervals. Then, we measured the radial velocities of Fe iiλ5169 by cross-correlation with a Gaussian template with FWHM = 400 km s−1. The resulting radial velocity curve is presented in Fig. 9. The orbital phase of the Fe iiλ5169 radial velocity curve is consistent with that of the quiescent Hα line (velocity points marked as triangles in Fig. 8). A very similar radial velocity curve is obtained when the phase-binned Fe iiλ5169 profiles observed during the accretion events only are measured. This indicates an origin on the donor star side of the binary system for the Hα and Fe iiλ5169 emission lines both in quiescence and during the accretion events.
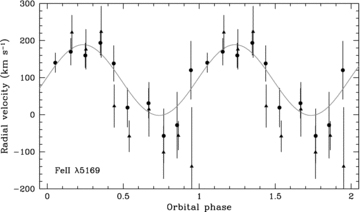
Radial velocity curves of the Fe iiλ5169 emission line. Both the quiescent spectra (dots) and the accretion spectra (triangles) were averaged into 10 orbital phase bins to maximize the signal-to-noise ratio of the line profile. The grey curve is the best sine fit to the quiescent velocities only. A full cycle has been repeated for clarity.
If formed on the inner side of the donor star as expected for irradiation, the EW curve should have a maximum close to orbital phase 0.5 and a minimum around 0. To compare the behaviour of the Hα and Fe iiλ5169 lines we constructed their EW curves, which are shown in Fig. 10. The EW was measured only for the line cores. Phase binning was applied to both Fe iiλ5169 (10 bins) and Hα (20 bins). Unlike Hα, the Fe iiλ5169 EW curve clearly shows a maximum at phase 0.5. In addition, the line almost vanishes at phase 0. The EW curve obtained from the accretion spectra is very similar as can be seen in Fig. 10. This also supports the adopted T0 in Section 5, that is, the narrow emission lines come from the secondary star. This behaviour clearly points to an irradiation origin for the Fe iiλ5169 emission. On the other hand, the Hα line remains strong for the whole orbit with a minimum EW at phase ∼0.4 and a maximum at ∼0.9. We observed a similar behaviour in the eclipsing SW Sex star HS 0220+0603 (Rodríguez-Gil et al., in preparation) while comparing the near-IR Ca ii triplet and the Hα emission lines. The Ca ii lines almost completely vanish at phase zero, with a maximum half an orbit later as expected for an irradiation origin. In contrast, the Hα emission line was visible along the whole orbit with a K-velocity consistent with an origin at the inner Lagrangian point but with no radial velocity delay with respect to Ca ii. The observation of significant Hα emission at zero phase in a high inclination system like HS 0220+0603 (when the irradiated side is hidden from view) suggests the presence of extra Hα emission with an origin either in the chromosphere of the donor star or in material above the orbital plane.
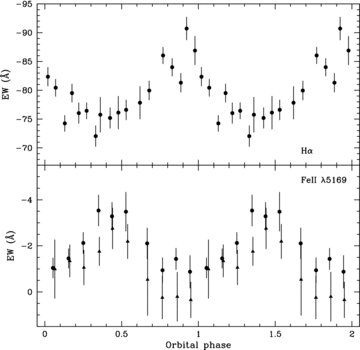
Top panel: EW curve of the Hα emission line in quiescence. Bottom panel: EW curve of the Fe iiλ5169 emission line in quiescence (dots) and during the accretion events (triangles). A full cycle has been repeated for clarity.
7 DISCUSSION
7.1 The origin of the extra emission during the accretion events
We have shown that BB Dor shows sporadic accretion activity during the low state which translates into significant broadening of the narrow, mainly Balmer and He i emission lines, and an increase of the excitation level which produces He iiλ4686 and Bowen blend emissions and a bluer continuum. The radial velocity curve of the Hα extended wings developed during these accretion events (see Fig. 8) was constructed from accretion spectra widely spread in time, indicating that its phasing is stable. This means that the material shed by the donor star produces the high-velocity emission at a fixed structure in the system. In explaining this behaviour we shall first review what is known about flaring activity in the polar CVs in the low state, for the simple reason that an accretion disc is never present in those systems, so any gas leaving the donor star would be magnetically accreted on to the WD.
Flares during a low state were first observed in the ultraviolet (EUVE) in the polar CV QS Tel (Warren et al. 1993). AM Her itself also shows variable X-ray activity during the low state (de Martino et al. 1998). Similar flaring activity was later detected in the eclipsing polar UZ For with XMM–Newton (Still & Mukai 2001). The emission during the registered 1.1-kilosecond burst is consistent with the flares typical of rapidly rotating M dwarfs. In addition, the electron temperature is also characteristic of coronal activity on late-type stars. However, the detection of the same flare also in the ultraviolet suggests that the event is probably not coronal in origin, with accretion on to the WD a more likely origin. Pandel & Córdova (2002) also observed transient events in X-rays and ultraviolet from UZ For in the low state with XMM–Newton, with the largest one lasting ∼900 s. The cause is believed to be accretion of material on to the main accretion pole of the magnetic WD as the flare started with the eclipse egress of the main accretion region. Pandel & Córdova link the flaring behaviour of UZ For during the low state to an intermittent increase of the mass transfer due to magnetic stellar activity on the donor star. They show that the total mass accreted is consistent with the mass ejected by the stellar flare. Similar behaviour has been observed in other polar CVs such as VV Pup and V393 Pav, attributed to either stellar flares or coronal mass ejections (Pandel & Córdova 2005). Finally, AM Her experienced a flare event with a duration of ∼4 kiloseconds recorded in the 0.5–10 keV energy range by Suzaku (Terada et al. 2010). Thus, there is observational evidence of accretion of material expelled by the secondary star due to its magnetic activity on to the poles of the WDs in polar CVs in the low state.
The same phenomenology has also been observed in the optical. Latham, Liebert & Steiner (1981) observed much broader, stronger emission lines during an accretion event of AM Her. Mason et al. (1994) also reported accretion events in AM Her that may have lasted a few minutes only, as observed in BB Dor. In addition, Gänsicke et al. (1999) found a variable level of activity during the 1982–1985 low state of the nova-like CV TT Arietis, with spectra typical of almost zero accretion on one night, revealing the WD and the secondary star, and spectra with strong emission lines on another night. Unfortunately, the data were not good enough to look at that variability on shorter time-scales. All of this indicates that this behaviour is probably common to low states in both polar and nova-like CVs.
To summarize, stellar flares can provide material for accretion in AM Her stars in the low state. Similar flaring activity in BB Dor prompts us to suggest that this behaviour is caused by material coming from the donor star which is later accreted. As already mentioned, Schmidtobreick et al. (2012) discovered two Hα satellite emission lines in BB Dor in the low state which we link to the magnetic field of the secondary star, with a likely origin in fixed magnetic structures such as solar-like prominences concentrated on the L1 point. In this regard, a prominence on the secondary star close to the L1 point has also been invoked to explain the Doppler tomograms of the N vλλ1239,1243 UV emission doublet of AM Her itself in the high state (Gänsicke et al. 1998). Such prominences have been reported before in the dwarf novae SS Cygni and IP Pegasi in outburst (Steeghs et al. 1996).
7.2 How is the gas pumped towards the white dwarf during the low state flares?
Kafka et al. (2005) detected flaring events in the V-band light curves taken during the 2004 low state of AM Her concentrated at orbital phases 0.25/0.75, which coincide with the radial velocity maxima of satellite emission lines observed in Hα (Kafka et al. 2005). The Hα trailed spectra diagrams presented in Kafka et al. (2008) clearly show the satellite emissions with a K-velocity almost tripling that of the Hα core. Under the assumption that the two satellite emissions do not cross each other Kafka et al. argue that they may originate in large coronal loops on the donor star. As mentioned, we (Schmidtobreick et al. 2012) have detected and resolved the same Hα satellite emissions in BB Dor in the low state. It is the first detection of such satellites in an SW Sex system in the low state. Our VLT target of opportunity time-resolved spectroscopy revealed two crossing narrow satellite emissions having very similar velocity amplitude but different phasing, with their respective maximum excursions to the blue happening at orbital phases ∼0.60 and ∼0.85. A similar phasing can be seen in the Hα trailed spectra diagrams presented in fig. 4 of Kafka et al. (2008), suggesting a common origin.
Kafka et al. (2008) suggested that mass transfer in AM Her during the low state may be controlled by magnetic field lines associated with both the WD and the donor star. Whatever mechanism produces the satellite emission, the observed similarities between AM Her and BB Dor in the low state naturally lead us to suggest a common process. But the WD in BB Dor is not known to be strongly magnetic. We have shown in Section 4.2 that the WD in BB Dor, if magnetic at all, would have a field strength of B1≲ 5 MG. In explaining the nature of the satellite lines, we are inclined to invoke an origin linked solely to the magnetic activity of the secondary star in agreement with Schmidtobreick et al. (2012), but the presence of a magnetic WD in BB Dor cannot be ruled out at the moment and other mechanisms should be investigated.
As already shown, BB Dor exhibits several of the defining characteristics of the SW Sex stars in the high state. The typical 0.2-cycle phase delay observed in the Hα radial velocity curve of BB Dor in the low state during the sporadic accretion events is quite illustrative. If the WD is moderately magnetic (B1∼ 1–5 MG), accretion of the material provided by the donor star via prominences or coronal mass ejections concentrated around the L1 point may proceed along the magnetic field lines. This may explain the presence of high-excitation lines like He iiλ4686 and the bluer continuum during the accretion events. In fact, a strong flare detected with the Hubble Space Telescope in the ultraviolet in AM Her during a low state (Saar, Kashyap & Ringwald 2006), which was placed at a region close to the L1 point, followed by an enhancement of the WD continuum observed almost simultaneously, causally linked the stellar activity on the donor star and the magnetic accretion event. Faster, time-resolved spectroscopy and photometry of BB Dor and other nova-like CVs in the low state would help solve whether a magnetic WD is present or not. The spin of the presumably asynchronously rotating WD would modulate the accretion on to the magnetic pole (or poles) during an accretion event, leading to photometric and emission-line flux variability.
However, a similar phase delay and high amplitude of the radial velocities may be produced if the extra emission originates at the hotspot region of a cold, remnant accretion disc (see Section 1) after each sporadic impact of secondary star material. Time-resolved spectroscopy of accretion events in eclipsing systems in the low state can give the answer. This scenario can be ruled out if the extra emission does not disappear when the secondary star eclipses the hotspot region.
8 CONCLUSIONS
The main results of this work can be summarized as follows.
5.43 years of SMARTS V-band photometric monitoring of the SW Sex star BB Doradus caught the system about to enter a low state phase with three distinct fadings down to V∼ 19.3. The two recoveries from minimum never put the system brightness back to the high state level. BB Dor always got stuck in an intermediate state before fading towards a new minimum. The brightness at the intermediate state is slowly increasing with time.
Brightenings of ∼0.7 mag repeating on a period of 36.43 d were observed from the start of the photometric monitoring campaign until the onset of the first low state (a ∼500 d interval). We also observe these during the decline phase and even after the onset of the low state. Although they may be related to variations of mass transfer from the donor star, we cannot address any conclusion with the photometric data alone. Coordinated photometric and spectroscopic observations during the brightenings can help understand their origin.
The mass transfer from the donor star is not completely quenched in the low state. We discovered sporadic accretion events in the faint state at V∼ 19.3 during which the narrow Balmer and He i emission lines from the donor star get much stronger and develop high velocity wings, and He iiλ4686 and Bowen blend emissions are observed. A total of 11 accretion events were recorded, with the quickest one lasting only ∼900 s. During the accretion episodes the Hα emission line shows an SW Sex-like S-wave with the typical ∼0.2-cycle delay with respect to the expected motion of the WD.
BB Dor is composed of an accretion-heated WD with an effective temperature of 30 000 ± 5000 K (in agreement with the results of Godon et al. 2008) and a M3–M4 donor star. The distance to the system is estimated to be 1500 ± 500 pc.
We measured an accurate orbital period of 0.154 095 ± 0.000 003 d (3.698 28 ± 0.000 07 h) for the first time from Hα radial velocities during quiescence. With this new value of the orbital period BB Dor no longer holds the most extreme superhump period excess.
Narrow Fe iiλ5169 line emission originating on the donor star is shown to have an irradiation origin, while irradiation is not the only Hα line emission source. Stellar activity on the donor star in the form of Hα satellite lines (Schmidtobreick et al. 2012) and chromospheric emission may play an important role.
We attributed the events of enhanced line emission to sporadic accretion. It can be said that the system is always fighting to recover the high mass transfer rate it had in the high state. One possible scenario is accretion on to a discless, magnetic WD after coupling of material provided by the donor star to the WD magnetosphere. However, our search for Zeeman splitting in the quiescent Hβ absorption line was unsuccessful and places an upper limit to the WD magnetic field strength of B1≲ 5 MG. The similarities with the strongly magnetic AM Her stars in the low state suggest that the material is likely provided by stellar magnetic activity on the donor. A second scenario requires the impact of material sporadically provided by the secondary star on to a cold, remnant accretion disc at approximately the hotspot location. Both scenarios can explain the radial velocity phase delay of the enhanced line wings produced during the discrete accretion events.
We thank the anonymous referee for comments that improved this manuscript. The use of Tom Marsh’s molly package is gratefully acknowledged. PRG thanks the ESO/Santiago Visiting Scientist Program for the approval of a scientific visit during which part of this work was completed. Partially funded by the Spanish MICINN under the Consolider-Ingenio 2010 Program grants CSD2006-00070: First Science with the GTC and CSD2009-00038: ASTROMOL. We are indebted to the SMARTS service observers Juan Espinoza, David González, Manuel Hernández, Rodrigo Hernández, Alberto Miranda, Alberto Pasten, Mauricio Rojas, Jacqueline Serón, Joselino Vásquez and José Velásquez.
Footnotes
See http://www.astro.yale.edu/smarts/ANDICAM/data.html for details on the reduction pipeline.
REFERENCES
