


Abstract
We selected a sample of 437 BL Lac objects, taken from the RomaBZCat catalogue, for which spectroscopic information and Sloan Digital Sky Survey (SDSS) photometry are available. We propose a new classification of BL Lacs in which the sources’ type is not defined only on the basis of the peak frequency of the synchrotron component in their spectral energy distribution (types L and H), but also on the relevance of this component with respect to the brightness of the host galaxy (types N and G, for nucleus- or galaxy-dominated sources). We found that the SDSS colour index u−r = 1.4 is a good separator between these two types. We used multiband colour–colour plots to study the properties of the BL Lac classes and found that in the X-ray to radio flux ratio versus u−r plot most of the N (blue) sources are located in a rather narrow strip, while the G (red) sources are spread in a large area, and most of them are located in galaxy clusters or interacting systems, suggesting that their X-ray emission is not from a genuine BL Lac nucleus but it is related to their environment. Of the about 135 sources detected in the γ rays by Fermi Gamma-ray Space Telescope, nearly all belong to the N-type, indicating that only this type of sources should be considered as genuine BL Lac nuclei. The J−H, H−K plot of sources detected in the Two-Micron All-Sky Survey (2MASS) catalogue is consistent with that of the ‘bona fide’ BL Lac objects, independently of their N or G classification from the optical indices, indicating the existence in G-type sources of a K-band excess possibly due to a steep, low frequency peaked emission which deserves further investigations. We propose to use these colour plots as a further tool for searching candidate counterparts of newly discovered high-energy sources.
1 INTRODUCTION
The definition of BL Lac objects is somewhat ambiguous and changed depending on the selection criteria adopted in the surveys in which they were found. According to the early review papers by Stein, ODell & Stritmatter (1976) and Angel & Stockman (1980), BL Lacs are active galactic nuclei (AGN) highly variable and linearly polarized in the radio band and with featureless optical spectra. When emission lines were detected in a few BL Lac sources, the definition was modified to include the presence of these spectral features, but their rest-frame equivalent width (EW) was limited to be lower than 5 Å (Stickel et al. 1991; Stocke et al. 1991). Another change of the BL Lac definition was introduced after the discovery in the Einstein Medium Sensitivity Survey (EMSS) of the so-called X-ray selected BL Lacs, which usually exhibit a low radio brightness (Stocke et al. 1991). Optical counterparts of this type of BL Lacs had optical spectra either dominated by a strong blue continuum or exhibiting a typical elliptical galaxy spectrum, but with a low Ca H&K break contrast (see Fig. 1). This is defined by the ratio C= (F−−F+)/F+, where F− and F+ are the mean flux densities measured in small ranges (200 Å) at wavelengths just lower and higher than that of the break, respectively. Stocke et al. (1991) introduced this parameter for BL Lac selection and assumed the upper threshold value of 0.25, quite lower than that observed in normal elliptical galaxies (∼0.5), combined with the absence of emission lines having EW > 5 Å. It should be also able to discriminate BL Lacs from normal galaxies exhibiting a significant X-ray emission of non-nuclear origin, as, for example, close or inside a surrounding cluster. The threshold value of the Ca H&K contrast was afterwards increased to 0.4 by Marchã et al. (1996). Landt, Padovani & Giommi (2002) proposed that the large differences in the Ca H&K contrast are essentially due to the jet orientation to the line of sight and that sources having 0.25 < C < 0.4 should be considered as a bridge between BL Lacs and Fanaroff–Riley type I (FR I) radio galaxies.
![SDSS spectra of three BL Lac objects showing different ratio of the nuclear to galaxian luminosities. From top to bottom: BZB J1120+4212 [(u−r)obs= 0.4], BZB J0909+3105 [z= 0.272, (u−r)obs= 1.3] and BZB J0751+2913 [z= 0.194, (u−r)obs= 2.9]. Red lines, corresponding to the mean flux level in a 400 Å wide wavelength interval redwards of the Ca H&K break, are used to distinguish N- and G-type BL Lac objects.](https://oup.silverchair-cdn.com/oup/backfile/Content_public/Journal/mnras/422/3/10.1111_j.1365-2966.2012.20782.x/1/m_mnras0422-2322-f1.jpeg?Expires=1750034148&Signature=iJ3wvqa6wOR7xozbAWAcHeHTkt0~gWEhD6jPSEFvt-pMZAu-PvvV0EvZcmnn0YzAhWggxuzBLlk7O735aqg~HUjByS9pJc~DV~MX90sdgo-wOpd9hf187e7jMVbonCClt9TAJylDTgXwSMePWjYVMn~oNEpAul63nwfD1HiU07G7CbA7McM~i1CnTUvIP2rzmI-Y5Y45fYvF4HN2q5H9wHrEHk94VLvEwQiwK93X8j39llT4vyRhs5BQnAhx21CK~1WP1CPOApBsBYKiTDrxFa2DQ9N1ObSZye1o~1AjkkAM56Yzan83TEgJZhy01WZ0iGCMg2sUOG~fIRa9OWCNhw__&Key-Pair-Id=APKAIE5G5CRDK6RD3PGA)
SDSS spectra of three BL Lac objects showing different ratio of the nuclear to galaxian luminosities. From top to bottom: BZB J1120+4212 [(u−r)obs= 0.4], BZB J0909+3105 [z= 0.272, (u−r)obs= 1.3] and BZB J0751+2913 [z= 0.194, (u−r)obs= 2.9]. Red lines, corresponding to the mean flux level in a 400 Å wide wavelength interval redwards of the Ca H&K break, are used to distinguish N- and G-type BL Lac objects.
Some recent surveys, aimed to the identification of new BL Lac objects or candidates, are essentially based on the application of these criteria to a large population of extragalactic sources and provided lists of several hundredths of objects. The Radio Optical X-ray ASDC (ROXA) blazar survey (Turriziani et al. 2007), for instance, considered sources detected in all the radio, optical and X-ray bands, while Plotkin et al. (2008, 2010) searched BL Lac objects using Sloan Digital Sky Survey (SDSS) spectral data combined with the accurate location of radio sources from the Faint Images of the Radio Sky at Twenty-cm (FIRST) survey (White et al. 1997). A direct application of these criteria, without an accurate analysis of the sources’ properties and environment, could drive to consider any AGN exhibiting a weak non-thermal emission, likely originating from the nucleus, with an absence of emission lines (or a possible occurrence with low EWs) as a genuine BL Lac object. As a consequence, considering also the possibility to have a spurious association due to large error boxes, as those typical at high energies, the knowledge of the BL Lac properties, luminosity functions and cosmological evolution may be rather uncertain. This problem becomes more relevant when associations are obtained by means of automatic procedures, often based on non-homogenous and incomplete data bases. It is important, therefore, to perform an extended comparative analysis of the results of recent surveys to establish safe criteria for defining the BL Lac characteristics.
In this paper we study a sample of BL Lacs extracted from the Roma-BZCAT catalogue of blazars (Massaro et al. 2009, 2011a) and analyse their population properties using a direct approach based on the flux ratios in different frequency ranges. We are able to derive some criteria which improve the efficiency in discriminating genuine BL Lacs from other AGN. These criteria can be also applied to gain confidence in the search of possible counterparts of high-energy sources, whose large error boxes can provide a high probability for spurious associations.
2 SELECTION OF BL L ac SAMPLES
The master sample of BL Lac objects used in our classification study was extracted from the third edition of the Roma-BZCAT.1 This catalogue is a compilation of literature data on blazars and candidates mainly aimed to the search of possible counterparts of high-energy sources. It provides a rich list of BL Lac objects, selected according to the criteria currently adopted in the literature. BL Lac objects are divided into two groups on the basis of the availability of their optical spectra (or of a detailed description). Sources claimed in the literature as BL Lacs, without a published spectrum or a good spectral information, are classified as ‘candidates’. These candidates, therefore, are not included in the sample because spectra are necessary to evaluate the brightness ratio between the nuclear and galaxian components.
Multiband photometric data are also useful for evaluating the relevance of the nuclear emission with respect to the host galaxy, particularly at frequencies where the galaxian contribution is much different from the nuclear one. A homogeneous collection of photometric data, including the u band, is available only for sources in the region of the sky covered by the SDSS (for the DR7 version, see Abazajian et al. 2009), while other photometric data in the Johnson–Morgan U band are reported in the literature only for a rather small number of bright and well-studied objects. We decided, therefore, to include in our master sample only those BL Lac objects with available SDSS photometric data. The two well-known and very close BL Lac objects, Mrk 421 and Mrk 501, were excluded from the sample because the apparent size of their galaxies is too large and aperture effect on the photometric data would modify the colours. We thus obtained a number of 683 sources over a total number of 937 catalogued BL Lacs.
Unfortunately, not all the sources included in the master sample (hereafter named B0) have been observed in all the frequency ranges, and therefore we had to define a number of subsamples useful for more homogeneous population studies. Therefore, we defined three subsamples including sources detected in the near-IR, X-ray and γ-ray band. The Roma-BZCAT lists the X-ray flux in the band 0.1–2.4 keV, mainly from ROSAT All Sky Survey (RASS) but other observatories like XMM and Swift are also considered, particularly for recently discovered sources. γ-ray fluxes were obtained from the FERMI–LAT 1-year Point Source Catalogue (1FGL; Abdo et al. 2010a), and near-IR data from the Two-Micron All-Sky Survey (2MASS) data base (Cutri et al. 2003). The three subsamples are named B1-X, B1-G and B1-IR and the numbers of sources are 423, 109 and 295, respectively. Radio flux at 1.4 GHz is available for all the sources, because only those with a radio detection are included in the Roma-BZCAT.
3 BL L ac COLOURS AND CLASSIFICATION
3.1 L–H classification
Multifrequency observations have shown that the spectral energy distribution (SED) of BL Lac objects is characterized by two broad features. The feature peaking at lower energy is generally explained in terms of synchrotron emission from relativistic electrons moving down a jet pointing close to the observers’ line of sight whereas the second feature, peaking at higher energies, is likely due to the Inverse Compton upscattering of low-energy photons by the same electron population. A first, now widely used, physical classification of BL Lac objects based on the frequency of the synchrotron peak in the SED, νp, was introduced by Padovani & Giommi (1995), who divided these sources in low-frequency peaked (LBL) and high-frequency peaked (HBL) BL Lacs. Recently, Abdo et al. (2010b) extended this classification to all the blazars and defined low synchrotron peaked (LSP) blazar sources as those having νp lower than ∼1014 Hz, high synchrotron peaked (HSP) blazars those with νp higher than ∼1015 Hz, while sources within these two limits are defined as ISP or intermediate synchrotron peaked blazars (see also Kock et al. 1996; Laurent-Muehleisen et al. 1999; Bondi et al. 2001). An accurate classification would require the analysis of the SED and a good estimate of the peak frequency of the synchrotron emission. This analysis can be performed only for a rather small number of well-studied sources whose SEDs have many data points covering a broad frequency range. For the majority of sources data are too few and not simultaneous, implying that results are much more uncertain. Nieppola, Tornikoski & Valtaoja (2006) presented a first analysis of the peak frequencies of a large sample of BL Lac objects including more than 300 sources. They applied a single parabolic fit to a selection of data for each source and estimated the peak frequency, which was used for a classification in the three types given above, but with different frequency ranges. More specifically, they defined intermediate BL objects as those having a synchrotron peak frequency between ∼1014.5 and ∼1016.5 Hz.
The sample considered by us is richer than the one of Nieppola et al. (2006), but common sources are only 169. For the majority of our objects the available data are too few to try a best fit of the SED. We needed, therefore, to apply a much simpler strategy based on a flux ratio between two largely different frequency intervals. This simple approach does not allow us to distinguish clearly intermediate BL Lacs from the other two types, and therefore throughout this paper, we will consider only the two LBL and HBL classes and refer to them below as L and H, respectively.
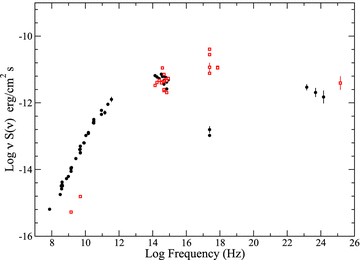
The SEDs of the BL Lac objects BZB J1150+2417 (L type, filled black circles) and BZB J1517+6525 (H type, red open squares). Note that the ratio ΦXR is a good tool for discriminating these two types of BL Lacs.
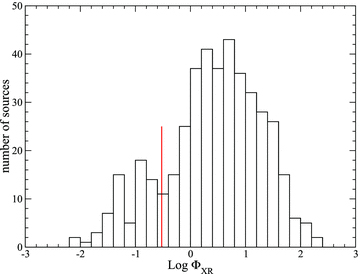
Histogram of ΦXR. The red line is the formal boundary adopted between L and H type.
There are, however, a couple of caveats to be taken into account in using this parameter for discriminating HBL from LBL objects. The first one is that measures of the X-ray flux are not available in the literature or data bases for about 1/3 of the sources in the B0 sample. This lack of data does not mean that the X-ray emission from these sources is fainter than for other objects in the sample. For several sources data were obtained in pointed observations of various satellites, while for many others the flux was derived from RASS (Brinkmann et al. 1997; Voges et al. 1999). Considering that the flux limit of this survey is not uniform in the sky, a number of sources could not be detected with a significance level to be included in their catalogue. The second caveat is that the reported X-ray flux may be occasionally contaminated either by a close nearby source or from emission originating in the surroundings, as for objects located in small clusters or groups of galaxies, or in interacting galaxy systems. Foreground or background sources can also produce an additional spurious contribution to the X-ray flux assigned to the BL Lac object. These two caveats are particularly relevant for the search of BL Lac objects performed working on data bases, because the X-ray emission from many small clusters or groups is generally not clearly identified and reported in the main catalogues. We will discuss in detail this subject because we found that it is the reason for some misclassifications.
3.2 N–G classification
Another classification of BL Lac objects can be based on the relative strength of the nuclear emission to the host galaxy luminosity inferred from the optical spectra. Following the general approach that the Ca H&K break is a good indicator of the relevance of these two components, we considered the two following types.
N (or nucleus-dominated) BL Lacs, for sources exhibiting a strong blue continuum either without evidence of the Ca H&K break or with a mean flux density at frequencies higher than that of the Ca H&K break having a level similar or higher than that measured at lower frequencies.
G (or galaxy-dominated) BL Lacs, for sources in which the Ca H&K break was always detected and with a flux density at higher frequencies systematically lower than that measured at lower frequencies.
The quantitative criterion for this classification is to compute the mean flux level in a 400 Å wide wavelength interval redwards of the Ca H&K break and to verify if the flux at shorter wavelengths is or is not systematically lower than this value. In Fig. 1 red lines mark the fiducial level: the first two spectra are of N-type BL Lacs, whereas the third one is clearly of G type.
The wavelength range of spectral data is frequently limited at about 4000 Å as in the SDSS, and therefore the level of the nuclear emission at shorter wavelengths cannot be well evaluated. To more quantitative the classification, we considered the u−r colour index of the SDSS photometric system (AB magnitudes) that was found to be a simple and efficient tool for discriminating between BL Lacs of N and G type. The effective wavelengths of the u and r bandpasses are 3500 and 6250 Å, respectively. Considering that the minimum redshift that a BL Lac should have to move the Ca H&K break up to the observer r bandpass is z≃ 0.5 and that redshifts of BL Lacs are typically lower than this value, the Ca H&K break lies between these two wavelengths and, therefore, the u−r is a well-suited parameter to measure the relevance of the nuclear emission with respect to that of the galaxy. In this analysis we considered SDSS model magnitudes to take properly into account the host galaxy contribution.
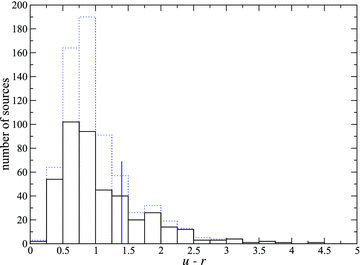
Histograms of the u−r colour distributions for the BL Lacs in the B1-X sample (solid black blue histogram) and for all sources of the B0 sample (dotted blue histogram). The vertical line divides N from G objects. Note that the large majority of sources without a measured X-ray flux have colours typical of an N-type BL Lac object.
The number of G objects (or with u−r > 1.4) is much smaller than those of N type: they are 120 (corresponding to about 18 per cent) in the B0 sample, and 96 in the B1-X sample (∼23 per cent).
4 BL L ac TYPES AND HIGH ENERGY EMISSION
4.1 The ΦXR versus u−r plot
The bivariate distribution of the B1-X sample in the plane ΦXR versus u−r (Fig. 5) is a very useful tool for improving the classification of BL Lac objects. According to the previous established criteria, the horizontal line, corresponding to  , discriminates H and L objects, while the vertical one having u−r= 1.4 discriminates N and G types. Thus, the resulting four quadrants correspond to HN, HG, LG and LN types, as indicated in Fig. 5. It is well apparent that the large majority of known BL Lac objects are of HN type; however there are also several sources of LN types, while the LG ones are very few. This is not due to the fact that the X-ray flux is unknown for about 1/3 of the sources in the B0 sample, but because many of them have low u−r values. The distribution of points is remarkably not uniform with a high concentration in a rather narrow belt crossing the HN and HG regions. In the two G regions points are much more sparse with only a relatively denser group centred about at u−r= 1.95 and LogΦXR= 0.25. Ten of the 15 sources in this region are in galaxy clusters or small groups, and if they were excluded because their X-ray emission could not entirely be originated in the nucleus, the data concentration would disappear.
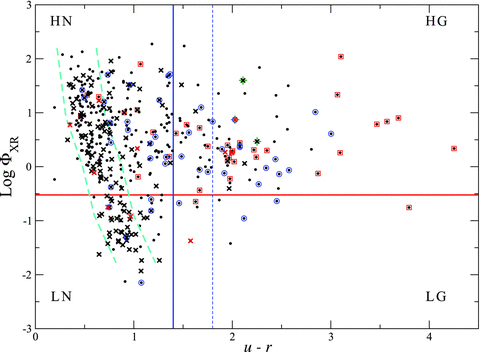
Scatter plot of  versus u−r. Long dashed lines limit the high-density region and the vertical short dashed line limits the region with u−r > 1.8. Thick small × marks the sources detected in the γ-ray range and reported in the 2FGL catalogue (black) or only in the 1FGL (red); large open red squares correspond to sources close to or in clusters; large open blue circles correspond to sources in small groups according to our analysis.
We can define in this plot an approximate region inside which sources’ data points are more concentrated than outside. It is roughly limited by the two dashed lines in Fig. 5. The left u−r boundary of this region appears to be intrinsic to the BL Lac population and does not depend on selection effects, because there is no reason for excluding sources with a high u excess in BL Lac searches in other frequency bands. There are, in fact, only very few object on the left side of this belt and they can represent the minimum observed u−r value that is around 0.2 corresponding to a spectral index of 0.32. Note also that the mean u−r colour of HN objects in this region is smaller than for LN ones. This finding can be naturally explained by the fact that the X-ray luminosity is expected to be positively correlated with that in the UV range if they are originated by the same synchrotron component.
In Fig. 5, we introduced some special symbols for different classes of BL Lacs: red squares mark those sources which are close to or belong to a known cluster of galaxies, as derived from the NASA/IPAC Extragalactic Database (NED) information or from the recent list based on SDSS images (Hao et al. 2010), blue circles correspond to objects that in the SDSS images appear, in our opinion, to be in small groups, or in close pair or systems, although not reported in the literature. In particular, we searched for other galaxies having an angular separation from the BL Lac lower than a few galaxian radii that, for a typical elliptical at z equal to about 0.2 corresponds to 20 arcsec. When four or more galaxies were found we classified the source as belonging to a group, while it was considered a pair (or a small system) when less than three galaxies were in the surroundings. In some cases, redshifts of near galaxies are also available in SDSS and we were able to verify their actual closeness.
The possibility of confusing the X-ray emission from BL Lacs with those from galaxy clusters was considered since early systematic searches as the EMSS (Stocke et al. 1985, 1991). The occurrence of BL Lac objects in cluster of galaxies has already been investigated by several authors (e.g. Laurent-Muehleisen et al. 1993; Pesce, Falomo & Treves 1995; Hart, Stocke & Hallman 2009; Giles et al. 2012) and in some cases the membership has been spectroscopically confirmed. The majority of BL Lac objects, however, as found in our sample, appear rather isolated and therefore the chance occurrence of a BL Lac in a cluster is not expected to be high, in agreement with the previous results of Owen, Ledlow & Keel (1996), who searched for BL Lac objects in a rather large sample of Abell clusters.
The X-ray flux of candidate BL Lacs in clusters can be therefore contaminated by an emission of non-nuclear origin, and this could lead to the spurious identification of a galaxy with a faint radio emission as a BL Lac object. Note that the distribution of these sources in Fig. 5 is highly non-uniform. If the chance to find a BL Lac object in a cluster were independent of its physical parameters, the number of circles and squares should be higher in the region of high density of points, while we observe the opposite distribution. Fig. 6 gives a very clear picture of this effect. We plotted, for u−r intervals equal to 0.5, the fraction of sources found in systems (circles and squares) and verified that it is very well correlated with the red colour of the object. Objects with u−r > 3.0 are all associated with clusters, while the fraction of associated sources with this colour index higher than 2.0 is about 0.5.
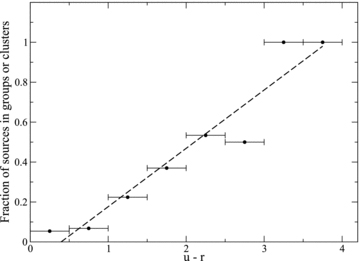
The fraction of sources in groups or clusters plotted as a function of the colour u−r. The dashed line is a linear best fit that gives a very good description of the data (the linear correlation coefficient is 0.96).
A list of G-type BL objects having u−r > 1.8 and including notes about possible association with clusters is given in Table 1.
List of G-type BL Lac objects in the B0 sample having u−r > 1.8.
| Source | u−r (mag) | J−K (mag) | S1.4 (mJy) |  | z | Ref. | Notes |
| BZB J0001−1031 | 2.3 | 1.30 | 41 | 0.252 | PL8 | ||
| BZB J0056−0936 | 1.9 | 1.22 | 199 | 0.324 | 0.103 | RBS | gr |
| BZB J0103+1526 | 2.0 | 1.60 | 225 | 0.246 | CL5 | ||
| BZB J0110+4149 | 2.4 | 1.04 | 85 | 0.139 | 0.096 | RAX | gr |
| BZB J0148+1402 | 2.9 | 1.22 | 44 | −0.125 | 0.125 | PG5 | cl: GMBCG |
| BZB J0232+2017 | 1.8 | 1.27 | 82 | 0.837 | 0.139 | PG5 | gr |
| BZB J0319+1845 | 2.1 | 1.24 | 21 | 1.598 | 0.190 | PG5 | F2 |
| BZB J0737+3517 | 3.0 | 1.45 | 26 | 0.610 | 0.213 | RAX | gr |
| BZB J0741+3205 | 2.0 | 1.48 | 77 | 0.179 | PL8 | cl: GMBCG | |
| BZB J0745+3312 | 3.8 | 1.44 | 22 | −0.755 | 0.220 | ROX | cl: MaxBCG, GMBCG |
| BZB J0751+2913 | 2.8 | 1.37 | 10 | 0.322 | 0.185 | ROX | |
| BZB J0754+3910 | 1.9 | 1.22 | 58 | −0.120 | 0.096 | BR0 | ss |
| BZB J0758+2705 | 2.0 | 1.27 | 54 | 0.099 | PL8 | ss | |
| BZB J0809+3455 | 2.0 | 1.08 | 223 | 0.261 | 0.083 | CLS | F1, cl: GMBCG |
| BZB J0810+2846 | 2.0 | 42 | 0.272 | PL8 | |||
| BZB J0810+4911 | 3.1 | 1.16 | 11 | 0.260 | 0.115 | CLS | cl: MaxBCG, GMBCG |
| BZB J0823+1524 | 2.1 | 1.40 | 22 | 0.167 | PL0 | ||
| BZB J0828+4153 | 2.0 | 1.64 | 91 | 0.094 | 0.226 | RAX | cl: GMBCG |
| BZB J0850+3455 | 1.9 | 1.25 | 35 | 0.269 | 0.145 | RAX | F1 |
| BZB J0856+5418 | 4.3b | 1.28 | 57 | 0.338 | 0.259 | RAX | cl: MACS, GMBCG |
| BZB J0903+4055 | 1.9 | 1.12 | 36 | 0.745 | 0.188 | RAX | |
| BZB J0927+5327 | 3.1 | 0.93 | 5 | 1.334 | 0.201 | RAX | cl: GMBCG |
| BZB J0927+5545 | 2.5 | 1.44 | 78 | −0.637 | 0.221 | ROX | ss |
| BZB J0932+3630 | 2.5 | 1.17 | 52 | −0.136 | 0.154 | PL8 | ss |
| BZB J1001+2048 | 2.5 | 1.36 | 2 | 0.929 | 0.344 | EMS | gr? |
| BZB J1012+3932 | 2.0 | 1.26 | 20 | 0.512 | 0.171 | ROX | |
| BZB J1018+3128 | 2.4 | 1.21 | 4 | 1.322 | 0.161 | RAX | |
| BZB J1022+5124 | 2.3 | 1.61 | 5 | 1.838 | 0.142 | EMS | |
| BZB J1028+0555 | 2.0 | 1.84 | 19 | 0.022 | 0.234 | PL8 | |
| BZB J1028+1702 | 2.2 | 1.30 | 79 | −0.053 | 0.169 | SE5 | |
| BZB J1033+4222 | 2.0 | 1.22 | 45 | −0.222 | 0.211 | CLS | cl: GMBCG |
| BZB J1041+1324 | 1.8 | 1.64 | 57 | 0.375 | PL8 | cl: GMBCG | |
| BZB J1041+3901 | 2.1 | 1.10 | 33 | 0.385 | 0.210 | PL8 | cp |
| BZB J1053+4929 | 2.0 | 1.12 | 64 | 0.108 | 0.140 | RAX | F2, cl: MS, GMBCG |
| BZB J1059+4343 | 2.0 | 1.77 | 40 | −0.301 | 0.459 | PL8 | |
| BZB J1124+5133 | 2.6 | 1.27 | 54 | 0.235 | CLS | gr | |
| BZB J1136+2550 | 2.3 | 1.29 | 16 | 0.468 | 0.156 | RAX | F2 |
| BZB J1145−0340 | 2.1 | 1.30 | 18 | 1.358 | 0.167 | SH5 | |
| BZB J1156+4238 | 2.6 | 1.19 | 14 | 0.693 | 0.172 | EMS | cl: MS |
| BZB J1157+2822 | 1.9 | 1.65 | 31 | 0.341 | 0.300 | PL0 | |
| BZB J1201−0007 | 2.2 | 1.37 | 70 | 0.176 | 0.165 | RAX | cl: [EAD]238, GMBCG |
| BZB J1201−0011 | 2.4 | 1.11 | 28 | 0.301 | 0.164 | ROX | cl: MaxBCG, GMBCG |
| BZB J1203+6031 | 2.0 | 1.25 | 190 | −0.404 | 0.065 | CLS | F2 |
| BZB J1221+4742 | 2.1 | 1.19 | 42 | 0.364 | 0.210 | RAX | ss |
| BZB J1223+4650 | 2.1 | 1.58 | 13 | 0.442 | 0.261 | ROX | cl: NSCS, GMBCG |
| BZB J1238+5406 | 2.0 | 1.55 | 39 | 0.224 | PL8 | ||
| BZB J1243+5212 | 2.5 | 1.35 | 38 | −0.404 | 0.200 | ROX | |
| BZB J1243−0613 | 2.7 | 1.22 | 345 | 0.139 | PKQ | ss gr? | |
| BZB J1253+0326 | 1.9 | 1.12 | 107 | 0.193 | 0.066 | RAX | |
| BZB J1331−0022 | 1.9 | 1.74 | 9 | 0.523 | 0.243 | CL5 | |
| BZB J1348+0756 | 2.0 | 1.50 | 53 | 0.400 | 0.250 | PL0 | cl: GMBCG |
| BZB J1401+1350 | 3.5 | 1.32 | 8 | 0.787 | 0.212 | ROX | cl: MaxBCG, GMBCG |
| BZB J1424+3705 | 2.2 | 1.53 | 79 | −0.244 | 0.290 | RAX | cs |
| BZB J1427+5409 | 2.6 | 0.77 | 44 | −0.064 | 0.106 | RAX | gr |
| BZB J1427+3908 | 2.0 | 1.11 | 7 | 0.359 | 0.165 | PL8 | |
| BZB J1435−0055 | 1.9 | 1.35 | 15 | 0.285 | PL8 | ||
| BZB J1436+4129 | 2.8b | 53 | 0.404 | PL8 | |||
| BZB J1445+0039 | 3.7b | 1.68 | 8 | 0.903 | 0.306 | ROX | cl: CE J221.312271+00.651836 |
| BZB J1502+2528 | 2.2 | 51 | 0.178 | ||||
| BZB J1510+3335 | 2.6 | 1.23 | 8 | 1.500 | 0.114 | RAX | |
| BZB J1516+2918 | 2.3 | 1.21 | 134 | −0.023 | 0.130 | RAX | gr |
| BZB J1532+3016 | 2.0 | 1.08 | 52 | 0.872 | 0.065 | RAX | F1, ss |
| BZB J1544+5017 | 1.9 | 29 | −0.617 | 0.494 | ROX | ||
| BZB J1604+3345 | 2.8 | 1.24 | 7 | 1.012 | 0.177 | RAX | |
| BZB J1616+3756 | 1.9 | 1.38 | 4 | 1.357 | 0.202 | SH5 | |
| BZB J1624+3726 | 2.2 | 1.38 | 59 | −0.324 | 0.199 | RAX | |
| BZB J1628+2527 | 2.0 | 1.44 | 72 | 0.292 | 0.220 | SE5 | cl: GMBCG |
| BZB J1637+4547 | 2.0 | 1.68 | 45 | 0.166 | 0.192 | CL5 | cl: MaxBCG |
| BZB J1643+2131 | 3.6 | 1.30 | 8 | 0.837 | 0.154 | ROX | cl: GMBCG |
| BZB J1647+2909 | 2.1 | 1.31 | 390 | −0.958 | 0.132 | MB6 | ss |
| BZB J1655+3723 | 1.9 | 76 | PL0 | ||||
| BZB J1717+2931 | 3.1 | 1.43 | 3 | 2.040 | 0.276 | ROX | cl: RBS 1634 |
| BZB J1750+4700 | 2.2 | 1.49 | 99 | 0.312 | 0.160 | LM9 | cl: MACS |
| BZB J2145−0434 | 2.4 | 1.11 | 67 | 0.464 | 0.070 | RAX | |
| BZB J2248−0036 | 2.1 | 1.46 | 61 | 0.212 | CL5 | cl: GMBCG | |
| BZB J2322+3436 | 2.1 | 1.38 | 95 | 0.060 | 0.098 | LM9 | F2 |
| BZB J2350+3622 | 2.0b | 1.68 | 317 | −1.422 | 0.317 | DXR |
| Source | u−r (mag) | J−K (mag) | S1.4 (mJy) | | z | Ref. | Notes |
| BZB J0001−1031 | 2.3 | 1.30 | 41 | 0.252 | PL8 | ||
| BZB J0056−0936 | 1.9 | 1.22 | 199 | 0.324 | 0.103 | RBS | gr |
| BZB J0103+1526 | 2.0 | 1.60 | 225 | 0.246 | CL5 | ||
| BZB J0110+4149 | 2.4 | 1.04 | 85 | 0.139 | 0.096 | RAX | gr |
| BZB J0148+1402 | 2.9 | 1.22 | 44 | −0.125 | 0.125 | PG5 | cl: GMBCG |
| BZB J0232+2017 | 1.8 | 1.27 | 82 | 0.837 | 0.139 | PG5 | gr |
| BZB J0319+1845 | 2.1 | 1.24 | 21 | 1.598 | 0.190 | PG5 | F2 |
| BZB J0737+3517 | 3.0 | 1.45 | 26 | 0.610 | 0.213 | RAX | gr |
| BZB J0741+3205 | 2.0 | 1.48 | 77 | 0.179 | PL8 | cl: GMBCG | |
| BZB J0745+3312 | 3.8 | 1.44 | 22 | −0.755 | 0.220 | ROX | cl: MaxBCG, GMBCG |
| BZB J0751+2913 | 2.8 | 1.37 | 10 | 0.322 | 0.185 | ROX | |
| BZB J0754+3910 | 1.9 | 1.22 | 58 | −0.120 | 0.096 | BR0 | ss |
| BZB J0758+2705 | 2.0 | 1.27 | 54 | 0.099 | PL8 | ss | |
| BZB J0809+3455 | 2.0 | 1.08 | 223 | 0.261 | 0.083 | CLS | F1, cl: GMBCG |
| BZB J0810+2846 | 2.0 | 42 | 0.272 | PL8 | |||
| BZB J0810+4911 | 3.1 | 1.16 | 11 | 0.260 | 0.115 | CLS | cl: MaxBCG, GMBCG |
| BZB J0823+1524 | 2.1 | 1.40 | 22 | 0.167 | PL0 | ||
| BZB J0828+4153 | 2.0 | 1.64 | 91 | 0.094 | 0.226 | RAX | cl: GMBCG |
| BZB J0850+3455 | 1.9 | 1.25 | 35 | 0.269 | 0.145 | RAX | F1 |
| BZB J0856+5418 | 4.3b | 1.28 | 57 | 0.338 | 0.259 | RAX | cl: MACS, GMBCG |
| BZB J0903+4055 | 1.9 | 1.12 | 36 | 0.745 | 0.188 | RAX | |
| BZB J0927+5327 | 3.1 | 0.93 | 5 | 1.334 | 0.201 | RAX | cl: GMBCG |
| BZB J0927+5545 | 2.5 | 1.44 | 78 | −0.637 | 0.221 | ROX | ss |
| BZB J0932+3630 | 2.5 | 1.17 | 52 | −0.136 | 0.154 | PL8 | ss |
| BZB J1001+2048 | 2.5 | 1.36 | 2 | 0.929 | 0.344 | EMS | gr? |
| BZB J1012+3932 | 2.0 | 1.26 | 20 | 0.512 | 0.171 | ROX | |
| BZB J1018+3128 | 2.4 | 1.21 | 4 | 1.322 | 0.161 | RAX | |
| BZB J1022+5124 | 2.3 | 1.61 | 5 | 1.838 | 0.142 | EMS | |
| BZB J1028+0555 | 2.0 | 1.84 | 19 | 0.022 | 0.234 | PL8 | |
| BZB J1028+1702 | 2.2 | 1.30 | 79 | −0.053 | 0.169 | SE5 | |
| BZB J1033+4222 | 2.0 | 1.22 | 45 | −0.222 | 0.211 | CLS | cl: GMBCG |
| BZB J1041+1324 | 1.8 | 1.64 | 57 | 0.375 | PL8 | cl: GMBCG | |
| BZB J1041+3901 | 2.1 | 1.10 | 33 | 0.385 | 0.210 | PL8 | cp |
| BZB J1053+4929 | 2.0 | 1.12 | 64 | 0.108 | 0.140 | RAX | F2, cl: MS, GMBCG |
| BZB J1059+4343 | 2.0 | 1.77 | 40 | −0.301 | 0.459 | PL8 | |
| BZB J1124+5133 | 2.6 | 1.27 | 54 | 0.235 | CLS | gr | |
| BZB J1136+2550 | 2.3 | 1.29 | 16 | 0.468 | 0.156 | RAX | F2 |
| BZB J1145−0340 | 2.1 | 1.30 | 18 | 1.358 | 0.167 | SH5 | |
| BZB J1156+4238 | 2.6 | 1.19 | 14 | 0.693 | 0.172 | EMS | cl: MS |
| BZB J1157+2822 | 1.9 | 1.65 | 31 | 0.341 | 0.300 | PL0 | |
| BZB J1201−0007 | 2.2 | 1.37 | 70 | 0.176 | 0.165 | RAX | cl: [EAD]238, GMBCG |
| BZB J1201−0011 | 2.4 | 1.11 | 28 | 0.301 | 0.164 | ROX | cl: MaxBCG, GMBCG |
| BZB J1203+6031 | 2.0 | 1.25 | 190 | −0.404 | 0.065 | CLS | F2 |
| BZB J1221+4742 | 2.1 | 1.19 | 42 | 0.364 | 0.210 | RAX | ss |
| BZB J1223+4650 | 2.1 | 1.58 | 13 | 0.442 | 0.261 | ROX | cl: NSCS, GMBCG |
| BZB J1238+5406 | 2.0 | 1.55 | 39 | 0.224 | PL8 | ||
| BZB J1243+5212 | 2.5 | 1.35 | 38 | −0.404 | 0.200 | ROX | |
| BZB J1243−0613 | 2.7 | 1.22 | 345 | 0.139 | PKQ | ss gr? | |
| BZB J1253+0326 | 1.9 | 1.12 | 107 | 0.193 | 0.066 | RAX | |
| BZB J1331−0022 | 1.9 | 1.74 | 9 | 0.523 | 0.243 | CL5 | |
| BZB J1348+0756 | 2.0 | 1.50 | 53 | 0.400 | 0.250 | PL0 | cl: GMBCG |
| BZB J1401+1350 | 3.5 | 1.32 | 8 | 0.787 | 0.212 | ROX | cl: MaxBCG, GMBCG |
| BZB J1424+3705 | 2.2 | 1.53 | 79 | −0.244 | 0.290 | RAX | cs |
| BZB J1427+5409 | 2.6 | 0.77 | 44 | −0.064 | 0.106 | RAX | gr |
| BZB J1427+3908 | 2.0 | 1.11 | 7 | 0.359 | 0.165 | PL8 | |
| BZB J1435−0055 | 1.9 | 1.35 | 15 | 0.285 | PL8 | ||
| BZB J1436+4129 | 2.8b | 53 | 0.404 | PL8 | |||
| BZB J1445+0039 | 3.7b | 1.68 | 8 | 0.903 | 0.306 | ROX | cl: CE J221.312271+00.651836 |
| BZB J1502+2528 | 2.2 | 51 | 0.178 | ||||
| BZB J1510+3335 | 2.6 | 1.23 | 8 | 1.500 | 0.114 | RAX | |
| BZB J1516+2918 | 2.3 | 1.21 | 134 | −0.023 | 0.130 | RAX | gr |
| BZB J1532+3016 | 2.0 | 1.08 | 52 | 0.872 | 0.065 | RAX | F1, ss |
| BZB J1544+5017 | 1.9 | 29 | −0.617 | 0.494 | ROX | ||
| BZB J1604+3345 | 2.8 | 1.24 | 7 | 1.012 | 0.177 | RAX | |
| BZB J1616+3756 | 1.9 | 1.38 | 4 | 1.357 | 0.202 | SH5 | |
| BZB J1624+3726 | 2.2 | 1.38 | 59 | −0.324 | 0.199 | RAX | |
| BZB J1628+2527 | 2.0 | 1.44 | 72 | 0.292 | 0.220 | SE5 | cl: GMBCG |
| BZB J1637+4547 | 2.0 | 1.68 | 45 | 0.166 | 0.192 | CL5 | cl: MaxBCG |
| BZB J1643+2131 | 3.6 | 1.30 | 8 | 0.837 | 0.154 | ROX | cl: GMBCG |
| BZB J1647+2909 | 2.1 | 1.31 | 390 | −0.958 | 0.132 | MB6 | ss |
| BZB J1655+3723 | 1.9 | 76 | PL0 | ||||
| BZB J1717+2931 | 3.1 | 1.43 | 3 | 2.040 | 0.276 | ROX | cl: RBS 1634 |
| BZB J1750+4700 | 2.2 | 1.49 | 99 | 0.312 | 0.160 | LM9 | cl: MACS |
| BZB J2145−0434 | 2.4 | 1.11 | 67 | 0.464 | 0.070 | RAX | |
| BZB J2248−0036 | 2.1 | 1.46 | 61 | 0.212 | CL5 | cl: GMBCG | |
| BZB J2322+3436 | 2.1 | 1.38 | 95 | 0.060 | 0.098 | LM9 | F2 |
| BZB J2350+3622 | 2.0b | 1.68 | 317 | −1.422 | 0.317 | DXR |
Notes.
b: value with a large uncertainty;
cl: cluster of galaxies;
cp: close pair of galaxies;
gr: group of galaxies;
F1: possible counterpart of a Fermi–LAT 1FGL source.
F2: possible counterpart of a Fermi–LAT 2FGL source.
ss: small system of close galaxies.
References:
CL5 =Collinge et al. (2005)– SDSS;
CLS =Marchã et al. (2001); Caccianiga et al. (2002)– CLASS Blazar survey;
DXR = Perman et al. (1998); DXRBS;
EMS =Stocke et al. (1991), Rector, Stocke & Padovani (1999)– EMSS;
LM9 =Laurent-Muehleisen et al. (1999)– RGB;
MB6 =Marchã et al. (1996);
PG5 =Padovani & Giommi (1995);
PKQ =Jackson et al. (2002), Hook et al. (2003)– Parkes Quarter Jansky;
PL0 =Plotkin et al. (2010)– SDSS;
PL8 =Plotkin et al. (2008)– SDSS;
RAX =Kock et al. (1996), Wei et al. (1999), Bade et al. (1998), Voges et al. (1999), Bauer et al. (2000), Brinkmann et al. (2000)– RASS, ROSAT;
ROX =Turriziani et al. (2007)– ROXA, http://www.asdc.asi.it/roxa/;
SH5 =Giommi et al. (2005), Piranomonte et al. (2007)– Sedentary Survey.
List of G-type BL Lac objects in the B0 sample having u−r > 1.8.
| Source | u−r (mag) | J−K (mag) | S1.4 (mJy) | | z | Ref. | Notes |
| BZB J0001−1031 | 2.3 | 1.30 | 41 | 0.252 | PL8 | ||
| BZB J0056−0936 | 1.9 | 1.22 | 199 | 0.324 | 0.103 | RBS | gr |
| BZB J0103+1526 | 2.0 | 1.60 | 225 | 0.246 | CL5 | ||
| BZB J0110+4149 | 2.4 | 1.04 | 85 | 0.139 | 0.096 | RAX | gr |
| BZB J0148+1402 | 2.9 | 1.22 | 44 | −0.125 | 0.125 | PG5 | cl: GMBCG |
| BZB J0232+2017 | 1.8 | 1.27 | 82 | 0.837 | 0.139 | PG5 | gr |
| BZB J0319+1845 | 2.1 | 1.24 | 21 | 1.598 | 0.190 | PG5 | F2 |
| BZB J0737+3517 | 3.0 | 1.45 | 26 | 0.610 | 0.213 | RAX | gr |
| BZB J0741+3205 | 2.0 | 1.48 | 77 | 0.179 | PL8 | cl: GMBCG | |
| BZB J0745+3312 | 3.8 | 1.44 | 22 | −0.755 | 0.220 | ROX | cl: MaxBCG, GMBCG |
| BZB J0751+2913 | 2.8 | 1.37 | 10 | 0.322 | 0.185 | ROX | |
| BZB J0754+3910 | 1.9 | 1.22 | 58 | −0.120 | 0.096 | BR0 | ss |
| BZB J0758+2705 | 2.0 | 1.27 | 54 | 0.099 | PL8 | ss | |
| BZB J0809+3455 | 2.0 | 1.08 | 223 | 0.261 | 0.083 | CLS | F1, cl: GMBCG |
| BZB J0810+2846 | 2.0 | 42 | 0.272 | PL8 | |||
| BZB J0810+4911 | 3.1 | 1.16 | 11 | 0.260 | 0.115 | CLS | cl: MaxBCG, GMBCG |
| BZB J0823+1524 | 2.1 | 1.40 | 22 | 0.167 | PL0 | ||
| BZB J0828+4153 | 2.0 | 1.64 | 91 | 0.094 | 0.226 | RAX | cl: GMBCG |
| BZB J0850+3455 | 1.9 | 1.25 | 35 | 0.269 | 0.145 | RAX | F1 |
| BZB J0856+5418 | 4.3b | 1.28 | 57 | 0.338 | 0.259 | RAX | cl: MACS, GMBCG |
| BZB J0903+4055 | 1.9 | 1.12 | 36 | 0.745 | 0.188 | RAX | |
| BZB J0927+5327 | 3.1 | 0.93 | 5 | 1.334 | 0.201 | RAX | cl: GMBCG |
| BZB J0927+5545 | 2.5 | 1.44 | 78 | −0.637 | 0.221 | ROX | ss |
| BZB J0932+3630 | 2.5 | 1.17 | 52 | −0.136 | 0.154 | PL8 | ss |
| BZB J1001+2048 | 2.5 | 1.36 | 2 | 0.929 | 0.344 | EMS | gr? |
| BZB J1012+3932 | 2.0 | 1.26 | 20 | 0.512 | 0.171 | ROX | |
| BZB J1018+3128 | 2.4 | 1.21 | 4 | 1.322 | 0.161 | RAX | |
| BZB J1022+5124 | 2.3 | 1.61 | 5 | 1.838 | 0.142 | EMS | |
| BZB J1028+0555 | 2.0 | 1.84 | 19 | 0.022 | 0.234 | PL8 | |
| BZB J1028+1702 | 2.2 | 1.30 | 79 | −0.053 | 0.169 | SE5 | |
| BZB J1033+4222 | 2.0 | 1.22 | 45 | −0.222 | 0.211 | CLS | cl: GMBCG |
| BZB J1041+1324 | 1.8 | 1.64 | 57 | 0.375 | PL8 | cl: GMBCG | |
| BZB J1041+3901 | 2.1 | 1.10 | 33 | 0.385 | 0.210 | PL8 | cp |
| BZB J1053+4929 | 2.0 | 1.12 | 64 | 0.108 | 0.140 | RAX | F2, cl: MS, GMBCG |
| BZB J1059+4343 | 2.0 | 1.77 | 40 | −0.301 | 0.459 | PL8 | |
| BZB J1124+5133 | 2.6 | 1.27 | 54 | 0.235 | CLS | gr | |
| BZB J1136+2550 | 2.3 | 1.29 | 16 | 0.468 | 0.156 | RAX | F2 |
| BZB J1145−0340 | 2.1 | 1.30 | 18 | 1.358 | 0.167 | SH5 | |
| BZB J1156+4238 | 2.6 | 1.19 | 14 | 0.693 | 0.172 | EMS | cl: MS |
| BZB J1157+2822 | 1.9 | 1.65 | 31 | 0.341 | 0.300 | PL0 | |
| BZB J1201−0007 | 2.2 | 1.37 | 70 | 0.176 | 0.165 | RAX | cl: [EAD]238, GMBCG |
| BZB J1201−0011 | 2.4 | 1.11 | 28 | 0.301 | 0.164 | ROX | cl: MaxBCG, GMBCG |
| BZB J1203+6031 | 2.0 | 1.25 | 190 | −0.404 | 0.065 | CLS | F2 |
| BZB J1221+4742 | 2.1 | 1.19 | 42 | 0.364 | 0.210 | RAX | ss |
| BZB J1223+4650 | 2.1 | 1.58 | 13 | 0.442 | 0.261 | ROX | cl: NSCS, GMBCG |
| BZB J1238+5406 | 2.0 | 1.55 | 39 | 0.224 | PL8 | ||
| BZB J1243+5212 | 2.5 | 1.35 | 38 | −0.404 | 0.200 | ROX | |
| BZB J1243−0613 | 2.7 | 1.22 | 345 | 0.139 | PKQ | ss gr? | |
| BZB J1253+0326 | 1.9 | 1.12 | 107 | 0.193 | 0.066 | RAX | |
| BZB J1331−0022 | 1.9 | 1.74 | 9 | 0.523 | 0.243 | CL5 | |
| BZB J1348+0756 | 2.0 | 1.50 | 53 | 0.400 | 0.250 | PL0 | cl: GMBCG |
| BZB J1401+1350 | 3.5 | 1.32 | 8 | 0.787 | 0.212 | ROX | cl: MaxBCG, GMBCG |
| BZB J1424+3705 | 2.2 | 1.53 | 79 | −0.244 | 0.290 | RAX | cs |
| BZB J1427+5409 | 2.6 | 0.77 | 44 | −0.064 | 0.106 | RAX | gr |
| BZB J1427+3908 | 2.0 | 1.11 | 7 | 0.359 | 0.165 | PL8 | |
| BZB J1435−0055 | 1.9 | 1.35 | 15 | 0.285 | PL8 | ||
| BZB J1436+4129 | 2.8b | 53 | 0.404 | PL8 | |||
| BZB J1445+0039 | 3.7b | 1.68 | 8 | 0.903 | 0.306 | ROX | cl: CE J221.312271+00.651836 |
| BZB J1502+2528 | 2.2 | 51 | 0.178 | ||||
| BZB J1510+3335 | 2.6 | 1.23 | 8 | 1.500 | 0.114 | RAX | |
| BZB J1516+2918 | 2.3 | 1.21 | 134 | −0.023 | 0.130 | RAX | gr |
| BZB J1532+3016 | 2.0 | 1.08 | 52 | 0.872 | 0.065 | RAX | F1, ss |
| BZB J1544+5017 | 1.9 | 29 | −0.617 | 0.494 | ROX | ||
| BZB J1604+3345 | 2.8 | 1.24 | 7 | 1.012 | 0.177 | RAX | |
| BZB J1616+3756 | 1.9 | 1.38 | 4 | 1.357 | 0.202 | SH5 | |
| BZB J1624+3726 | 2.2 | 1.38 | 59 | −0.324 | 0.199 | RAX | |
| BZB J1628+2527 | 2.0 | 1.44 | 72 | 0.292 | 0.220 | SE5 | cl: GMBCG |
| BZB J1637+4547 | 2.0 | 1.68 | 45 | 0.166 | 0.192 | CL5 | cl: MaxBCG |
| BZB J1643+2131 | 3.6 | 1.30 | 8 | 0.837 | 0.154 | ROX | cl: GMBCG |
| BZB J1647+2909 | 2.1 | 1.31 | 390 | −0.958 | 0.132 | MB6 | ss |
| BZB J1655+3723 | 1.9 | 76 | PL0 | ||||
| BZB J1717+2931 | 3.1 | 1.43 | 3 | 2.040 | 0.276 | ROX | cl: RBS 1634 |
| BZB J1750+4700 | 2.2 | 1.49 | 99 | 0.312 | 0.160 | LM9 | cl: MACS |
| BZB J2145−0434 | 2.4 | 1.11 | 67 | 0.464 | 0.070 | RAX | |
| BZB J2248−0036 | 2.1 | 1.46 | 61 | 0.212 | CL5 | cl: GMBCG | |
| BZB J2322+3436 | 2.1 | 1.38 | 95 | 0.060 | 0.098 | LM9 | F2 |
| BZB J2350+3622 | 2.0b | 1.68 | 317 | −1.422 | 0.317 | DXR |
Notes.
b: value with a large uncertainty;
cl: cluster of galaxies;
cp: close pair of galaxies;
gr: group of galaxies;
F1: possible counterpart of a Fermi–LAT 1FGL source.
F2: possible counterpart of a Fermi–LAT 2FGL source.
ss: small system of close galaxies.
References:
CL5 =Collinge et al. (2005)– SDSS;
CLS =Marchã et al. (2001); Caccianiga et al. (2002)– CLASS Blazar survey;
DXR = Perman et al. (1998); DXRBS;
EMS =Stocke et al. (1991), Rector, Stocke & Padovani (1999)– EMSS;
LM9 =Laurent-Muehleisen et al. (1999)– RGB;
MB6 =Marchã et al. (1996);
PG5 =Padovani & Giommi (1995);
PKQ =Jackson et al. (2002), Hook et al. (2003)– Parkes Quarter Jansky;
PL0 =Plotkin et al. (2010)– SDSS;
PL8 =Plotkin et al. (2008)– SDSS;
RAX =Kock et al. (1996), Wei et al. (1999), Bade et al. (1998), Voges et al. (1999), Bauer et al. (2000), Brinkmann et al. (2000)– RASS, ROSAT;
ROX =Turriziani et al. (2007)– ROXA, http://www.asdc.asi.it/roxa/;
SH5 =Giommi et al. (2005), Piranomonte et al. (2007)– Sedentary Survey.
4.2 High energy emission of G-type BL Lac objects
Bl Lacs are known to be γ-ray sources. A significant fraction of them have been detected in the first year of observation of Fermi-LAT (Large Area Telescope) and it is reported in the 1FGL catalogue (Abdo et al. 2010a). This number is increased in the very recently released 2FGL catalogue.2 In B0 sample there are 126 objects likely associated with 2FGL sources, while 94 are in the 1FGL catalogue, nine of which are not confirmed in the 2-year γ-ray sky. All these BL Lacs are marked by a cross in Fig. 5. Again, their distribution is far from being uniform: the majority of them are of N-type and are inside the high-density strip. Note that there are only few LN sources not detected at γ-ray energies, while this does not occur for HN objects; moreover, no possible γ-ray counterpart is reported for LG-type BL Lacs. Two examples of SEDs of N sources, detected at high energies, are given in Fig. 2.
Eight BL Lacs with u−r > 1.8 can be associated with γ-ray sources, and only the following four sources have u−r > 2.0: BZB J0319+1845 (2FGL J0319.6+1849), BZB J1136+2550 (2FGL J1137.0+2553), BZB J1532+3016 (1FGL J1531.8+3018) and BZB J2322+3436 (2FGL J2322.6+3435). No source with u−r > 2.25 is reported to have a possible counterpart at high energies. One of the sources with u−r > 2 (BZB J1532+3016) is a low-redshift elliptical galaxy (z= 0.065) with a flat spectrum radio emission that appears likely extended in NARO VLA Sky Survey (NVSS) map. SDSS image shows a companion spiral suggesting an interacting pair. Considering that the significance of its 1FGL γ-ray counterpart is equal only to 4.3σ and that this was not confirmed in the 2FGL, the occurrence of high energy emission from this G-type object could not be safely established.
The other three sources have redshifts between about 0.1 and 0.2 and appear as isolated elliptical. Their radio emission, rather faint for two of them, has flat spectra and the ΦXR values are typical of H-type sources. They could then be low-luminosity BL Lac nuclei; however a deeper multifrequency study to clarify their nature would be very useful.
5 INFRARED COLOURS
Another frequency band in which homogeneous data sets are available for a large number of BL Lac objects is the near-infrared. We investigated the emission properties of our sample in this band to extend the available information useful for identifying and properly classifying these sources. We searched for the B0 sources in the 2MASS point source catalogue, imposing a positional coincidence better than 3 arcsec. Given the limiting magnitude of the 2MASS (J≃16) only the brightest sources (319) are present in this catalogue. A further selection was made on the photometric quality, which is flagged with a letter, in decreasing quality order: only sources with quality flag A or B in all the J, H, K bands were considered to select the subsample B1-2M containing 281 objects.
Chen, Fu & Gao (2005) studied the colour distribution of a rather large sample of BL Lac objects and found that, in the (J−H, H−K) diagram, they are symmetrically clustered around a point at the position (0.7; 0.7). Our analysis shows that B1-2M sources have a similar pattern around the same centroid (Fig. 7). We compared this distribution with that of normal elliptical galaxies using J, H, K magnitudes of a sample of rather nearby galaxies selected from the Uppsala Galaxy Catalogue (UGC; Nilson 1973) as reported in the Two Micron All-Sky Survey, Extented source catalogue (2MASX). Their colour distribution is centred approximately at J−H= 0.7, H−K= 0.3 and exhibits a nearly circular pattern with a standard deviation of 0.14 mag on both colours (the large circle in the left-hand panel of Fig. 7). Rather surprising, there is no well apparent difference between the distributions of N- and G-type BL Lacs, the H−K colour of latter ones being redder than normal elliptical galaxies. In principle, one could expect some difference in the colours of these two types because these classes are based on the relative brightness of the optical nuclear emission to the host. Indeed, the nuclear component strength is based on the level of the continuum at optical wavelengths shorter than Ca H&K break feature, so that G-type sources are expected not to exhibit a high non-thermal component also in the near infrared bands.
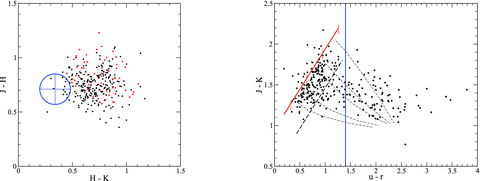
Left-hand panel: the J−H, H−K colour plot of BL Lac objects; the large open circle is a region of radius equal to 1 standard deviation of the population and where the majority of normal elliptical galaxies from the Uppsala catalogue clusterize; filled black circles are sources with a reported X-ray detection, while red triangles indicate objects not yet detected. Right-hand panel: plot of the infrared J−K colour versus u−r; the thick red line is the locus of power-law energy spectra and the vertical short lines mark spectral index values of 2.0, 1.5, 1.0, 0.5 (top to bottom); the blue line corresponds to u−r= 1.4 and discriminates between N- and G-type sources. Thin dot–dashed lines describe the change of colours when a synchrotron component is added to a normal elliptical galaxy with a variable brightness ratio. Top to bottom the peak frequencies of the non-thermal component vary from Logνp= 12.5 to 15.5, with a parabolic curvature coefficient b equal to 0.1 or 0.2.
We explored if this result could be explained by the effect of a k-correction, due to the source redshifts, on the colour indices of our BL Lac objects. This correction is not relevant if the spectrum is dominated by the non-thermal emission (e.g. it is locally described by a power law), but it may be a concern for a substantial stellar contribution, i.e. for objects classified as G-type. A suitable k-correction for elliptical galaxies in the J, H, K magnitudes is reported by Poggianti (1997): up to redshift z=0.3 the effect on the J−H colour is less than 0.05 mag, while the H−K colour becomes redder with increasing z, by up to 0.15 for z= 0.3. This correction is anyway always smaller than 0.2 in both colours for z less than 0.6. Of our 78 G-type sources with good quality (A or B) 2MASS photometry, one has no firmly established redshift and no k-correction can be computed, and another one only has z≥ 0.3. We are therefore forced to think that the redder H−K colours of the G-Type blazars can only partially be explained by their redshifts but it is largely intrinsic.
The right-hand panel of Fig. 7 shows the J−K colour plotted against u−r. As expected from the previous result, the mean value of the former colour is around 1.5 and there is an evident concentration of points inside the strip marked by a thick solid red line, representing the colours of a single power law over the near-IR to u band, and a parallel dashed line. According to our simple criterion, all BL Lacs inside the strip have u−r < 1.4 and are of N-type. Note that the density of data points is high close to this line and that only a small number of sources have bluer colours. The fact that sources tend to be redder than a simple power law indicates that their spectral distributions in the optical UV are steeper than in the near-infrared, as expected if they are described by a parabolic law in the log scales, in agreement with the early findings by Landau et al. (1986) and by more recent works (see e.g. Massaro et al. 2004a,b, 2006, Tramacere, Massaro & Taylor 2011).
To reproduce the observed distribution in the u−r, J−K plane we considered an SED given by the sum of an average elliptical galaxy (Buzzoni 2005) and a non-thermal component described by a log-parabola  . Typical values for b are in the range 0.1–0.3, while the peak frequency νp is higher than ∼1013 Hz for L BL Lac objects (Maselli et al. 2010b) and may be even higher than ∼1016 Hz for H sources. The results of our simulations are also reported in Fig. 7: each of the dash–dotted lines corresponds to a couple of values of the parameters Log(νp) (12.5, 13.5, 15.5) and b (0.1, 0.2), and the colour change is due to variation of the log of the flux ratio between the galaxy component and the non-thermal one at the K band from −4 to 1. With decreasing non-thermal contribution the object colour moves out of the power-law line to reach the point corresponding to a normal elliptical. The fact that all curves converge towards the point (1.0; 2.4) clearly depends on the adopted elliptical galaxy model; a model with a redder u−r would move the curves on the right side of the plot, thus including the data points of several G-type BL Lacs. Moreover, a local reddening in the host galaxy can also increase the u−r values. We recall that a difference between all the considered sources and normal elliptical galaxies is that the former ones have a nuclear radio emission that could be related to the K band excess: for instance, when the synchrotron component peaks at a rather low frequency and is sufficiently curved.
6 DISCUSSION
The most important result of our analysis is the assessment of more precise observational criteria to define the properties of BL Lac objects. In addition to the known L and H classes, we introduced the N and G classes to take into account the relative power of the nuclear emission to host galaxy. With the general accepted statement that a blazar, and more specifically a BL Lac, is an active nucleus of a galaxy whose emission is dominated by non-thermal processes and boosted by relativistic motions, it is important to know if the nucleus is bright enough or not to overcome the host galaxy contribution, at least in frequency ranges where the latter is typically low, in particular, at frequencies higher than the Ca H&K break. Our analysis showed that a simple estimate of the dilution of the Ca H&K break contrast cannot always be considered a good tool for searching and properly classifying this type of AGNs. In fact, the contrast is based on measures of the source flux in rather small wavelength intervals on the two sides of the break, and does not take properly into account if the nuclear emission turns out or not to be the dominant one for increasing frequencies. Under this respect, the colour u−r is a better indicator of the N or G type, at least for sources with a redshift z < 0.5. On this basis we can conclude that a fraction of sources, reported in the literature as genuine BL Lacs, could not belong to this class of AGNs and more accurate investigations of their individual properties and environment must be performed to safely establish whether they are genuine BL Lac objects. The 77 G-type BL Lac objects reported in Table 1 were discovered in many surveys, confirming that these rather broad selection criteria are largely adopted and that the possibility of considering galaxies without clear evidence of relativistic beaming as genuine BL Lac objects is not negligible. Sources occasionally reported in the literature as ‘weakly beamed’ BL Lacs should not be properly considered blazars.
The presence of a faint radio emission could be due to an origin different from a beamed relativistic jet and, therefore, cannot be considered a definitive test. Several other types of AGNs, e.g. radio galaxies, Seyfert galaxies, and so on, are radio emitting with a large spread of power, but they do not exhibit blazar properties. As for concerning multifrequency studies, our analysis demonstrates that the detection of an X-ray flux from the direction of the candidate blazar can be confusing if the source environment is unknown. The uncompleteness of catalogues of galaxy clusters, particularly for the small ones, makes it difficult to establish if the X-ray emission has been incorrectly associated with the nuclear activity leading to wrong BL Lac identifications. Another source of confusion can be due to the radio emission observed from some clusters of galaxies (Giovannini et al. 2009). This emission is generally faint and with a steep spectrum, but when BL Lac association is derived from correlations between catalogues at a single frequency and with a limited angular resolution, like NVSS (Condon et al. 1998), spurious results are possible.
Values of the optical and infrared and optical colours J−K > 1.1 and u−r < 1.4 can provide a simple test to obtain a first indication that an AGN has a non-thermal continuum overwhelming the host galaxy emission, hence it is a possible blazar, or a BL Lac, if emission lines are absent.The fact that the majority of sources with a γ-ray counterpart has colours within the two rather narrow strips in Figs 5 and 7 supports the conclusion that sources whose colours are well outside these regions cannot be safely considered BL Lacs. Values beyond these limits do not exclude the blazar nature of the object, but they must be considered as a clear indication that further investigations are necessary.
The use of these two photometric colours can be of practical relevance for two problems. The first problem concerns the existence of ‘radio faint’ (or ‘radio silent’) BL Lacs. A rather large fraction of known BL Lac objects, particularly HBL ones, has a radio flux at 1.4 GHz lower than 20 mJy or even 10 mJy; moreover, they are generally undetected in the major 5 GHz surveys. We recall that the recent BL Lac searches by Plotkin et al. (2008, 2010) report several candidates with radio fluxes lower than 5 mJy, which were not included in the Roma-BZCAT (3rd edition). The two-colour test proposed here can be then a further selection tool for good candidates. Note that hot stars as white dwarfs are easily excluded, in addition to their appreciable proper motion, because their J−K is much lower than that of BL Lacs. Of course, a simple colour-based method is not able to discriminate BL Lac objects from quasars and optical spectroscopy is necessary to search for the occurrence of emission lines and a proper classification of the source. In a very recent analysis, Massaro et al. (2011b) found that a large fraction of BL Lac objects are located in a rather narrow strip in the [3.4]–[4.6]–[12]  m two-colour diagram derived from magnitudes measured by the Wide Infrared Survey Explorer (WISE) satellite (Wright et al. 2010). This strip is particularly well marked by HBL objects and many of them are of N type. We expect, therefore, that the use of mid-infrared photometry will be a very promising and powerful tool to distinguish N and G sources to gain more information on the non-thermal nuclear emission and the distributions in the J−H, H−K plane.
The second problem is the search for possible counterparts in the error boxes of γ-ray sources. In the LAT catalogues (1FGL; Abdo et al. 2010a, and 2FGL, Abdo et al. 2011) there are a few hundreds of sources without a reasonable counterpart to associate with. The finding of a source having colours satisfying the above limits, possibly associated with a radio or X-ray emission, would be useful for selecting interesting candidates as in the case considered by Maselli et al. (2011). Similar research could be applied to the study of serendipitous sources detected inside the fields of X-ray imaging telescopes, like Chandra and Swift-XRT. We stress that the colour-based test is not a new approach. It is, in fact, an updated and revised version of the method proposed and successfully used by Braccesi (1967) and Braccesi, Lynds & Sandage (1968) in the sixties for searching quasars, and particularly the radio-quiet ones. The existence of large and easily accessible data bases makes the colour test particularly simple and powerful.
We are grateful to Gino Tosti and Andrea Tramacere for useful discussions. We acknowledge the financial support from Università di Roma La Sapienza. In this work we used the online version of the Roma-BZCAT and the scientific tools developed at the ASI Science Data Center with the supervision of Paolo Giommi. This publication made use of the Sloan Digital Sky Survey (SDSS), the NED data base and other astronomical catalogues distributed in digital form at Centre de Données Astronomiques de Strasbourg (CDS).
Footnotes
The Roma-BZCAT is available at the web site http://asdc.asi.it/bzcat
REFERENCES
