


Abstract
Residual-gas expulsion after cluster formation has recently been shown to leave an imprint in the low-mass present-day stellar mass function (PDMF) which allowed the estimation of birth conditions of some Galactic globular clusters (GCs) such as mass, radius and star formation efficiency. We show that in order to explain their characteristics (masses, radii, metallicity and PDMF) their stellar initial mass function (IMF) must have been top heavy. It is found that the IMF is required to become more top heavy the lower the cluster metallicity and the larger the pre-GC cloud-core density are. The deduced trends are in qualitative agreement with theoretical expectation. The results are consistent with estimates of the shape of the high-mass end of the IMF in the Arches cluster, Westerlund 1, R136 and NGC 3603, as well as with the IMF independently constrained for ultra-compact dwarf galaxies (UCDs). The latter suggests that GCs and UCDs might have formed along the same channel or that UCDs formed via mergers of GCs. A Fundamental Plane is found which describes the variation of the IMF with density and metallicity of the pre-GC cloud cores. The implications for the evolution of galaxies and chemical enrichment over cosmological times are expected to be major.
1 INTRODUCTION
1.1 Are PDMF variations evidence for IMF variations?
The stellar present-day mass function (PDMF) is observed to be different for individual globular clusters (GCs) of the Galaxy. Their low-mass stellar content differs significantly (McClure et al. 1986; Djorgovski, Piotto & Capaccioli 1993; De Marchi, Paresce & Pulone 2007; Paust et al. 2010).
These differences are claimed to be explainable by a universal initial mass function (IMF) and secular two-body relaxation-driven evolution alone (Leigh et al. 2012), in agreement with earlier work that shows that an initially rising IMF with decreasing stellar mass can bend over in the course of a Hubble time (Vesperini & Heggie 1997; Baumgardt & Makino 2003). De Marchi et al. (2007) however noticed that clusters which are strongly depleted in low-mass stars have a low concentration while no such cluster with a high concentration exists. This trend has been argued to be incompatible with standard secular evolution by De Marchi et al. (2007) unless the majority of clusters with a flat or even declining low-mass PDMF are post-core collapse clusters. Paust et al. (2010) question the existence of such a trend since no very strongly depleted cluster is present in their sample. Their data however still closely follow the relation proposed by De Marchi et al. (2007).
Primordial mass segregation appears to come to the rescue of the secular evolution picture, since if low-mass stars form preferentially at the cluster outskirts they are easily stripped off the cluster by the tidal field of the host galaxy. There is then no need for the cluster to go into core collapse which would otherwise be necessary to drive the preferential evaporation of low-mass stars (Baumgardt, De Marchi & Kroupa 2008). However, these authors also show that some clusters reported by De Marchi et al. (2007) which are most strongly depleted in low-mass stars can only be understood if clusters fill their tidal radii. Tidally underfilling clusters cannot reach the observed degree of low-mass star depletion, even when they are close to dissolution (Baumgardt et al. 2008). Young star clusters of the Galaxy are however observed to be very compact (Lada & Lada 2003), not closely filling their tidal limits, and such initial conditions cannot be the dominant cause of low-mass star depletion.
Is the concentration–PDMF trend observed by De Marchi et al. (2007) therefore the first-time evidence for a variable low-mass IMF? Marks & Kroupa (2010) show that clusters with a flat or declining PDMF have the largest metallicity in the De Marchi et al. (2007) sample of clusters. Such a trend is difficult to understand in the dynamical evolution picture since it is unclear how dynamics could possibly know about the metal content of the cluster. Low-mass stars being deficient in metal-rich clusters is also difficult to understand if the low-mass IMF were to vary since relatively fewer low-mass stars would have to form with decreasing metallicity, in contradiction to theoretical expectation (Bastian, Covey & Meyer 2010; Kroupa et al. 2012). Furthermore, the concentration–PDMF trend is also difficult to reconcile with the assumption of a varying low-mass IMF: in dense, i.e. highly concentrated clusters, low-mass stars might disappear through merging in dense clusters so that low-mass stars would be expected to be underabundant in highly concentrated clusters, which is again contrary to the De Marchi et al. (2007) observation.
Thus, if standard two-body relaxation alone is not sufficient in removing low-mass stars and a varying low-mass IMF does not appear to be a feasible solution, where do the observed differences in the PDMF come from? Marks, Kroupa & Baumgardt (2008) propose a residual-gas expulsion scenario which addresses all these issues at once. They show that quick gas removal from compact, primordially mass-segregated clusters with binaries leads to low-concentration clusters which are depleted in low-mass stars, while initially binary-rich clusters with slow gas removal retain their input IMF, as observed by De Marchi et al. (2007). The expansion following gas expulsion (accompanied by the loss of primarily low-mass stars) naturally leads to tidally filling clusters with low concentration. This process is expected to be metallicity dependent since metal-rich material will couple better to the radiation driving the removal of the residual gas (Marks & Kroupa 2010). The resulting quicker gas expulsion, in turn, leads to more metal-rich clusters being more strongly depleted of low-mass stars, as observed. This gas expulsion scenario is in qualitative agreement with the finding by Strader et al. (2009) and Strader, Caldwell & Seth (2011) that mass-to-light ratios for M31 GCs are lower in relatively more metal-rich environments.
Thus, invoking gas expulsion there is no need for a variation in the low-mass IMF. In contrast, for stars more massive than ≈1 M⊙ theoretical arguments suggest that the massive star content should depend on the ambient conditions.
The Jeans mass (MJ∝ρ−1/2T3/2) is higher for denser (Larson 1998; Bate & Bonnell 2005; Bonnell, Clarke & Bate 2006) and warmer gas (Klessen, Spaans & Jappsen 2007) such that a higher average mass for stars is expected when favourable conditions are met. As both the temperature and density of the gas depend on its metallicity through less efficient cooling in lower metallicity environments, more massive stars should form from low-metallicity gas. Additionally, forming stars self-regulate their masses via radiative feedback (Adams & Fatuzzo 1996). Feedback is also expected to be metallicity dependent, as photons couple less efficiently to gas of lower metallicity. Anew, a lower metallicity should favour the formation of more massive stars. Therefore both the Jeans mass and the self-regulation arguments suggest the fraction of high- to low-mass stars to increase with decreasing metallicity.
Also, star clusters have been found to be rather compact when they reach their densest state (Testi, Palla & Natta 1998; Kroupa 2005; Scheepmaker et al. 2009; Marks & Kroupa 2010). The resulting density of stars is expected to have an influence on the IMF (Bonnell, Bate & Zinnecker 1998; Shadmehri 2004). Elmegreen & Shadmehri (2003) concluded that densely packed stars should lead to top-heavy IMFs, i.e. an IMF with more massive stars than expected from the canonical Kroupa (2001) IMF (equation 2 below), in the most massive clusters (e.g. GC progenitors) through merging. Weidner, Kroupa & Bonnell (2010) show, using a geometrical argument, that a high density will be a problem for the formation of individual stars in clusters more massive than ≈105 M⊙. And cluster formation at high star formation rates (SFRs) may lead to top-heavy IMFs by the heating of molecular gas through supernovae generated cosmic rays (the Papadopoulos CR heating; Papadopoulos 2010).
Finding observational evidence for a varying high-mass IMF is difficult. In GCs, stars more massive than 1 M⊙ have long since evolved away from the main sequence and cannot be observed. Rather weak direct observational evidence for top-heavy IMFs in young starburst clusters exists.
The Arches cluster (2–4 Myr), only ≈ 25 pc in projected distance from the Galactic Centre, should be subject to a very strong tidal field and is a prime candidate which has been reported to host a non-canonical population of high-mass stars. The measurements however differ widely (α3= 1.65–2.3 in equation 2; Figer et al. 1999; Stolte et al. 2002; Kim et al. 2006; Espinoza, Selman & Melnick 2009). The same holds true for the NGC 3603 cluster ( Myr), about 8 kpc from the Galactic Centre and 6 kpc from the Sun. Its reported mass function (MF) slope ranges from α3= 1.9 to 2.3 (Nürnberger & Petr-Gotzens 2002; Sung & Bessell 2004; Stolte et al. 2006; Harayama, Eisenhauer & Martins 2008). The most massive known young cluster in the Galaxy Westerlund 1 (Wd1, 4–7 Myr) in contrast has α3= 2.3 between 0.75 and 1.5 pc and α3= 1.6 closer in (Brandner et al. 2008). The 30 Dor region (≈3 Myr) in the Large Magellanic Cloud (LMC), having a mass comparable to Wd1, also exhibits no deviation from the canonical IMF (Selman & Melnick 2005, excluding the central cluster R136). R136 has α3= 2.2–2.6 (Brandl et al. 1996; Massey & Hunter 1998; Andersen et al. 2009). All reported clusters however show evidence for mass segregation, i.e. the results might be biased through dynamical effects (see, e.g., Portegies Zwart et al. 2007).
Better evidence for top-heavy IMFs is seen in ultracompact dwarf galaxies (UCDs). These objects are similar to GCs, given the ideas of their formation from star cluster complexes (Fellhauer & Kroupa 2005) or as the most massive GCs (Mieske, Hilker & Infante 2002), and are thus ideally suited to be compared to GCs. Observed dynamical-mass-to-light (Mdyn/L) ratios appear too large when they are compared to expectations from canonical stellar population models with the canonical IMF (Dabringhausen, Hilker & Kroupa 2008). Dabringhausen, Fellhauer & Kroupa (2010) explain these observations by invoking top-heavy IMFs for them, i.e. UCDs had non-canonical IMFs above 1 M⊙. The subsequent, primarily gas expulsion-driven evolution then turns them into objects which resemble the observed properties of UCDs today. The Dabringhausen et al. (2010) simulations show that top-heavy IMFs with 1 ≲α3 < 2.3 for proto-UCDs are indeed viable to explain the presently observed Mdyn/L ratios in them and their models resemble present-day UCDs in mass and size. This result is significantly strengthened by the overabundance of X-ray bright UCDs which is in excellent agreement with the surplus of neutron stars and black holes expected for a top-heavy IMF (Dabringhausen et al. 2012).
In this contribution it is shown that evidence for a top-heavy IMF also emerges for GCs if residual-gas expulsion from mass-segregated clusters starting with a universal low-mass IMF is responsible for the observed low-mass star depleted PDMFs (De Marchi et al. 2007), as suggested by Marks et al. (2008). In order to deplete a universal low-mass IMF in GCs to the observed degree through the gas throw-out phase, the IMF must have been top heavy in order for the high-mass stars to be sufficiently destructive to the gas content of the forming GCs.
1.2 Tracing the high-mass IMF in GCs via residual-gas expulsion
The IMF at the high-mass end can never be directly seen in Galactic GCs, since massive stars are short lived while GCs are old objects. Stars above the turn-off mass for GCs (≈0.8 M⊙) cannot be observed. However, the distribution of high-mass stars, which were present in a GC after its birth, can possibly be traced by indirect means.
Using the De Marchi et al. (2007) concentration, c= log (rt/rh), versus low-mass PDMF slope diagram as a diagnostic tool, SFEs, ε, pre-GC cloud-core masses, Mcl, half-mass radii, rh, and densities, ρcl, at star cluster birth are constrained for the sample of 20 GCs in De Marchi et al. (2007) for which PDMFs have been measured down to 0.3 M⊙ by comparison of observations with N-body models (Marks & Kroupa 2010). These cluster parameters will in the following be referred to as the initial conditions of GCs and are reported in Table 1.
The birth conditions for the GCs for which the PDMF has been measured from 0.8 down to 0.3 M⊙ by De Marchi et al. (2007). Columns 1 and 2 list the cluster name and its metallicity. The next four columns give the constraints (Marks & Kroupa 2010) on the initial GC cloud-core mass (Mcl), half-mass radius (rh), density within the half-mass radius (ρcl) and lower limit to the SFE (εlow), respectively. The last five columns are the assumed residual-gas expulsion time-scale, the here calculated required high-mass IMF slope (α3) and the corresponding number fraction (ηN, equation 16) and mass fraction (ηM, equation 17) of stars more massive than 1 M⊙, respectively, and the total-mass fraction lost due to stellar evolution (fsev) over one Hubble time.
| Cluster NGC | [Fe/H] | Mcl (106 M⊙) | rh (pc) | ρcl (106 M⊙ pc−3) | εlow | τM (Myr) | α3 | ηN | ηM | fsev |
| 104 | −0.76 | 9.40 | 0.49 | 9.54 | 0.25 | 0.1 | 1.34 | 0.25 | 0.94 | 0.84 |
| 288 | −1.24 | 1.43 | 1.63 | 0.04 | 0.40 | 0.1 | 2.36 | 0.09 | 0.53 | 0.43 |
| 2298 | −1.85 | 1.67 | 0.59 | 0.97 | 0.40 | 0.1 | 1.98 | 0.12 | 0.71 | 0.60 |
| Pal 5 | −1.41 | 0.56 | 7.52 | 2 × 10⁻⁴ | 0.40 | 0.1 | – | – | – | – |
| 5139 | −1.62 | 23.10 | 0.87 | 4.19 | 0.25 | 0.1 | 1.26 | 0.28 | 0.96 | 0.85 |
| 5272 | −1.57 | 5.48 | 0.47 | 6.30 | 0.33 | 0.1 | 1.54 | 0.19 | 0.90 | 0.79 |
| 6121 | −1.20 | 8.78 | 0.42 | 14.15 | 0.25 | 0.1 | 1.32 | 0.26 | 0.95 | 0.84 |
| 6218 | −1.48 | 2.72 | 0.64 | 1.24 | 0.33 | 0.1 | 1.81 | 0.15 | 0.79 | 0.68 |
| 6254 | −1.52 | 3.39 | 0.42 | 5.46 | 0.25 | 0.1 | 1.56 | 0.19 | 0.89 | 0.78 |
| 6341 | −2.28 | 6.73 | 0.23 | 66.03 | 0.15 | 0.1 | 1.11 | 0.34 | 0.98 | 0.87 |
| 6352 | −0.70 | 0.78 | 1.08 | 0.07 | 0.40 | 0.1 | 2.43 | 0.09 | 0.50 | 0.41 |
| 6397 | −1.95 | 1.76 | 0.17 | 42.76 | 0.15 | 0.1 | 1.37 | 0.24 | 0.94 | 0.83 |
| 6496 | −0.64 | 1.33 | 1.18 | 0.10 | 0.25 | 0.1 | 2.10 | 0.11 | 0.65 | 0.55 |
| 6656 | −1.64 | 4.52 | 0.42 | 7.28 | 0.20 | 0.1 | 1.43 | 0.22 | 0.93 | 0.82 |
| 6712 | −1.01 | 2.17 | 1.18 | 0.16 | 0.50 | 0.1 | 2.20 | 0.10 | 0.60 | 0.50 |
| 6752 | −1.56 | 3.68 | 0.24 | 31.78 | 0.15 | 0.1 | 1.27 | 0.27 | 0.96 | 0.85 |
| 6809 | −1.81 | 1.99 | 0.85 | 0.39 | 0.25 | 0.1 | 1.89 | 0.13 | 0.76 | 0.65 |
| 6838 | −0.73 | 0.30 | 0.47 | 0.34 | 0.50 | 0.1 | 2.60 | 0.08 | 0.44 | 0.35 |
| 7078 | −2.16 | 17.30 | 0.20 | 258.13 | 0.10 | 0.1 | 0.76 | 0.56 | 0.99 | 0.89 |
| 7099 | −2.12 | 3.30 | 0.23 | 32.38 | 0.15 | 0.1 | 1.29 | 0.27 | 0.95 | 0.85 |
In order to remove the gas from these clusters completely it needs to travel between ≈ 0.5 and 1.5 pc from the cluster centre to leave the cluster (compare to the rh reported in Table 1). If the gas travels with the speed of sound in the ionized ISM (about 10 km s−1≈ 10 pc Myr−1) the gas expulsion time, τM, becomes  yr. This is an estimate for the shortest time-scale on which gas can be expelled from a star cluster. It will be shown that gas cannot be removed within τM≈ 105 yr (≡τM for a cluster of size 1 pc) if the IMF above 1 M⊙ has been canonical but that instead a top-heavy IMF in dependence of the environment needs to be invoked (α3 in equation 2 varies).
1.3 The models
The following analysis relies on the Marks & Kroupa (2010) results. In order to obtain the initial conditions they assumed residual-gas expulsion to be the dominant phase driving the low-mass star depletion in GCs and to be the source of the De Marchi et al. (2007) concentration–PDMF slope relation. They used the residual-gas expulsion N-body model grid by Baumgardt & Kroupa (2007) to infer the mass loss and expansion through gas removal from embedded clusters. Marks & Kroupa (2010) assume that post-gas expulsion cluster expansion is only small compared to expansion driven by gas expulsion. Baumgardt et al. (2008) calculated initial masses for the De Marchi et al. (2007) sample of GCs assuming two-body relaxation-driven low-mass star depletion without gas, which Marks & Kroupa (2010) used as cluster masses after residual-gas throw-out in order to account for mass loss through long-term secular evolution. This finally allowed them to trace back present-day cluster masses and sizes to their initial values.
While the Marks & Kroupa (2010) results depend on the validity of these assumptions, it is the first time that initial conditions have been constrained for a large sample of real clusters. Undoubtedly improved initial conditions could be obtained by running N-body models including gas expulsion and two-body relaxation-driven evolution afterwards to self-consistently compare observational data with computations. Such N-body models of initially compact Mecl > 105 M⊙ clusters are currently however prohibitively expensive computationally. For the time being their results constitute the best available homogeneously obtained constraints on GC initial parameters. The results derived here should therefore not be considered to be a very final word, but they allow at the very least an important insight into star formation in massive star-bursting clusters at high redshift.
2 CONSTRAINING α3

 for m/ M⊙∈ [0.08, 0.5] and
  for m/ M⊙∈ [0.5, 1] and [1, mmax], respectively (Kroupa 2001). The physical stellar upper-mass limit is mmax≲ 150 M⊙, which depends on the mass of the cluster (Weidner et al. 2010).
Assuming the IMF to be canonical below 1 M⊙, we seek to infer the slope, α3, in order to remove the residual gas within a given time-scale, τM.
 , with the energy,
  , provided by O- and B-type stars within τM.
  is the difference between the initial binding energy of the cluster (with gas) and the binding energy after the gas has been expelled,
 is the total energy output by a single star of mass m. This energy can be calculated from (see Baumgardt, Kroupa & Parmentier 2008)
 is released by massive stars. The provided energy depends on the shape of the stellar IMF (equation 8) and therefore on the choice of α3 and mmax. The latter has been found to have a negligible influence on the results and is arbitrarily chosen as mmax= 120 M⊙. In order to evaluate equation (8), the coefficients k and ai in equation (2) are found by normalizing the canonical IMF to Mecl,
 , such that the energy is sufficient to remove the residual gas. Using the same k and ai for all α3 ensures that the number of low-mass stars, which provide the light after the massive stars extinguish, does not change.
3 RESULTS
Fig. 1 shows how the energy input through massive stars changes with the IMF index α3 using the example of NGC 6752. The steeper the IMF (the lower α3), the more massive stars are available and the more energy is deposited in the ISM (solid curve). NGC 6752 had to have a top-heavy IMF with α3= 1.27 in order for the OB-star energy input to equal the energy required to remove the gas (dashed line) from its progenitor ( ).
).
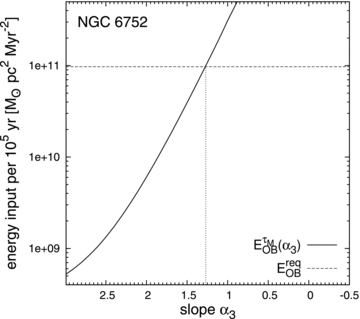
Energy provided by O- and B-type stars within 105 yr as a function of the high-mass IMF index, α3, for the Galactic GC NGC 6752 (solid curve). The horizontal dashed line indicates the energy,  , required to remove NGC 6752’s initial gas mass (equation 5). For an IMF index α3= 1.27, the energy input from massive stars within 105 yr is sufficient to overcome
  .
.
The results for the estimated α3 values in the sample of GCs are summarized in Table 1. For the respective initial conditions (Mcl, rh and ε, also listed in Table 1) the results imply that the IMFs above 1 M⊙ have been mostly top heavy (α3≈ 1…2.3, assuming that the residual gas is removed by radiation and winds from stars only). Slightly top-light IMFs are found for NGC 288, 6352 and 6838. A solution for Pal 5 could not be found unless an extremely top-light MF is allowed (i.e. a canonical IMF more than suffices to remove the gas in Pal 5). This is likely connected to Pal 5 being close to dissolution, as already discussed in Marks & Kroupa (2010).
To put these results into context, they are compared to independent theoretical and observational evidence for the existence of top-heavy IMFs in UCDs. Also, a comparison for different IMF observations in present-day Local Group starburst clusters (see Section 1) is performed.
For this comparison, the cloud-core masses and densities of the starburst clusters discussed in Section 1 are needed. These are estimated here using their present-day masses, half-mass radii and densities as compiled in Table 2 and assuming that the clusters have formed with ε= 1/3. Given the youth of these clusters, no significant mass loss apart from gas blowout is assumed to have occurred. Their cloud-core densities at birth, ρcl, were calculated similarly and assuming that their sizes did not yet change strongly during gas expulsion. The initial conditions for UCDs are readily available from the Dabringhausen et al. (2010) simulations.
Properties of starburst clusters in the MW and the LMC. From left to right the columns denote the cluster name, its age, stellar mass, Mecl, half-mass radius, rh, stellar density, ρecl, within rh, and range of published high-mass PDMF slopes, α3, from the references given in the last column.
| Name | Age (Myr) | Mecl (M⊙) | rh (pc) | ρecl (M⊙ pc−3) | α3 | References |
| Arches | 2–3 | 1.3 × 10⁴ | 0.24 | 1.12 × 10⁵ | 1.65–2.3 | 1–6 |
| NGC 3606 | 1–3 | 0.7 × 10⁴ | 0.2 | 1.04 × 10⁵ | 1.9–2.3 | 3, 4, 7–9 |
| Wd1 | 3–4 | 5 × 10⁴ | 1 | 5.96 × 10³ | 1.6–2.3 | 10 |
| R136 | 2–3 | 105 | 1.1 | 8.97 × 10³ | 2.2–2.6 | 11–13 |
Fig. 2 shows the dependence of the high-mass IMF slope on the pre-gas expulsion cloud-core mass. While the α3(Mcl) trend for UCD models and the constraints for GCs+starburst clusters are similar, both kinds of object appear to form separate sequences running parallel to each other. However, when describing α3 as a function of the birth cloud-core mass density, ρcl, i.e. incorporating information of the objects’ sizes, the independently obtained data agree excellently with each other (Fig. 3).
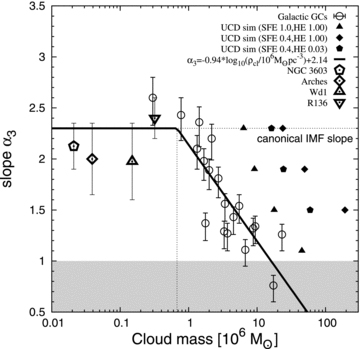
The high-mass IMF slope, α3, for GCs (open circles with error bars) decreases with increasing pre-GC cloud-core mass, Mcl (stars+gas). The solid line is a least-squares fit to the GC data and the corresponding equation is indicated in the legend. The IMF becomes canonical (α3= 2.3, horizontal dotted line) below 6.8 × 10⁵ M⊙ (vertical dotted line). The range of quoted MF slope values found in the literature for the massive, young clusters NGC 3603, Arches, Wd1 and R136 are indicated as the open pentagon, diamond, up- and downward triangle, respectively, with error bars being derived from the range of published α3 measurements. The overall trend is that more massive GCs form relatively more massive stars (flatter IMFs). The filled symbols correspond to the initial conditions of UCD simulations that lead, after primarily gas expulsion and stellar mass-loss-driven evolution, to objects that resemble the properties of observed UCDs today. Different symbols correspond to different input parameters in the UCD models (SFE and heating efficiency HE; see Dabringhausen et al. 2010). The UCD data form a separate group that runs roughly parallel to the GC data. Survival of GCs with α3 < 1 (grey shading) is questionable (Section 5).
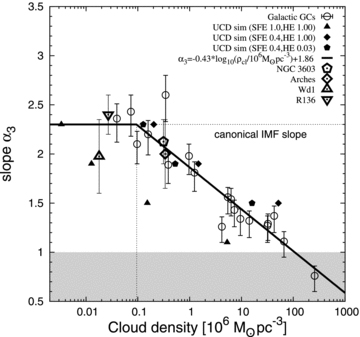
The high-mass IMF index, α3, versus the cloud-core density, ρcl (stars+gas). Symbols and lines as in Fig. 2. The gap between the GCs and UCDs seen in Fig. 2 vanishes and the IMF indices, α3, now form a single sequence as a function of ρcl: the IMF index at the high-mass end decreases (the IMF becomes flatter) with increasing density of the objects’ progenitor cloud core. It is canonical (α3= 2.3) below 9.5 × 10⁴ M⊙ pc−3.
Figs 2 and 3 thus suggest that the high-mass IMF was more top heavy (flatter) in more massive and denser environments. The expectation would indeed be that denser systems form more massive stars with respect to the canonical IMF, if a channel for massive star formation is the coagulation of protostellar cores since the collision probability is higher in denser systems, where the stars may also have larger accretion rates (Murray & Lin 1996, section 1) and/or the Papadopoulos (2010) cosmic-ray heating is active in star bursts.
Finally, Fig. 4 depicts α3 as a function of the present-day global metallicity for the GC and Local Group starburst cluster data. Metal-poorer environments appear to form flatter IMFs. Again, this reflects the theoretical expectation: in systems of low metallicity the Jeans mass is larger favouring the formation of more high-mass stars (Adams & Fatuzzo 1996; Larson 1998). A straightforward least-squares fit to the GC data suggests the IMF to become canonical above [ Fe/H ] =−0.5.
![The high-mass IMF index, α3, as a function of the global cluster metallicity, [Fe/H]. Symbols and lines as in Figs 2 and 3. NGC 3603, Arches and Wd1 have about solar metallicity. For R136 [Fe/H] ≈−0.48 is adopted, a typical value for the LMC. The data suggest the IMF to become less top heavy with increasing cluster metallicity, having the canonical value (α3= 2.3) above [Fe/H] =−0.5.](https://oup.silverchair-cdn.com/oup/backfile/Content_public/Journal/mnras/422/3/10.1111_j.1365-2966.2012.20767.x/1/m_mnras0422-2246-f4.jpeg?Expires=1749864431&Signature=02LiBc41y0Z2j0YTitA4G3dGVsVtgRFO3lrE0eerTopgwRiKmRea0PcldmJjTL8O3O3~Tyn2uQH0v8UmuFjqlRjJtOzGfIp7QyMPxj0FizfpGg3KxrTLmkzmZHqJDfO8wB37oHSUiGaklBJb~RZkOJql0QBcyl14b0DWxwtQGV8LninzUNMIWv~MiENNVD7Tb~7JQ8Tc2uW5LrkVSShi7Ao-az3MFZ0E6OIhZyNLI0Pjm5DDaQRQnQ~~g-7UWDrtxX4iZsJBaFIZ-2v8x1fbD~IaqLbdvdeNklUHYHJQakEyrKPrRIEp~yTOlU2E6Nr0MmGUZPzqCWb7iNhEHsqp2A__&Key-Pair-Id=APKAIE5G5CRDK6RD3PGA)
The high-mass IMF index, α3, as a function of the global cluster metallicity, [Fe/H]. Symbols and lines as in Figs 2 and 3. NGC 3603, Arches and Wd1 have about solar metallicity. For R136 [Fe/H] ≈−0.48 is adopted, a typical value for the LMC. The data suggest the IMF to become less top heavy with increasing cluster metallicity, having the canonical value (α3= 2.3) above [Fe/H] =−0.5.

Coefficients (equation 11) for a least-squares fit to the GC data (Figs 2–4). Additionally, coefficients for the dependence of α3 on the stellar mass (Mecl=ε×Mcl) forming from the cloud cores are given. Mecl and Mcl are in units of 106 M⊙ and ρcl is in units of 106 M⊙ pc−3.
Coefficients (equation 11) for a least-squares fit to the GC data (Figs 2–4). Additionally, coefficients for the dependence of α3 on the stellar mass (Mecl=ε×Mcl) forming from the cloud cores are given. Mecl and Mcl are in units of 106 M⊙ and ρcl is in units of 106 M⊙ pc−3.
 are the respective slopes of the canonical IMF (Section 1). The variation described by equation (12) is incorporated in Fig. 5. Note that this parametrization has been suggested for metallicities ≳−0.5. For the lower metallicities needed here the calculated low-mass IMF slopes are thus extrapolated values. Furthermore this variation is not incorporated in the Marks & Kroupa (2010) models and cannot be used to explain the observed low-mass star depletion in the observed GCs: using equation (12) the IMF becomes steeper with increasing metallicity, contrary to observations of the PDMFs (Section 1). The resulting IMF indices, αi, are reported in Table 4.
![Suggested shape of the stellar IMF for different metallicities, [Fe/H] (not taking into account the density dependence of the IMF). The IMFs are scaled such that their values agree at m= 1 M⊙. Above 1 M⊙ the IMF slope is determined by the present work (Fig. 4, equation 11). Below 1 M⊙ the parametrization is determined by Kroupa (2001, equation 12), whose results suggest tentative evidence that more metal-rich environments produce relatively more low-mass stars. Note that only the metallicity dependence is shown, but not the dependence on mass (Fig. 2) or density (Fig. 3).](https://oup.silverchair-cdn.com/oup/backfile/Content_public/Journal/mnras/422/3/10.1111_j.1365-2966.2012.20767.x/1/m_mnras0422-2246-f5.jpeg?Expires=1749864431&Signature=h87en~MG5jBDq9yx1DRMJCRlEf1zKgr9sYMsUQWi4b4LMZ6lDFQHW0E55ZpgZLFKfQybA95-n1nB7Ahb0NBboQOFB-CMe6XzuMP6h365~WVkeZc5SqyCypJb00dWbdSHtoAR1luyDjAc3XOrZ6mqUDkebKO25q6nKjc01l~lE-NUEL3hCWzJVnBMR7KeFXpxn9jYonuF2NohBhOaQTghxE5ZwoY6s8TVTFDae26SHdg307lY41GQ~02dbnM~XWGCYFi8yBtY6V1ZRB7e6vyDODWl0hlBoGbAuTjIe-4AQ6-0~3v2iKUopgkJQGxuvnOAq1D~hIXec5QGXjlD8QPpfA__&Key-Pair-Id=APKAIE5G5CRDK6RD3PGA)
Suggested shape of the stellar IMF for different metallicities, [Fe/H] (not taking into account the density dependence of the IMF). The IMFs are scaled such that their values agree at m= 1 M⊙. Above 1 M⊙ the IMF slope is determined by the present work (Fig. 4, equation 11). Below 1 M⊙ the parametrization is determined by Kroupa (2001, equation 12), whose results suggest tentative evidence that more metal-rich environments produce relatively more low-mass stars. Note that only the metallicity dependence is shown, but not the dependence on mass (Fig. 2) or density (Fig. 3).
IMF indices, αi, in equation (2) in dependence of the metallicity, [Fe/H]. The indices α1/2 are calculated from equation (12) and α3 is obtained using equation (11) with the parameters in Table 3. For [Fe/H] = 0.0 the IMF is canonical everywhere. The IMF metallicity variation is depicted in Fig. 5.
| [Fe/H] | α1 | α2 | α3 |
| −2.0 | 0.30 | 1.30 | 1.31 |
| −1.5 | 0.55 | 1.55 | 1.64 |
| −1.0 | 0.80 | 1.80 | 1.97 |
| 0.0 | 1.30 | 2.30 | 2.30 |
| +0.5 | 1.55 | 2.55 | 2.30 |
| +1.0 | 1.80 | 2.80 | 2.30 |
| [Fe/H] | α1 | α2 | α3 |
| −2.0 | 0.30 | 1.30 | 1.31 |
| −1.5 | 0.55 | 1.55 | 1.64 |
| −1.0 | 0.80 | 1.80 | 1.97 |
| 0.0 | 1.30 | 2.30 | 2.30 |
| +0.5 | 1.55 | 2.55 | 2.30 |
| +1.0 | 1.80 | 2.80 | 2.30 |
4 A FUNDAMENTAL PLANE FOR α3, logρcl AND [Fe/H]
In this section, a formula, α3(log ρcl, [Fe/H]), is derived in order to describe the dependence of α3 on density and metallicity for GCs simultaneously. The idea is to find a Fundamental Plane, p, in (α3, log ρcl, [Fe/H]) space which minimizes the scatter of α3 values around p.

![Edge-on view of the Fundamental Plane, p (equation 14, solid regression line), for the IMF index, α3, cluster density, log10ρcl, and metallicity, [Fe/H]. The abscissa is the new axis, x′, in which the scatter around the solid regression line through the data projected on to the α3–x′ plane is minimal (equation 13).](https://oup.silverchair-cdn.com/oup/backfile/Content_public/Journal/mnras/422/3/10.1111_j.1365-2966.2012.20767.x/1/m_mnras0422-2246-f6.jpeg?Expires=1749864431&Signature=cwYu23dNAmrvZul4Dpth9xZcNPO~NXrlsbk~Qqh6BzS8Lvx28dyF1pY1x7~95WL6tTboFyGa3ENHr4jXxdryducglSRR1xbQQQw48LzlQd71G8JJCT4Z3k7Al6EyODJcxuFyikJk~OPtBgKBAblpFLncqxhVWrWJepnqhV1jB27VX7fexw2MzzQeKcdolaovatVga~TsxkJQLKHI5SiYfR5RADJ4Q92PhaLD-Nl8m08O1SRFL21RZaYPwNMOw7x3sSJbh6MoOU41Zs--lg~-eOXz3gUWYXN5F7H0BNkhgpuQpScMPPFjgckO3a60Yn1DghYOrx7m78WpiI~QHn2LVQ__&Key-Pair-Id=APKAIE5G5CRDK6RD3PGA)
Edge-on view of the Fundamental Plane, p (equation 14, solid regression line), for the IMF index, α3, cluster density, log10ρcl, and metallicity, [Fe/H]. The abscissa is the new axis, x′, in which the scatter around the solid regression line through the data projected on to the α3–x′ plane is minimal (equation 13).
The stronger dependence on log ρcl can be understood as follows: a dense cluster forming from gas with solar metallicity will still produce a top-heavy IMF, although the [Fe/H] dependence alone (Fig. 4) suggests the canonical slope. Vice versa, a more extended cluster with low [Fe/H] will not be as top heavy as expected from Fig. 4.
The procedure used here is similar, but not equivalent, to a principal component analysis.
5 SURVIVAL OF GCs WITH TOP-HEAVY INITIAL MASS FUNCTIONS AND CAVEATS
The combined information from this work, from the independent analysis of the top-heaviness in UCDs and the (rare and weak) observational evidence of top-heavy IMFs in starburst clusters, which are remarkably consistent with each other, suggests that some presently old dense stellar systems might have formed stars which were selected from a top-heavy IMF. The flatness of the high-mass end of the IMF reflects the metal content and the density of the environment in which the respective objects were born.
Lüghausen et al. (in preparation) investigate, by means of N-body computations, the survival of star clusters with a top-heavy IMF having stellar masses between 5000 and 25 000 M⊙ and half-mass radii between ≈0.4 and 1 pc. They find that their models, having average stellar densities within the half-mass radius up to ≈2 × 10⁴ M⊙ pc−3, with an IMF index α3≤ 1.0 immediately dissolve through strong stellar evolution-driven mass loss and an accelerated dynamics (for a fixed cluster mass the relaxation time becomes shorter with increasing top heaviness due to the smaller number of stars). Slightly less top-heavy models are not very long lived. The birth stellar densities for the Galactic GCs (Table 1) are however two to four orders of magnitudes larger than the density range covered by Lüghausen et al. (in preparation). In particular, survival is likely to become possible when the crossing time, tcr, becomes shorter than the stellar evolution time-scale  for massive stars, where
  is the mass-loss rate of a star of mass m. Therefore, survival of such dense objects with extremely top-heavy IMFs remains to be checked numerically.
The constraints on the top heaviness were derived assuming that the energy for gas removal is provided by stellar winds and radiation only and all energy radiated by the stars is completely absorbed by the gas. This is likely to be an oversimplification (Dale et al. 2005). If the initially most massive clusters are able to retain the residual gas in their deep potentials until supernovae occur, their energy input might be sufficient to remove the gas in ≈105 yr. Additionally, the metal content might influence the gas throw-out through radiation↔gas/dust coupling leading to different energy absorption efficiencies (Marks & Kroupa 2010). Both effects need to be considered in future work.
The parametrization (equations 11 and 14) should therefore not be seen as an established dependence on the cluster initial parameters. Instead it is suggestive of what IMF variation the present observational data suggest.
6 CONCLUSIONS
This work has shown that in order to remove the residual gas within ≈105 yr after star formation from progenitors of some Galactic GCs (Marks & Kroupa 2010) starting with a universal low-mass IMF, top-heavy IMFs need to be invoked. The IMF index/slope α3 in equation (2) takes values between 1 (very top heavy) and 2.3 (the canonical Salpeter/Massey value). Although long-term survival for some GCs with strongly top-heavy IMFs might be at threat through stellar evolution alone, self-consistent modelling of very dense GCs with a top-heavy IMF is needed to investigate their survival chances. The index α3 anticorrelates roughly log-linearly with the pre-gas expulsion cloud-core mass and density (Figs 2 and 3) and correlates linearly with the GC metallicity (Fig. 4).
Combining the density and metallicity dependence of α3, a Fundamental Plane has been found which describes the variation of the IMF with both parameters simultaneously. The Fundamental Plane suggests that α3 varies more strongly with density than with metallicity.
Large mass-to-light ratios in UCDs indicate this class of objects to have formed with a top-heavy IMF as well (Dabringhausen et al. 2008). The data from Dabringhausen et al. (2010) on probable initial conditions of observed UCDs form a separate group of objects in the α3–cloud-core mass diagram but run roughly parallelly to the GC data (Fig. 2). The disappearance of this gap when α3 is depicted against the cloud-core density (Fig. 3) might suggest that UCDs form from mergers of GCs in cluster complexes (Fellhauer & Kroupa 2005; Assmann et al. 2011; Brüns et al. 2011), which moves merged GCs of the same top heaviness to higher UCD masses in Fig. 2.
The decreasing trend of α3 with increasing density is qualitatively understood since denser systems are expected to form more massive stars with respect to the canonical IMF, if a channel for massive star formation is accretion-driven coagulation of protostellar cores due to a higher collision probability (Murray & Lin 1996). And in systems of low metallicity the Jeans mass is expected to be larger favouring the formation of more high-mass stars (Adams & Fatuzzo 1996; Larson 1998).
Are these dependences compatible with observations of young clusters in the Local Group? For the MW and for the LMC the answer is positive (Figs 2–4). Although the known Local Group starburst clusters lie just in the density regime where the IMF starts to become top-heavy (ρcl≳ 9.5 × 10⁴ M⊙ pc−3) the observations are consistent with the results. For the densities of these clusters, stellar dynamical biases would probably hide any true present top-heavy IMF due to mass segregation (Portegies Zwart et al. 2007). Massey (2003) shows homogeneously estimated MF slopes for OB associations in the MW and LMC finding all of them to be consistent with the Salpeter slope (α= 2.35). For the LMC clusters ([Fe/H] ≈−0.4) and solar metallicity MW clusters this is consistent with the results in this work (Fig. 4), given that the star-forming densities in the Local Group are <105 M⊙ pc−3.
A similar, but slightly different parametrization of α3 with the stellar cluster mass, Mecl (Table 3), has been made use of in Weidner, Kroupa & Pflamm-Altenburg (2011) to include the evidence for a systematically varying IMF into the framework of the theory of the integrated galactic IMF (IGIMF, i.e. the stellar IMF of whole galaxies; Kroupa & Weidner 2003; Weidner & Kroupa 2005). Under conditions when the galaxy-wide SFR > 27 M⊙ yr−1 starburst clusters with masses Mecl > 106 M⊙ form (Weidner, Kroupa & Larsen 2004). The IGIMF, being the sum of all IMFs in all young star clusters, then also becomes top heavy.1 Their models lead to reasonable agreement with cosmological observations. The results obtained here are explicitly incorporated into the IGIMF framework in Kroupa et al. (2012), where, for example, it is shown that the IGIMF of the Galactic bulge agrees with the chemical abundance constraints. In which way the chemical evolution of galaxies over cosmological time would be affected by a top-heavy IGIMF is subject to further studies.
To conclude, varying the low-mass IMF in order to explain the observed PDMFs (and, in turn, to avoid top-heavy IMFs) in GCs does not appear to be a feasible solution. GCs formed with the canonical IMF over all stellar masses and evolving secularly over a Hubble time cannot lead to the observed concentration–PDMF correlation, unless they are born mass segregated and filling their tidal radii. But this begs the question how such distended mass-segregated clusters can form in the first place.
Instead, initially concentrated, dense ≲1 pc large mass-segregated massive progenitors of present-day GCs uncover evidence for a systematically varying high-mass IMF with density and metallicity, in remarkably good agreement with the independently obtained evidence for top-heavy IMFs in UCDs by Dabringhausen et al. (2010). The suggested trend is qualitatively in agreement with the expectation that higher density and lower metallicity environments should form more top-heavy IMFs (see Section 1). Observations are consistent with the trend derived here but MF measurements for initially denser clusters than NGC 3603 and the Arches cluster are likely needed to conclusively test the behaviour for the high-mass IMF suggested here.
MM was supported for this research through a stipend from the International Max Planck Research School (IMPRS) for Astronomy and Astrophysics at the Universities of Bonn and Cologne. JD thanks the DFG for support through grant KR1635/13. MSP acknowledges support through DFG research grant KR 1635/18-2 in the frame of the DFG Priority Programme 1177, Witnesses of Cosmic History: Formation and evolution of galaxies, black holes and their environment and through the Bonn-Cologne Graduate School of Physics and Astronomy.
Footnotes
Top heavy here also means relative to the canonical IMF.
REFERENCES
